Your CRM is full of contacts, your e-commerce order history, marketing campaign data, support tickets, and maybe even Excel spreadsheets created by different teams. It’s all there. It’s all useful. But often, it’s all jumbled together.
For many small and medium-sized businesses, the problem isn’t a lack of data. It’s a lack of structure. A retail manager wants to understand which customers have similar buying patterns. An operations manager wants to see which products sell well together. A finance team wants to distinguish between normal behavior and patterns that warrant attention. Without a clear method, data remains a mere repository rather than a guide.
This is whereagglomerative hierarchical clustering comes into play. It is a machine learning technique that organizes observations into groups by building a hierarchy from the bottom up. It’s not a new concept. It’s a well-established technique: introduced in the 1960s, it was already applied in Italy in 1985 in a project on socioeconomic data that reduced 50 regions to 7 main clusters (reference cited here). This matters because it demonstrates a simple fact: when data appears chaotic, hierarchical clustering can reveal a discernible structure.
If you want to start with a broader view of how data is used in a business, this guide to business data analysis is an excellent resource.
Monday morning. The sales manager opens the CRM, the marketing team reviews campaigns with widely varying results, and the logistics team flags products with unpredictable turnover rates. The data is there, but there’s no clear roadmap to guide decision-making.
This is where an SME manager starts asking the right questions. Which customers actually exhibit similar behavior? Which products warrant a distinct strategy? Which locations or business areas should be managed differently, even if they all end up in the same report today?
Agglomerative hierarchical clustering transforms this chaos into a clear structure. Instead of immediately imposing predefined categories, it organizes elements based on similarity and shows how groups take shape step by step. The result is not merely a statistical exercise. It provides concrete support for market segmentation, operational priorities, and positioning decisions.
For a company, the point isn’t to know the name of the algorithm. The point is to make effective use of three practical tools: choosing the right linkage for your specific situation, interpreting a dendrogram without getting bogged down in technical details, and knowing where to split the hierarchy to obtain clusters that are useful for the business.
This is the difference between an academic approach to clustering and its managerial application.
If you’re already working on segmentation, reporting, or business data analysis to make faster, more informed decisions, this method helps you uncover relationships that remain hidden in Excel spreadsheets. And with tools like ELECTE, even an SME without a team of data scientists can integrate this approach into its daily processes—from data analysis to operational decisions.
Agglomerative hierarchical clustering starts from the bottom. Each record begins as a separate cluster. The algorithm then compares similarities, merges the two closest elements, and repeats this process until a complete hierarchy is built.
For an SME, this approach is useful because it reflects a realistic decision-making process. At the outset, you don’t yet know exactly how many segments you need. You only know that some customers behave similarly, that certain products follow comparable patterns, and that some areas of the business are worth examining together. Agglomerative clustering organizes these relationships without forcing you to set a specific number of groups right away.

The operating mechanism is straightforward:
This is where a point of confusion often arises. The algorithm doesn’t immediately return “the right 4 clusters” or “the correct 6 segments.” It first constructs a k-nearest neighbors map. The decision on how many groups to retain comes later, when you interpret that hierarchy in light of the business objective.
An example might help. If you’re analyzing your customer portfolio, you might find that some customers are similar in terms of purchase frequency, others in terms of average spend, and still others in terms of seasonality. Agglomerative clustering doesn’t force you to choose a level of detail right away. It lets you see both micro-groups—useful for targeted campaigns—and macro-segments—useful for defining budgets, service levels, and business priorities.
The practical difference compared to methods like k-means is simple. With k-means, you have to decide in advance how many clusters you want to find. With agglomerative hierarchical clustering, you build a hierarchy and then decide where to stop.
For a manager, this makes a big difference. It means being able to start with an open-ended question, rather than a preconceived answer. If the sales team suspects that there are different customer profiles but doesn’t yet know how many there are, this method provides a more useful framework for discussing a strategy.
There’s another reason why it’s popular. The results are easy to understand. You don’t just get final labels assigned to the records; you also get a step-by-step process showing how the groups are formed. It is precisely this hierarchical structure that makes the method valuable for business decision-making, because it links statistical analysis to a practical choice: where it makes sense to separate groups in order to gain actionable insights.
Rule of thumb: Use hierarchical clustering when you want to explore the data structure before defining stable operational segments.
If you want to compare this approach with other machine learning algorithms for different business problems, it makes sense to evaluate them based on the decision you need to make, not just the technique.
Two companies can use the same algorithm and end up with very different segmentations. The reason, almost always, lies here: in the choice of how to measure distance and how to decide which groups to merge.
For an SME manager, this isn’t just a technical detail. It’s a decision that affects the bottom line. It can lead to useful clusters for marketing campaigns and pricing, or to confusing groups that the team can’t make use of.
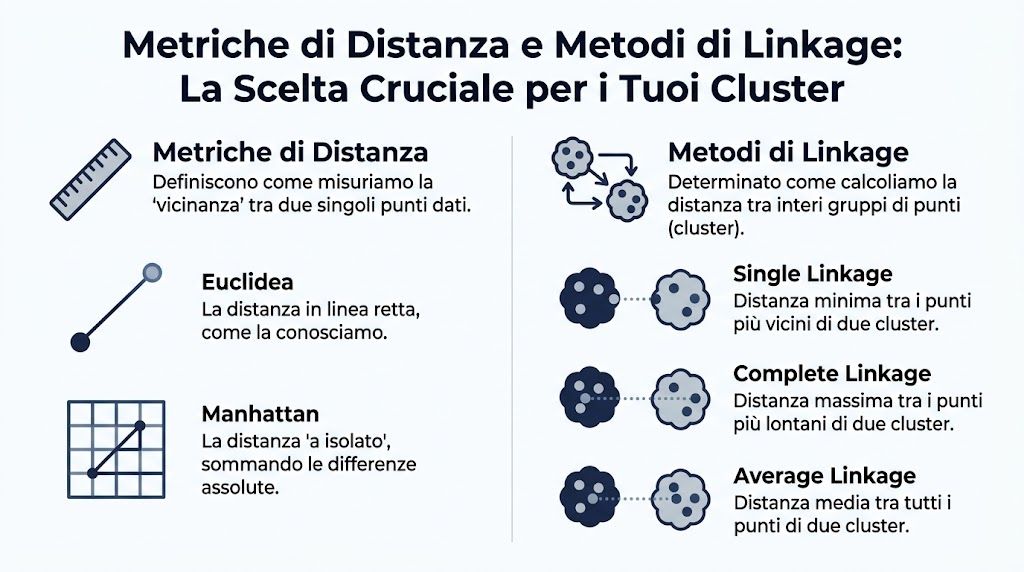
A distance metric is used to measure how different two observations are from one another. Whether you’re analyzing customers, products, or retail locations, it’s the standard by which the algorithm compares profiles.
The most common ones are:
This is where a common mistake arises. If one variable has a much wider range than the others, it will end up dominating the distance calculation. In practice, the clustering will be based almost entirely on that column. For this reason, before choosing a linkage method, it is advisable to check whether the data has been standardized.
Linkage comes into play later. It doesn't compare two individual points, but rather two pre-formed groups.
Here’s a good analogy: the metric determines how you measure the distance between two stores on a map. The linkage determines how you assess the distance between two entire retail chains. It makes a big difference.
The main methods are:
| Linkage Method | How It Works | Pro | Against | Ideal for |
|---|---|---|---|---|
| Single Linkage | Use the minimum distance between points in two clusters | Capture progressive connections | It can create "chained" clusters that are not very compact | Highly connected patterns, initial exploration |
| Complete Linkage | Use the maximum distance between points in two clusters | Generate more compact clusters | It may separate groups that are naturally close together | Segmentations where homogeneity matters |
| Average Linkage | Average distances between points in the two clusters | A good compromise | Less straightforward to explain to the business | Balanced analyses |
| Ward | Minimizes the increase in intra-cluster variance | Creates stable and readable partitions | Requires properly formatted numeric variables | Customer segmentation, business analysis |
The right choice depends on the decision you need to make at work, not on some abstract preference.
If your goal is to identify clusters linked by progressive similarities, single linkage can be useful during the exploratory phase. If, on the other hand, you need to create distinct segments to assign to campaigns, price lists, or service levels, in many cases complete linkage or Ward’s method produce clusters that are easier to interpret. Average linkage is often a good middle ground when you want to avoid both overly rigid clusters and overly elongated structures.
Rule of thumb: If you need to present the clusters to sales, marketing, or management, start with Ward’s method. If the results seem too “forced,” compare them with average linkage.
In academic guides, the discussion often stops at the definition. In the business world, however, a decision-making framework is needed.
Use this track:
In other words, there is no single "best" method. There is, however, the method that best aligns with the business need.
Let’s say you want to segment the customers of a small retail business using purchase frequency, average order value, and the number of product categories purchased.
With single linkage, you might end up with a very broad cluster, formed by gradual transitions between customers who are quite different from one another. This is useful if you want to observe continuity in behavior, but less so if you need to create distinct marketing actions.
With complete linkage, the clusters become tighter. Customers within each cluster are more similar to one another, making it easier for the marketing team to create targeted promotions.
With Ward, you often get well-organized, easy-to-read segments. That’s why it’s a popular choice when the goal isn’t just to analyze, but to reach a decision.
Agglomerative hierarchical clustering can be computationally intensive on large datasets. This has tangible consequences: longer processing times, higher memory requirements, and less flexibility for quickly testing different metrics and linkage methods.
For an SME, the point isn’t to get bogged down in theoretical discussions about algorithms. The point is to determine whether the analysis will remain feasible given the available data, the team’s time constraints, and the tools currently in use.
That is why the technical decision should address three simple questions:
This is where a platform like ELECTE becomes handy. It simplifies the most technical aspects of configuration and makes it easier to compare different options, even if you don’t have an in-house team of data scientists. The value isn’t in “doing clustering.” It’s in choosing a segmentation that the business can understand, validate, and use.
The true value of agglomerative hierarchical clustering becomes apparent when you look at its most common output: the dendrogram. It is not merely a decorative graph. It is a decision map.

On the horizontal axis, you’ll find observations, or small groups of observations. On the vertical axis, you’ll see the distance or dissimilarity at which the mergers occur.
The most important rule of thumb is this: the higher up a merger occurs, the more different the merged groups were.
This allows you to do something that many managers immediately appreciate. You’re not simply accepting a number of clusters determined by some “black box” formula. You’re looking at the data structure and deciding where it makes sense to stop.
For example:
A dendrogram translates a statistical decision into a visual one. That’s why it’s useful in meetings as well, not just in Python notebooks.
A visual aid can help reinforce the concept:
Many people get stuck here. “How many clusters should I have?” The honest answer is: it depends on the problem you want to solve.
If you need to take action, too many clusters can complicate operations. If you’re analyzing very different behaviors, too few clusters risk obscuring useful patterns.
Here is a practical guideline:
Let’s say the cut intersects four main branches. You end up with four segments. At that point, management is no longer a matter of statistics. It becomes a matter of interpretation.
Ask yourself:
Practical tip: The best dendrogram isn’t necessarily the most elegant one. It’s the one that allows you to justify your segmentation choice to the people who will be using it.
You have a customer dataset, a few useful variables, and a specific question: Are there groups that warrant different marketing approaches? Python is exactly what you need to turn this question into a quick, readable, and reproducible test.
To do this, people typically use scikit-learn to build the model and SciPy to plot the dendrogram. The technical side of things is straightforward. What really makes a difference for an SME is properly preparing the data and interpreting the results with care.
The most common mistake occurs even before the algorithm comes into play. If you include both a variable like annual revenue and one like the number of orders in the same model, the one with the larger scale is likely to carry much more weight. The resulting cluster, therefore, reflects the units of measurement more than the actual similarities between customers or products.
Standardization helps avoid this problem. In practice, it brings numerical variables onto a comparable scale. It’s a simple choice, but it makes a real difference in the results, especially if you want to use Ward’s linkage, which works well with properly prepared numerical data.
Before launching the model, check three things:
Here’s a useful analogy: you’re comparing customers as if you were evaluating them using the same unit of measurement. If one is measured in euros and another in raw counts, the comparison is already skewed from the start.
Here is a simple example using scikit-learn:
import pandas as pdfrom sklearn.preprocessing import StandardScalerfrom sklearn.cluster import AgglomerativeClustering# Esempio: dataset con variabili numerichedf = pd.DataFrame({"frequenza_acquisto": [12, 10, 2, 3, 15, 1],"scontrino_medio": [80, 75, 20, 25, 95, 15],"numero_categorie": [5, 4, 1, 2, 6, 1]})# 1. Scalingscaler = StandardScaler()X_scaled = scaler.fit_transform(df)# 2. Modellomodel = AgglomerativeClustering(n_clusters=3,linkage="ward")# 3. Assegnazione clusterlabels = model.fit_predict(X_scaled)df["cluster"] = labelsprint(df)The code is short. What matters most is the managerial perspective.
In this example, you are telling the model: "Group these observations into 3 clusters, progressively merging the most similar cases." The final result is the column cluster, that is, the label assigned to each row in the dataset. That’s where the work that’s useful for the business begins: understanding what distinguishes cluster 0 from cluster 1, and what decisions they warrant.
If you also want to view the complete hierarchical structure, you will typically use scipy.cluster.hierarchy.linkage together with dendrogram. Scikit-learn helps you identify clusters. SciPy helps you understand how they formed.
In a business setting, the value of clustering does not depend on the complexity of the notebook. It depends on the quality of three decisions.
Here we see the difference between a technical exercise and a decision-making tool. A manager doesn’t need to “do clustering” in the abstract. They need segments that can be named, explained, and used.
So, if you’re working in Python, don’t stop at the label assigned by the model. Look at the average of the variables for each cluster, compare the resulting profiles, and ask yourself right away: does this group require a different approach than the others? If the answer is no, the problem isn’t the code. It’s usually in the choice of variables, the linkage method, or the cutoff point.
An algorithm is truly valuable when it leads to concrete action.Agglomerative hierarchical clustering becomes useful when it transforms database rows into segments that the business can use.
Many small and medium-sized businesses still segment their customers in a very basic way. Age, geographic area, perhaps revenue bracket. It’s a start, but it’s often not enough.
With hierarchical clustering, you can combine behavioral variables such as purchase frequency, average order value, preferred categories, and response to promotions. The result isn’t just a list of profiles. It’s a hierarchy that shows you which groups are truly similar to one another and which ones should be targeted with different messages.
This helps the marketing team make more informed decisions:
In retail and e-commerce, clustering isn’t just about understanding people. It’s also about understanding products.
You can group products based on sales patterns, cross-purchases, seasonality, or response to promotions. This helps improve various operational decisions:
The managerial benefit here is clear. You’re not looking at individual SKUs in isolation. You’re identifying product families that can be planned together.
When products are grouped in similar clusters, reordering and promotional decisions also become more consistent.
In finance, clustering can help distinguish normal patterns from those that warrant further analysis. It does not replace regulatory controls or specialized models, but it can serve as a useful tool for grouping similar behaviors and identifying anomalies.
There is also an interesting trend in cybersecurity. An emerging trend involves the use of advanced AHC for network traffic in Italian SMEs. In 2025, ransomware attacks on Italian IT SMEs rose by 27%, and AHC frameworks based on inner-products improved outlier detection by 18% on Italian network traffic datasets (JMLR reference cited here).
It’s important to interpret this correctly. It doesn’t mean that every SME needs to immediately build a security clustering pipeline. It does mean, however, that hierarchical clustering isn’t limited to marketing or retail. It can serve as a cross-functional analytical framework, ranging from customer behavior to risk monitoring.
You have customer data in your CRM, orders in your e-commerce system, profit margins in an Excel file, and some operational information in your business management software. As long as these remain separate, clustering remains a theoretical exercise. For an SME, the problem isn’t understanding that clusters can be useful. The problem is arriving at clusters that are meaningful, consistent, and reliable enough to guide a business or operational decision.
This is where a platform like ELECTE reduces manual work and makes the process more practical for decision-makers, not programmers.
In practice, there are four recurring obstacles.
The most overlooked point is precisely this: the algorithm alone isn’t enough. You need a process that takes you from raw data to a segmentation that the business can actually use. ELECTE helps right from the start by seamlessly connecting your company’s data sources. If you’d like to see which integrations are available, check out the page on connectable data sources in ELECTE.

There is also a second challenge, one that is more strategic than technical. Choosing the wrong linkage method can result in segments that are of little use to the company, even if the model was run correctly. A manager does not need to know every mathematical detail. They need to understand which configuration generates segments stable enough to support a campaign, a stock policy, or a review of the customer portfolio.
With an automated workflow, the process resembles a well-organized production line more than a series of manual tests. Data is fed in, processed consistently, multiple configurations are compared, and the final output is delivered in a readable format.
Specifically, the process can follow these steps:
The benefit isn't automation itself. It lies in the fact that the team's time is redirected toward what matters most: interpreting the dendrogram, choosing the appropriate level of segmentation, and deciding what to do with those groups.
For an SME, this makes a big difference. Instead of wondering whether to use Ward, average, or complete clustering in an abstract sense, the comparison becomes practical: which method produces clearer clusters for our customers, our products, and our goals? ELECTE makes this question more accessible even without an in-house team of data scientists.
Automation, therefore, does not replace managerial judgment. It places it at the right stage of the process.
Agglomerative hierarchical clustering isn’t just a topic for a college course. It’s a practical tool for organizing data that would otherwise remain fragmented.
There are just a few key points to keep in mind, but they are crucial:
For an SME, this is where the real value lies: gaining a better understanding of customers, products, and operational behaviors without relying solely on intuition. If your team has technical expertise, you can start with Python and scikit-learn. If, on the other hand, you want to arrive at actionable insights more quickly, an automated approach reduces friction and saves time.
The point isn't to use an "advanced" algorithm. The point is to make clearer decisions, with more context and less noise.
If you want to turn scattered data into clear insights and actionable decisions, find out how ELECTE makes analytics accessible even without a team of data scientists. You can connect your data sources, gain actionable insights, and move from analysis to action faster.

.svg)
.svg)
.svg)