You’ve already taken the hardest step. You’ve decided to invest in AI. Maybe you’ve implemented a tool to automate reporting, improve forecasting, or personalize campaigns. Then comes the question that stumps many small business owners and managers: Is this creating real value, or am I just adding another cost?
It’s a common scenario. Many companies start out with enthusiasm, seeing more dashboards, more output, and more automation. But they can’t say for sure whether these changes are improving margins, revenue, decision-making times, or operational quality. The problem isn’t AI itself. The problem is unclear metrics, often based on gut feelings rather than a clear baseline.
We need a shift in approach here. It’s not enough to just look at how technology is being used. You have to link every initiative to the business. When you do that, the conversation shifts from “this seems useful” to “this investment has reduced costs, accelerated processes, and supported better decisions.”
This guide is designed specifically for that purpose. You’ll find a practical playbook for measuring AI ROI in small businesses in a thorough yet practical way. We’ll explore how to set goals, choose KPIs, estimate total costs, quantify both tangible and less obvious benefits, build a calculation model, and ensure that monitoring remains sustainable over time.
Retail entrepreneurs often see the same pattern. A new AI platform arrives, the team starts using it, reports come out faster, and campaigns seem more precise. After a few months, however, the sales director asks a simple question: “How much is it actually making us?”
If the response is vague, the initiative enters dangerous territory. No one openly rejects it, but no one defends it with conviction. That is why many projects remain permanent pilot programs.
The good news is that measuring AI ROI doesn’t require a team of data scientists or a complex financial system. It requires discipline. You need to start with a baseline, distinguish between outputs and outcomes, include all costs, and attribute the benefits to the entire process—not to individual tasks.
Without a common standard, AI is judged based on initial enthusiasm or momentary disappointment. Neither of these helps you make sound investment decisions.
When you set this up correctly, AI stops being a cost that’s hard to justify. It becomes a lever with clear, measurable effects on productivity, margins, revenue, and decision-making quality.
Many small businesses start with the product. They see a demo, discover an interesting feature, feel competitive pressure, and make a purchase. That’s the wrong approach. If you want to measure AI ROI for small businesses in a credible way, you need to start with the business problem.

An AI project only makes sense if it supports a clear strategic goal. For example:
The point isn't to introduce more AI. The point is to achieve a business outcome that's worth measuring.
According to an analysis published by ERP Today on measuring the value of AI, only 4% of organizations that remain in the pilot phase without any measurement report significant value, while 44% of those that implement structured post-implementation measurement achieve significant results. For an SME, the message is clear: it’s not enough to monitor adoption or usage. You need to link AI to results such as cost reduction or increased margins.
“We want to use AI” is not a goal. It is an intention. A useful goal contains four elements:
Rule of thumb: If your manager can’t explain in a single sentence why you’re investing, the goal is still too vague.
Before choosing KPIs or tools, ask the management team these questions:
Which process is costing us too much today?
If you don't know where the economic friction lies, your ROI will remain unclear.
Which decision is coming too late today?
Many AI initiatives are valuable because they anticipate a business, operational, or risk-related decision.
What process are we automating without changing the end result?
If you’re speeding up a task that doesn’t drive business results, you’re measuring process, not impact.
A good strategic goal also helps avoid another common mistake: measuring success using metrics that are easy to track but not very meaningful, such as the number of active users, reports generated, or login frequency. These metrics are useful for tracking adoption, but they aren’t enough to measure ROI.
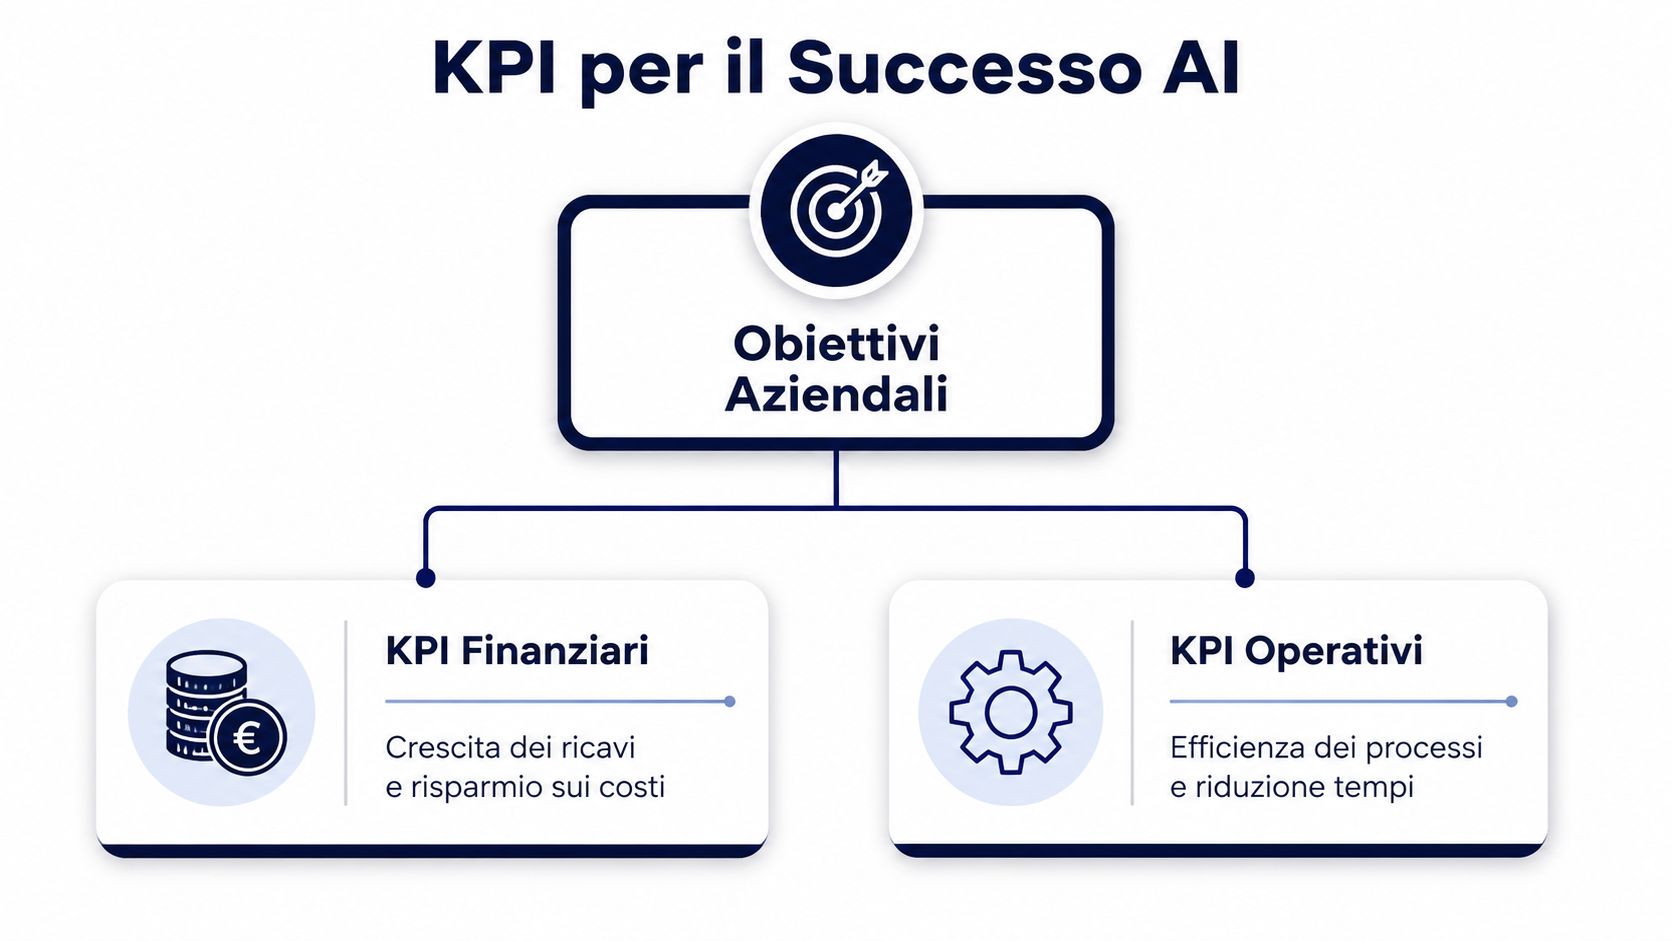
Once you’ve figured out why, you need to decide what to track. This is where many companies overcomplicate things. They create cluttered dashboards with dozens of metrics and little clarity. A simple approach works best: a few financial KPIs, a few operational KPIs, all tied to a strategic goal.
Among Italian SMEs that measure AI ROI, 45% track metrics such as CSAT/NPS, with an average improvement of 18–25%, a reduction in processing times of up to 30% in sales forecasting, and an average revenue growth of 15% through personalization, according to this analysis on measuring AI ROI in SMEs. This figure matters for a specific reason: it shows that the value goes beyond mere cost savings.
Financial KPIs are used to answer the most important question: Is AI improving the bottom line?
A useful selection for SMEs includes:
Operational cost savings
Ideal for automating data analysis, reporting, forecasting, inventory management, or repetitive tasks.
Incremental revenue attributable t
. Key areas include e-commerce, marketing, pricing, and product recommendations.
Gross margin by category
Essential when AI optimizes promotions, inventory, or product assortment.
Cost savings
This is particularly important in areas such as compliance, manual errors, stockouts, and waste.
Operational KPIs are leading indicators. They help you understand whether the process is actually changing.
Specific examples:
If a KPI doesn't support a decision, it probably doesn't belong on the dashboard. It belongs in the archive.
| Context | Useful financial KPI | Useful operational KPI |
|---|---|---|
| Retail | Incremental revenue from customization | Sales Forecast Update Time |
| E-commerce | Average order value and attributable conversions | Campaign activation time |
| Finance | Costs avoided due to compliance errors or incidents | Time required to review cases and anomalies |
| Operations | Reduction in process costs | Cycle time and error rate |
The right approach isn’t to choose the most sophisticated KPIs. It’s to choose the ones you can explain, track, and discuss every month with the people who set the budget and priorities.
The most overlooked aspect of ROI is almost always the cost. Many small and medium-sized businesses take the vendor’s fee and treat it as the total investment. As a result, the return looks better than it actually is—at least at first. Then come integrations, training, process reviews, and data governance, and the picture changes.
That’s why you need to calculate the TCO, or total cost of ownership. It’s not just an accounting exercise. It’s the most effective way to avoid a weak business case.
The TCO of AI in an SME tends to be divided into four categories.
First category: direct costs
Here you’ll find licenses, subscriptions, any cloud components, and additional modules. These are the most obvious costs. That’s precisely why they’re the most misleading—they seem like the total, but they’re really just the beginning.
Second phase: implementation costs
Initial setup, integration with CRM, ERP, and e-commerce systems, data cleansing, and migration of historical data. This work is particularly time-consuming when company data is fragmented.
Section 3: Internal adoption costs
Staff training, manager time, redefining workflows, validating new outputs. If the team doesn’t change the way it works, the project will remain underutilized.
Section 4: Hidden or Recurring Costs
Governance, maintenance, quality control, compliance, monitoring, and operational support. If you’d like to learn more about this topic, you’ll find a helpful checklist in this guide on the hidden costs of AI implementation.
Use this list before presenting the business case:
A meaningful ROI doesn’t come from low costs on paper. It comes from realistic costs compared to actual, measurable benefits.
If you underestimate the TCO, you’ll find yourself defending a result that management doesn’t recognize. It’s better to make a conservative forecast that covers all the bases than to make a bold but fragile promise.
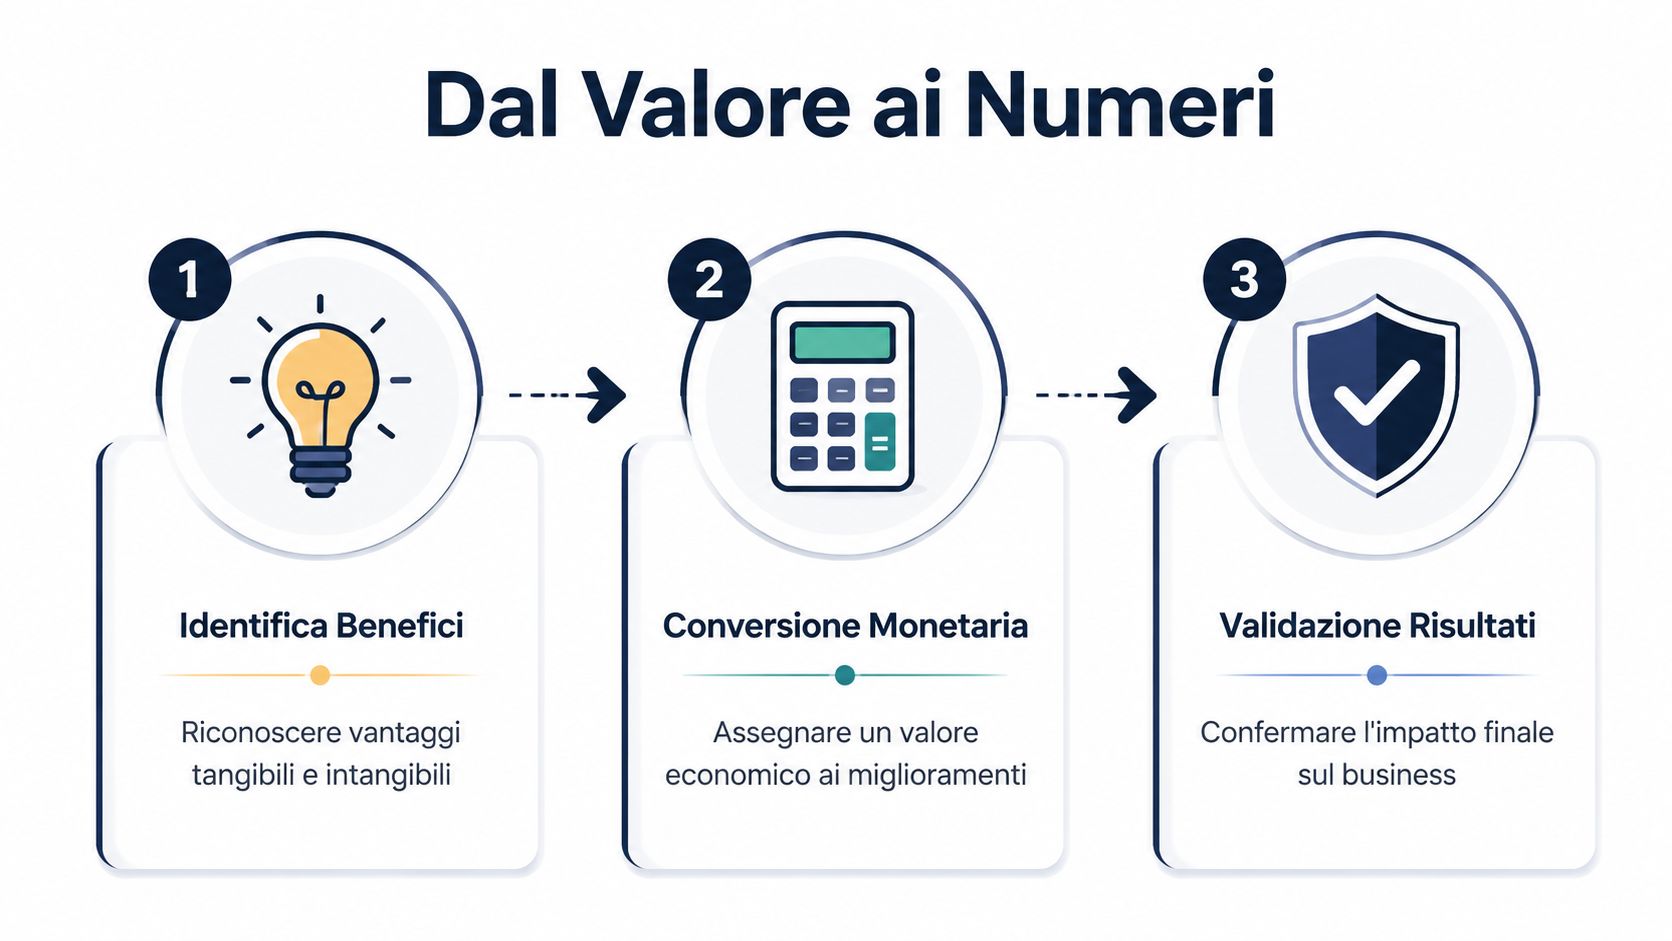
This is where it’s decided whether your analysis will be superficial or useful. Many companies focus only on the benefits that are easy to see: hours saved, a few costs cut, perhaps an improvement in campaigns. It’s a start, but it’s not enough. The true value of AI becomes apparent when you look at the entire workflow.
According to this analysis of AI measurement across entire value streams, the true ROI emerges when AI is applied to an entire value stream, not just a single task. Top-performing companies achieve a 13% ROI—more than double the average of 5.9%—precisely because they measure end-to-end impact. The same analysis finds that only 16% of companies successfully scale AI, largely due to inaccurate measurement at the task level.
Tangible benefits are the easiest to quantify in monetary terms. For an SME, they generally fall into three categories:
Time saved on repetitive tasks
If a team is generating reports, reconciling data, or updating analyses manually, you can quantify the value of the time saved based on labor costs.
Error Reduction Fewer errors mean fewer reworks, fewer hidden costs, and fewer delays in decision-making.
Incremental Revenue If AI improves recommendations, campaigns, pricing, or forecasts, you can expect additional sales or protected margins.
A proper approach to measurement goes beyond simply “creating reports faster.” It leads to further benefits: timelier decisions, fewer late discounts, better-allocated inventory, and less waste.
Intangible benefits are often overlooked because they seem difficult to quantify in monetary terms. In reality, you can approach them systematically.
| Benefit | How to observe it | How to handle it in the model |
|---|---|---|
| Risk reduction | Fewer errors, glitches, or incidents | Record it as an avoided cost, using a conservative approach |
| Faster decisions | Reducing the time between data and action | Link it to better operational or business improvements |
| Better customer experience | NPS, CSAT, fewer complaints | Track it as a leading indicator of value |
| Higher quality of work | Fewer repetitive tasks, more analytical focus | Don't exaggerate it. Document it and monitor the indirect impacts. |
Measuring only what is immediate leads to underestimating AI. Measuring only what is aspirational leads to overestimating it. A balance is needed.
A financial firm, for example, doesn’t just benefit from the time saved in analyzing cases. The real benefit may lie in reduced operational risk and more reliable controls. A retailer doesn’t just benefit from automated reports. It benefits when those reports lead to better orders, more streamlined promotions, and less tied-up inventory.
At this point, the task is no longer to determine whether AI “can be useful.” The task is to build a model that holds up in meetings, during budget reviews, and after six months of actual use.

In SMEs, I often see two opposing mistakes. The first is a template that’s too simple, which merely adds up a few hours saved and produces an ROI that’s hard to believe. The second is a model that’s too complex, full of assumptions that no one will ever update. The sweet spot lies somewhere in between: a practical template that management can understand and that can be updated every month or quarter.
The formula remains simple:
ROI (%) = [(Total Benefits - Total Costs) / Total Costs] × 100
If you want to avoid unnecessary arguments, use three other metrics in addition to ROI:
This approach is particularly helpful for small and medium-sized businesses, because the ROI alone can look impressive even when cash flow is slow or the benefits are still somewhat uncertain.
In the template, include at least these ten lines:
If the project includes less direct benefits, add a column with three confidence levels: confirmed, likely, and under observation. This is a practical approach. It prevents you from overstating the business case while still allowing you to highlight real benefits such as reduced operational risk or faster decision-making.
Consider a small or medium-sized retail business that uses AI for two very specific purposes: more targeted email campaigns and more accurate sales forecasts.
In the model, the structure could look like this:
Costs
Benefits
In this scenario, total costs amount to €24,000 and total benefits amount to €40,000.
The calculation is straightforward:
ROI (%) = [(40,000 - 24,000) / 24,000] × 100 = 66.7%
This example is useful for a specific reason. It doesn’t simply attribute everything to AI in a generic way. Instead, it links each benefit to an observable operational lever. This is how the model transitions from a theoretical exercise to a management tool.
If you're creating it in Excel or Google Sheets, use four distinct tabs:
Pre-AI baseline
Initial metrics, comparison period, data owner, data source.
Costs: One-time and recurring items, date incurred, cost center, notes.
Benefits: Savings, revenue, avoided costs, confidence level, attribution method.
ROI Dashboard: ROI, payback period, monthly or quarterly trends, variances, management comments.
Always add a final column with the question: “How do I prove it?” If a benefit item doesn’t have a clear answer, it doesn’t necessarily have to be eliminated, but it should be kept separate from the items that have already been validated.
For those who want to see how this type of model is applied in real-world projects, practical case studies on AI and analytics for SMEs help clarify which benefits actually materialize and which remain merely hypothetical.
At first, a spreadsheet is enough. Soon enough, however, its limitations become apparent. Data comes from different systems; some people update it manually, others change the definitions, and still others forget to include a cost item. The result is predictable: ROI becomes a sporadic exercise rather than a management system.
That is why measurement must be automated. Not for the sake of technical elegance, but for managerial continuity.

According to this guide on AI impact measurement frameworks, effective measurement requires a pre-implementation baseline and a time horizon of 12–18 months. The same source indicates that 72% of leaders admit to still using “vibe-based measurement” without a baseline, and notes that analytics platforms can support more effective frameworks, while also tracking metrics such as a 60% reduction in report creation time.
A manual model tends to break for three reasons:
The data is not synchronized
, CRM, ERP, e-commerce, finance, and marketing systems use different logic.
Definitions vary
“Cost savings” can mean one thing to operations. To finance, it means something else.
Monitoring is losing momentum
If updating the model takes too long, no one does it consistently.
ROI that isn't monitored regularly ceases to be a decision-making metric. It becomes a document for budget review.
In an analytics platform, it makes sense to automate the following:
In this context, ELECTE for SMEs can be used as a data analytics platform to connect corporate data sources, automate reports, and continuously monitor operational and financial KPIs. The practical benefit isn’t “having more dashboards.” It’s reducing the manual work required to demonstrate impact.
If you want to measure AI ROI for small businesses on an ongoing basis, automation isn’t just a minor detail. It’s essential for ensuring that the metrics remain reliable over time.
When an SME accurately measures the ROI of AI, it almost always follows a simple approach. Not a perfect one. Just a simple one.
Start with the business problem
Identify which decision, process, or cost you want to improve. If the project doesn’t solve a concrete problem, the ROI will remain unclear.
Establish a baseline before implementing AI
Collect initial data on timelines, costs, errors, revenue, or service quality. Without a baseline, the results will be open to interpretation.
Choose a few KPIs that really matter
Combine financial and operational metrics. The goal is to explain both the financial result and the mechanism that generates it.
Calculate the total TCO
Don’t stop at the license. Include implementation, integration, training, support, and compliance costs.
Measure the value of the entire workflow
Don’t just measure the automated task. Measure what happens downstream: better decisions, fewer errors, less waste, higher revenue, or reduced risk.
| Step | Common mistake | The right choice |
|---|---|---|
| Objectives | “We want to use AI” | “We want to improve a specific process” |
| KPI | Usage metrics only | Performance and process KPIs |
| Costs | Software license fee only | Total Cost of Ownership |
| Benefits | Hours saved | End-to-end value |
| Monitoring | Occasional review | Regular frequency |
If you’re only printing one part of this guide, print this checklist. It’s the difference between a project that looks promising and one that holds up in budget meetings.
Measuring the ROI of AI isn’t just for large companies. It’s a management practice that even an SME can systematically implement. When you set clear goals, choose useful KPIs, calculate total costs, and attribute benefits to the right process, the investment becomes much clearer.
At that point, you’re no longer asking whether AI “works.” You’re looking at where it improves margins, timelines, quality, and decision-making.
This is the most important step. AI shouldn’t just produce output. It needs to generate results that you can understand, defend, and scale. If you want to bring order to this process, build your own model, keep it up to date, and make it part of your regular reviews. That’s how data becomes decisions, not doubts.
The following questions are often asked by entrepreneurs and department heads who are beginning to formalize their ROI measurement processes.
| Question | Short Answer |
|---|---|
| When should I start measuring the ROI of AI? | Before implementation, by creating an initial baseline. |
| Should I only measure financial benefits? | No. You must also include operational benefits and relevant qualitative indicators. |
| Do the hours saved always translate into financial savings? | No. They should be viewed with caution and considered in relation to their actual impact on costs or production capacity. |
| Can I measure the ROI for a single task? | You can do that, but the most reliable result comes from the entire process. |
| How often should ROI be reviewed? | On a regular basis, in line with your decision-making and budgeting cycles. |
Confusing adoption with value. If you only look at how many users are on the platform or how many reports are generated, you’re looking at activity. Management, however, wants to understand the impact on costs, margins, revenue, risk, and work quality.
Less than you might think. A good model is clear, updatable, and understandable even to those who don’t work with data. If no one understands it, it won’t be used to inform decisions.
Separate them from the items that have already been monetized. Include a section in the model dedicated to qualitative benefits or conservatively estimated avoided costs. This way, you won’t underestimate the value, but you also won’t overestimate it.
Not necessarily. Some benefits appear quickly, while others require internal buy-in, cleaner data, and a full decision-making cycle. What matters is determining whether operational metrics are improving and whether the project is based on a process that truly matters.
Excel can be a good place to start. However, as data volumes grow, data sources multiply, and monitoring needs to become routine, an analytics platform helps reduce manual errors, delays, and inconsistencies.
If you want to turn ROI measurement from a one-off exercise into an ongoing process, visit ELECTE. You can explore how an AI-powered analytics platform helps SMEs connect data, automate reports, and clarify the impact of decisions.

.svg)
.svg)
.svg)