Many small and medium-sized businesses feel overwhelmed by the data they collect every day, but without a systematic approach, this data remains useless, unable to provide concrete answers. In a market that doesn’t forgive decisions based solely on instinct, understanding how to analyze a business process is no longer optional—it’s a necessity for survival and growth. This guide will show you a practical path to turning raw data into a competitive advantage, even without an entire team of data scientists.
You will learn how to:
The problem? Many SMEs don’t know where to start. They find themselves managing a massive amount of information scattered across CRMs, business management systems, and endless spreadsheets. AI-powered platforms like ELECTE, an AI-powered data analytics platform for SMEs, are finally making data analysis accessible. It’s no coincidence that projections indicate that by 2026,89% of Italian SMEs will be conducting data analysis. The most revealing statistic, however, is another: only one in three companies has dedicated professionals. This gap highlights a growing need for intuitive and automated tools. To learn more, you can consult the full research on the business analytics market.
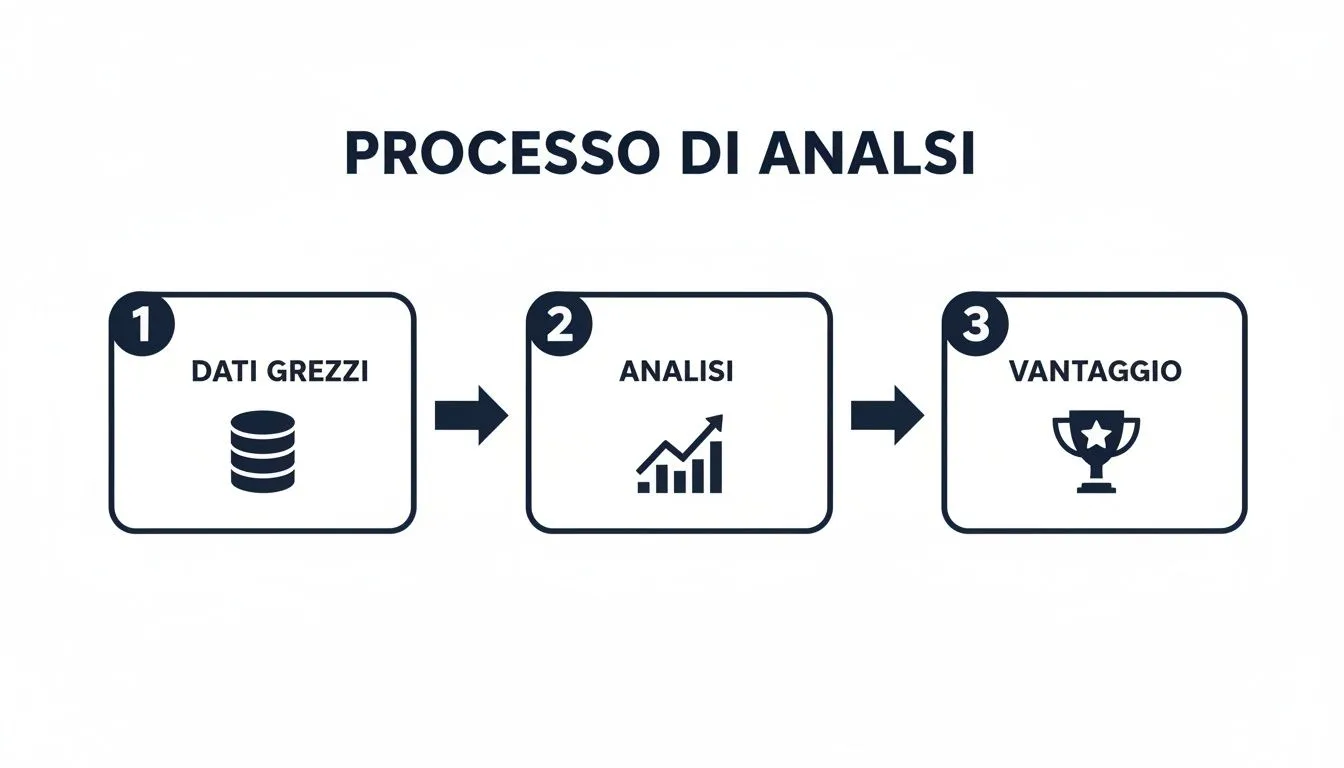
This diagram illustrates a fundamental truth: value does not lie in the data itself, but in transforming it into actionable insights. Understanding how to analyze a process means regaining control of your business. For a practical example, you can read our in-depth guide on business process management. In this guide, we’ll explore how to tackle each phase with a pragmatic, results-oriented approach.
Diving into a sea of data without a compass is the quickest way to get lost. I’ve seen brilliant teams spend weeks producing technically flawless but completely useless analyses. The reason? They didn’t ask the right question at the start of the journey. Even before looking at a single row of a spreadsheet, the starting point is always the same: what do you want to discover? A valuable analysis doesn’t come from the data you have, but from the business problem you need to solve.
This is where the real leap forward lies: transforming a business need into a specific question that data can answer concretely. It’s the shift from intuition to strategy. It means starting to define specific, measurable goals.
Let's see how this works in practice:
This step is crucial. It helps you determine what data you actually need (ignoring everything else), which metrics matter (the Key Performance Indicators, or KPIs), and which analytical approach makes the most sense to adopt.
Analysis without a goal is just noise. A goal without analysis is just a wish. True power comes from combining the two, turning intuition into a fact-based strategy.
Formulating the right question requires experience and can be difficult for those without a background in data analysis. This is exactly where AI-powered platforms like ELECTE come into play. Instead of leaving you staring at a blank page, these systems guide you through a strategic dialogue.
Imagine simply selecting your industry, such as retail. Drawing on thousands of successful analyses already performed, ELECTE ask you, “What do you want to analyze?” but instead suggests a series of business objectives and KPIs relevant to your specific situation. It might ask you, “Is your goal to increase customer lifetime value?” If you answer yes, it automatically suggests the most effective analyses, such as RFM segmentation or churn analysis. Data analysis becomes a guided conversation, transforming a vague idea into a concrete, measurable project from the very first minute.
Your most valuable data is scattered everywhere: CRM systems, business management software, spreadsheets, and social media. Each system provides a small piece of the story, but the full picture only emerges when these sources communicate with one another. Without a unified view, you risk making decisions based on incomplete and often contradictory information.

Data integration involves practical challenges such as different formats (e.g., DD/MM/YYYY vs MM-DD-YY), duplicate information, and incomplete fields that can invalidate the entire analysis.
For years, data consolidation has meant relying on manual processes, often based on Excel. This approach is not only slow, but it’s a recipe for disaster: every copy-and-paste operation introduces a risk of human error. Such a method is unsustainable for SMEs aiming to grow. It is no coincidence that89% of SMEs report analyzing data, yet only 33% have dedicated experts. This gap makes tools that automate integration indispensable. Projections for 2026 in Italy, which indicate steady growth for data centers, confirm this urgency. To learn more, you can read the full analysis of the data center market in Italy.
Manual data entry is like trying to build a modern car using only tools from a hardware store. Automation, on the other hand, gives you an assembly line.
An AI-powered platform like ELECTE is a game-changer. Instead of forcing you to export files, it connects directly to your data sources:
The result is a Single Source of Truth (SSOT): a centralized, clean, and always up-to-date repository, ready for analysis.
"Dirty" data inevitably leads to poor decisions. Up to80% of the time spent on an analytics project is devoted to "cleaning" the data. It's an invisible task, but it determines the success of every strategy.

This process, known as data cleaning, forms the foundation of the entire analysis. If your database contains "Milan," "milan," and "MI," a computer will treat them as three different locations, making the analysis unreliable.
Here are the most common problems you'll encounter:
If ignored, each of these issues leads to incorrect conclusions and harmful business decisions.
Data is like food: it doesn't matter how skilled the chef is. If the ingredients are poor quality, the final dish will always be a failure.
Until recently, data cleaning was a tedious task done in spreadsheets. Today, AI-powered data analytics platforms like ELECTE do it for you.
How does automatic data cleaning work?
As soon as you enter your data, the platform automatically analyzes it using advanced algorithms to:
This automated process doesn’t just save hours of work. It democratizes analysis. Thanks to AI, even those without technical expertise can prepare data professionally. If you’d like to learn more, read our guide on how to turn raw data into actionable insights in a step-by-step process.
Once your data is cleaned and consolidated, you can finally make sense of it. This process follows a two-step approach: first, you figure out what happened; then, you use that insight to predict what will happen next.

The first step isexploratory data analysis (EDA). The goal is not to find definitive answers, but to learn how to ask the right questions, seeking to understand the story the data tells at first glance.
Exploratory analysis is a dialogue. You ask a question, the data responds with a graph, and that response generates a new question. The questions are very concrete:
Today, a platform like ELECTE makes data exploration a visual and interactive process. With just a few clicks, you can create dynamic dashboards to "play" with the data and watch the charts update in real time.
Exploratory analysis doesn't give you the answer, but it shows you exactly where to look. It's the beacon that illuminates the biggest opportunities or the most pressing risks.
Once you understand the past, you can look to the future. This is where we enter the realm of predictive modeling, where artificial intelligence truly shows its potential. While exploratory analysis is descriptive, predictive analysis is forward-looking: it uses patterns in historical data to forecast future events.
It’s no longer science fiction. With ELECTE, predictive modeling becomes an accessible tool. The platform automates the most complex parts of the process to answer critical business questions.
Here are a few examples of what you can do:
Instead of building a model from scratch, the platform provides you with ready-to-use forecasts. If you’d like to learn more, our article on what predictive analytics is and how it transforms data offers a detailed overview. This step transforms data from simple reports into a strategic driver of growth.
An eye-catching chart or an accurate forecast isn’t the end goal—it’s just the starting point. The true value of an analysis lies in its ability to drive real change. If the results end up gathering dust in a drawer, you’ve simply wasted your time. The final step is to turn an insight into concrete, measurable action.
One of the most dangerous mistakes is confusing correlation with causation. Just because two phenomena occur at the same time doesn’t mean that one causes the other. You might notice that sales increase when blog traffic goes up, but perhaps both are influenced by a seasonal social media campaign. Making decisions based on false causations can lead to poor investments.
Let's see how you go from a result to a strategy. Imagine an e-commerce business analyzing its marketing campaigns.
That’s the insight. Now we need to take action.
We turned passive observation into an active experiment, with a clear hypothesis and a way to measure its success.
The ultimate goal of any analysis is not to produce a report, but to prompt a decision. An insight without follow-through is simply a missed opportunity.
Now you need to convince your team. Knowing how to communicate your findings is just as important as the analysis itself. Forget the technical jargon and tell a clear story that focuses on why this decision is crucial for the business. Platforms like ELECTE simplify this step. Thanks to its natural language insights, it doesn’t just show you the data—it explains it to you. Instead of giving you a simple chart, ELECTE tells you : “We’ve noticed that channel X is performing better. Shifting the budget could improve overall ROI.” This type of communication breaks down the barriers between analysts and decision-makers, accelerating the entire cycle.
Getting started with data analysis can be daunting, especially for small and medium-sized businesses. Here are some practical tips to help you overcome the initial hurdles.
Many people think that data analysis is a long and expensive process, but with modern tools like ELECTE, which automate the critical steps, you can gain valuable initial insights in just a few days—if not hours. Today, speed depends on the clarity of your business objective. If you have a specific question, the platform can provide an almost immediate answer.
No, not anymore. Until a few years ago, you needed technical and statistical skills. Today, AI-powered platforms like ELECTE designed for managers and entrepreneurs, with intuitive interfaces, one-click analysis, and no coding required. If you know how to use a spreadsheet, you already have all the skills you need to get started. The focus shifts from “how to do it” to “what I want to discover.”
Data analysis is no longer the preserve of a select few specialists. Thanks to automation and AI, it has become a strategic skill within reach of anyone who wants to make better decisions.
Absolutely not. In fact, the analysis may have an even greater impact on SMEs for two reasons:
There are scalable tools designed specifically to meet the needs of small and medium-sized businesses. The question isn’t whether your company can afford to analyze data, but whether it can afford not to.
Are you ready to turn your company’s data into strategic decisions? With ELECTE, you can start uncovering valuable insights for your business in minutes, not months.

.svg)
.svg)
.svg)