Converting from CSV to Excel is much more than just a simple file conversion. It’s the first, crucial step in transforming a static list of raw data into a solid foundation for your decision-making process. In practice, you’re bringing a simple text file (the CSV) into a dynamic environment like a spreadsheet (Excel), where you can finally analyze, visualize, and manipulate the information to uncover real insights for your business.
This guide will equip you with the skills to manage every aspect of the conversion process, ensuring that your data remains secure and ready for in-depth analysis.
Mastering the conversion from CSV to Excel is one of those skills that really makes a difference for anyone who works with data. Sure, CSV (Comma-Separated Values) files are lightweight and universally compatible, but they’re essentially just plain text. They don’t offer you any tools to analyze, format, or visualize the data in a meaningful way.
Excel, on the other hand, turns that static data into an interactive playground.
Imagine an e-commerce manager exporting the day's sales data. In CSV format, it's nothing more than an endless list of transactions. But once that same data is imported correctly into Excel, you can use it to:
This process is not just a technical detail; it is the bridge that connects raw data to business intelligence. It is the starting point for getting the most out of even the most sophisticated analytics platforms, such as ELECTE, an AI-powered data analytics platform for SMEs. In fact, our platform fully automates data acquisition and cleaning—including CSV files—to generate predictive insights without any manual effort.
In short, learning how to convert CSV files to Excel means unlocking the hidden potential in your data. It’s the foundation for deeper analysis and for making decisions that drive growth.
If you’d like to learn more about how raw data can become a true strategic asset, you can also read our article on how to turn raw data into useful insights.
There is no one-size-fits-all solution for converting CSV files to Excel. The method you choose can make the difference between a clean analysis and one riddled with hidden errors. The decision depends on what you need to do: a quick check, a detailed report that leaves no room for error, or an automated workflow to handle large volumes of data.
Understanding the differences between the various options will save you time and spare you common frustrations, such as the loss of critical data. Let’s take a look at the three main approaches, from the simplest to the most structured, to see which one is right for you.
This is the most instinctive approach: double-click the CSV file and let Excel work its magic. It’s an incredibly quick method, perfect when you just need to take a quick look at the contents or check the data structure on the fly.
But speed comes at a price. Excel applies its default settings without asking you, and this often leads to misinterpretations of the data. This is precisely where the most common problems arise:
This approach is only suitable for a preliminary inspection. For any serious analysis, it’s best to rely on methods that give you greater control.
When precision is everything, the "From Text/CSV" option (found on the Data tab in Excel) is your best ally. This tool guides you step by step, giving you full control over how your data is interpreted and imported.
The import wizard allows you to set three key parameters for flawless results:
This method strikes the perfect balance between speed and control. It’s the ideal choice for most everyday tasks, because it ensures that your data is imported correctly the first time around.
If you’re dealing with huge CSV files, need to clean and transform data before uploading it, or run the same import every week, then Power Query is the tool that will change your life. It’s a powerful data transformation engine, built right into Excel, that goes far beyond simple data import.
With Power Query, you can build a fully reusable workflow that:
This approach is a must for anyone involved in regular reporting or complex analysis. It serves as a natural bridge to advanced data analytics platforms like ELECTE, which automate these workflows to generate insights directly from your raw data. By the way, if you ever need to extract data from other difficult-to-handle formats, our guide on how to convert a PDF file to Excel could come in very handy.
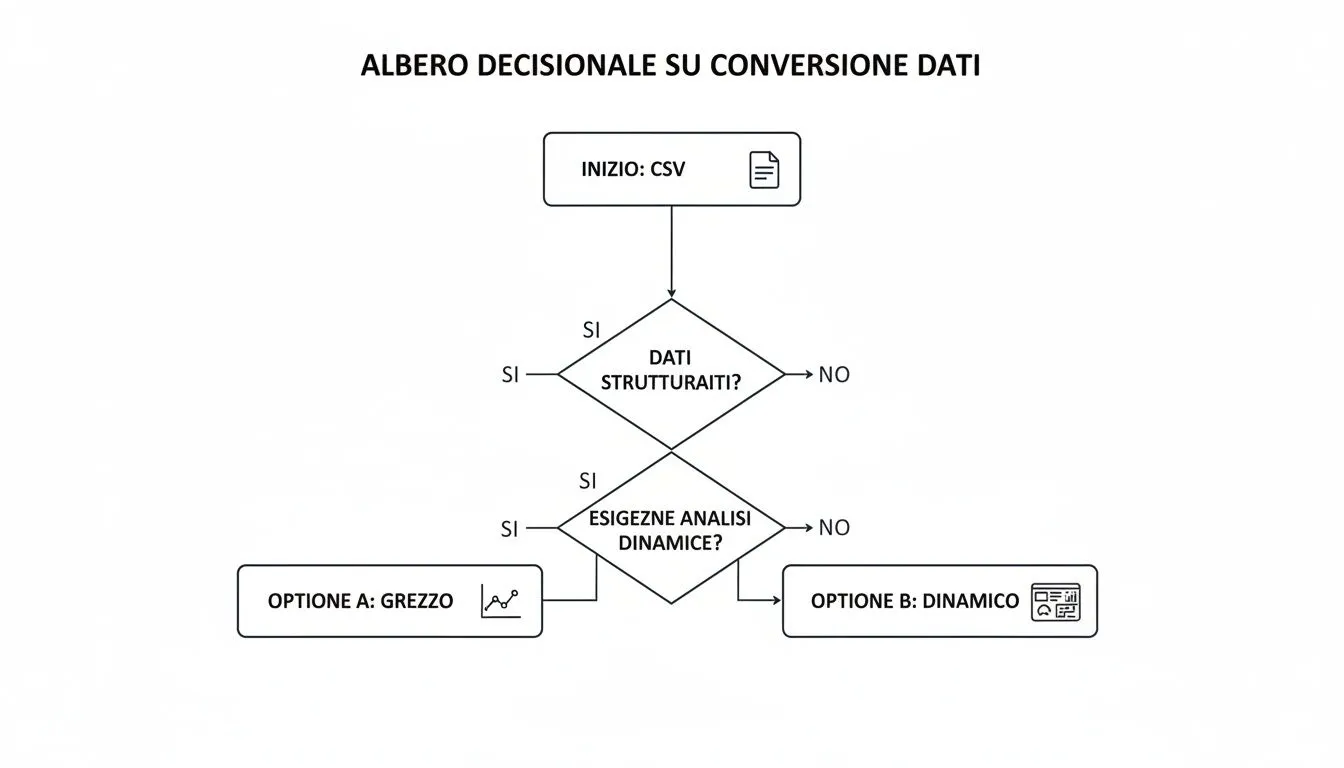
To help you understand the process, here is a brief decision tree that summarizes when to use one method or another.
Comparison of Import Methods
Direct opening is the most straightforward method, but it offers minimal control over the data. It is ideal for quick inspections and simple, unformatted data with very low complexity.
The import wizard is fast and offers a high degree of control over formatting. It is the right choice for most everyday tasks, especially when data requires precise structuring. The complexity remains low.
Power Query is fast once the initial setup is complete and offers maximum control over your data. It is the ideal tool for large datasets, recurring reports, and complex data cleaning and transformation tasks. The complexity level is moderate.
As you can see, each tool has its own purpose. Direct opening is perfect for a quick peek, the guided import is the Swiss Army knife for almost any situation, while Power Query is the heavy artillery for the most complex and repetitive tasks.
Even the most well-established process for converting CSV files to Excel can have its pitfalls. How many times has this happened to you? You open the file, and the imported data looks nothing like what you expected, turning a routine task into a hunt for errors.
The good news is that almost all of these issues have a quick and straightforward solution. In fact, most of these problems stem from how Excel automatically interprets data. Let’s take a look at the most common challenges and practical solutions to ensure your data always remains accurate.

The most common mistake is the column structure. When you open the file, you’ll find all the data crammed into a single column. This happens because the CSV file doesn’t use a comma as a separator, but another character such as a semicolon (;), a very common setting in Italian systems.
The most effective solution is to usethe Import Wizard (found under Data > From Text/CSV). On the first screen, simply select the correct delimiter. When you select "Semicolon," the data preview will update instantly, finally displaying the columns clearly separated.
Another common problem is the appearance of strange symbols (such as "Ã") instead of accented letters. This is clearly a character encoding error. Most likely, your CSV file is in UTF-8 format, but Excel didn’t recognize it. Here, too, the Import Wizard is your friend: in the “File Source” field, scroll through the list and select 65001: Unicode (UTF-8). You’ll see that the characters will become perfectly legible again.
Choosing the right delimiter and encoding during import resolves about 90% of display issues. Taking an extra ten seconds to set these two parameters can save you hours of manual corrections.
Excel sometimes tries to "help" too much by interpreting data in its own way. Two classic victims of this overzealous behavior are numbers with leading zeros and dates.
To avoid this behavior, you need to tell Excel to treat those values as plain text. During the Import Wizard, proceed to the final step, where you can define the format for each column. At this point, select the "problematic" column from the preview and, from the "Column Data Format" drop-down menu, choose the Text option.
This step is essential when working with personal data. Consider sources like Garda Informatica, which provides databases of Italian municipalities—essential for validating tax ID numbers and performing demographic analyses on platforms such as ELECTE. These files contain data on 7,903 municipalities, including critical information such as ZIP codes and Belfiore codes, highlighting just how crucial it is to preserve formats when converting from CSV to Excel. You can learn more about these databases for geographic analysis.
By following these simple steps, you can ensure that every conversion from CSV to Excel is clean, accurate, and ready for analysis.
What if your CSV file has not thousands, but millions of rows? That’s when we enter a realm where the classic double-click simply doesn’t work anymore. Excel has a physical limit of just over one million rows per sheet, and attempting to exceed that limit turns a routine operation into a complete system crash. It’s the classic challenge that arises when working with large-scale data.

The game-changer is Power Query. Instead of trying to "dump" millions of rows directly into the cells of your spreadsheet, Power Query lets you connect to the CSV file and load the data directly into Excel's Data Model, also known as Power Pivot.
This approach completely bypasses the limitations of the spreadsheet. The data isn't displayed in cells, but is handled by a much more powerful in-memory analytics engine.
Think of the Data Model as a database hidden inside your Excel file. You can’t see the rows in the spreadsheet, but you can use them to populate pivot tables and charts with surprising speed.
The benefits of this method are enormous:
The true power of Power Query, however, really shines when you’re working with recurring reports. Instead of repeating the exact same data cleaning steps every time—removing unnecessary columns, filtering rows, correcting errors—you can record these steps just once.
The next time you receive the updated CSV file, simply click "Update" to automatically run the entire process again. This isn't just a time-saver; it's true automation that ensures consistency and eliminates the risk of human error.
This is precisely the logic behind AI-powered platforms such as ELECTE, which are designed specifically to handle the native ingestion of massive volumes of data and free analysts from these manual, repetitive tasks.
The ability to efficiently convert CSV files to Excel is crucial when working with large-scale public data, such as that from the PNRR. Comprehensive datasets, available on GitHub and updated daily, enable SMEs to track the use of €45 billion in funds. Integrating these large CSV files via platforms like ours can reduce repetitive tasks by 60%, transforming raw data into strategic analyses to track project progress, which stands at 62% nationwide . If you’re interested, you can find more details on how to leverage PNRR data.
Using Power Query transforms Excel from a simple spreadsheet into a full-fledged business intelligence tool.
Successfully converting a CSV file to Excel is a crucial step, but it’s just the starting point. The real value lies not in the conversion itself, but in what you do with your data afterward.
Think of the import process as preparing ingredients: the real magic happens when you start cooking—that is, when you analyze the data to uncover insights that drive your business’s growth.
But what if you could skip the manual preparation entirely and move straight to strategic analysis?
Manual conversion is just a small part of a much larger workflow. For SMEs that truly want to take their business to the next level, the goal is to automate the entire process, from loading raw data to generating predictive reports. This is where platforms like ELECTE come into play.
Imagine this scenario for your retail business: instead of opening Excel and struggling with delimiters, you upload your sales CSV directly to ELECTE. In just a few moments, you get a visual dashboard showing purchasing trends, an analysis of future demand to optimize inventory, and recommendations on which products to promote.
This approach does more than just save you hours of valuable work. It democratizes access to advanced insights, enabling anyone on the team—even those without a background in data science—to make data-driven decisions.
This also applies when working with public data. In Italy, Istat is a primary source of data in CSV format. For businesses, uploading an Istat dataset on Italian municipalities directly to a platform like ELECTE reduce processing times by up to 70%, enabling them to forecast demographic risks or optimize inventory.
Since December 15, 2020, the Istat database has facilitated over 500,000 downloads, with 40% of users choosing the CSV format for subsequent conversion to Excel. For more information, you can find the official data on the results of Istat censuses.
While Excel is excellent for tactical analysis, a data analytics platform like ELECTE strategic insights. Data no longer exists in isolation within a single file, but becomes part of a connected ecosystem that powers predictive models and automated reports.
Stopping to focus on "how" to convert files allows you to concentrate on the "why" behind the numbers, transforming analysis from a reactive task into a proactive driver of growth. If visualizing data is your next step, you might find our guide on how to create an effective chart in Excel helpful.
Knowing how to convert data correctly is the foundation of any reliable business analysis. Here are the key points to keep in mind:
We’ve seen that converting CSV files to Excel isn’t just a technical task, but the first step toward informed and strategic data analysis. Mastering the right tools—from the Import Wizard to Power Query—allows you to overcome the most common obstacles and ensure data integrity right from the start. This ensures that your analyses are built on a solid and reliable foundation.
However, the real competitive advantage for modern SMEs lies in going beyond manual work. Automating the entire workflow—from data loading to the generation of predictive reports—is what transforms data from a mere operational task into a driver of strategic growth. With a platform like ELECTE, you can finally focus on the insights that matter, letting technology handle the preparation.
Ready to turn your data into better decisions?

.svg)
.svg)
.svg)


.webp)