On Monday morning, the COO of a small retail business opens the weekly dashboard. He sees charts, tables, and alerts. After ten minutes, he knows something is wrong, but he still doesn’t know what to do.
This is where everything changes. By 2026, the challenge will no longer be having data, but rather being able to turn it into a shared, clear, and timely decision.
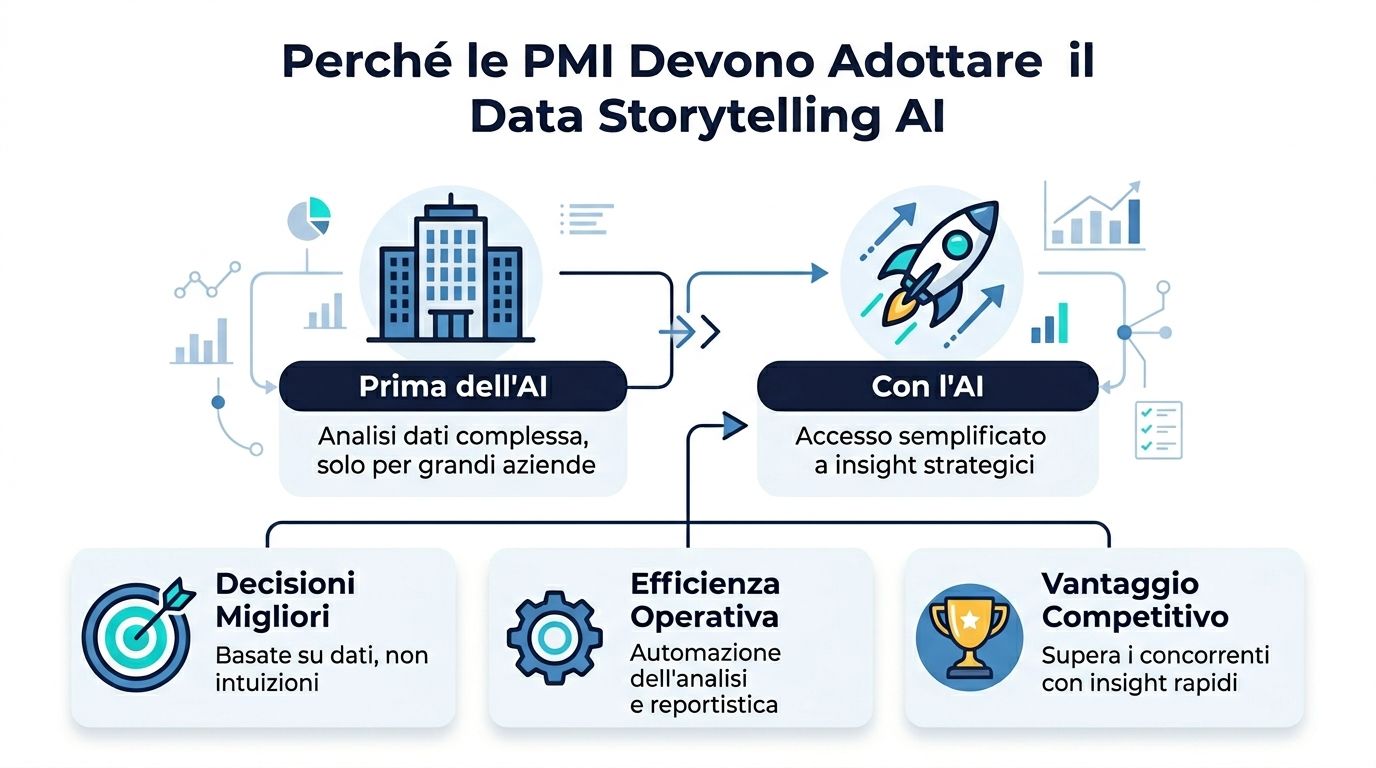
For years, business intelligence has promised greater visibility. In many small and medium-sized businesses, it has only partially delivered on that promise. The data is there, as are the dashboards, but the crucial step is often missing: translating the numbers into actionable insights.
AI Data Storytelling 2026 was born right here. It doesn’t just show a trend or flag an anomaly. It organizes insights into a clear sequence, identifies possible causes, suggests priorities, and makes the data understandable even to those who don’t write queries or build models.
The scale of this change is vast. According to projections on data-driven storytelling, by 2026, 75% of data stories will be generated automatically using artificial intelligence, and information retention can rise from 5–10% when presented as mere statistics to 67% when the data is woven into a coherent narrative.
For SMEs, this doesn’t mean delegating everything to machines. It means reducing repetitive work, speeding up decision-making, and freeing up time for the real managerial task: providing context, choosing the right response, and aligning the team.
Numbers provide insights. Stories offer direction. Decisions are made only when the two work together.
In 2026, AI-powered data storytelling is not simply about a more sophisticated dashboard. It refers to a system that transforms raw data into actionable insights, with clear priorities, causal relationships, and operational implications. For an SME, the difference is tangible: value no longer lies solely in access to the numbers, but in the ability to reach a shared decision more quickly.
The most important change isn’t technical. It’s organizational. AI handles the “what”: it detects anomalies, links variables, organizes scattered signals, and offers an initial interpretation. People oversee the “why”: they verify whether that pattern makes sense in the business context, whether it reflects a change in customer behavior, a stock issue, a poorly calibrated promotion, or an external event that the model cannot interpret on its own.
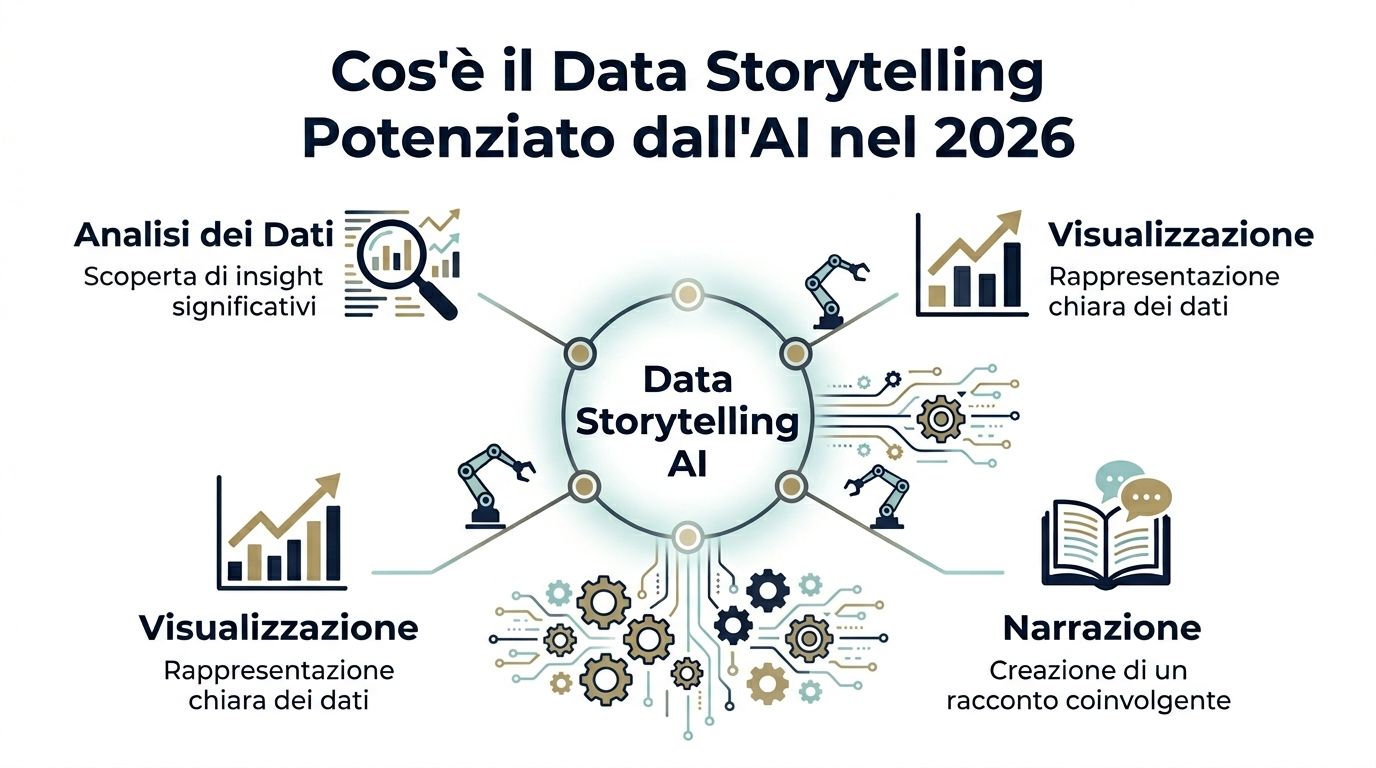
This form of storytelling stems from the integration of three components that were previously handled through separate tools and at different stages:
Data Analysis AI identifies patterns, anomalies, trend shifts, and potential correlations that would require multiple manual steps in a static report.
Visualization Charts, maps, and comparisons help reduce cognitive load. They make the hierarchy of issues immediately clear and help management distinguish between statistical noise and operational priorities.
Narrative The system organizes insights into a logical sequence. It does more than just display metrics. It explains what events occurred, what factors appear to have played a role, and what questions remain unanswered.
The key lies in the orchestration. An SME does not benefit from three separate outputs—a dataset, a chart, and a text-based commentary. It benefits when these elements come together to form a coherent narrative that reduces ambiguity across departments.
A traditional dashboard describes the state of the business. An AI-powered data storytelling system interprets that state, formulates hypotheses, and suggests where to focus attention. This shifts part of the cognitive work to the early stages. The team no longer starts with a page full of KPIs. Instead, it starts with a reasoned framework that accelerates the discussion.
The narrative format matters for another reason that is often overlooked: it aligns different functions around the same set of data. In many SMEs, marketing, finance, and operations look at the same numbers but interpret them in incompatible ways, because each department operates within a different context. A story generated by AI does not eliminate the need for discussion. It makes the discussion more productive, because it makes the connections between evidence, hypotheses, and decisions explicit.
Practical rule: If a report forces every department to come up with its own interpretation from scratch, the problem isn't the data. It's the format.
For this reason, AI-driven data storytelling should be viewed as a hybrid model, not as complete automation. AI synthesizes, correlates, and makes recommendations. Humans confirm, correct, and assign meaning. In SMEs, this division of labor matters more than in large companies, because time, analytical skills, and coordination capabilities are limited resources.
The result is more accessible than traditional BI. Not because the complexity disappears, but because it is condensed into an output that a sales manager, a CFO, or an operations manager can discuss on the same interpretive basis. This makes business intelligence usable even where there is no dedicated team of analysts.
This revolution does not stem from a single technology. It stems from the convergence of language models, semantic data architectures, and predictive systems integrated into decision-making processes.

The most noticeable change is in the interface. Autonomous analytics systems based on large language models (LLMs) are replacing manual workflows built on SQL queries, rigid dashboards, and intermediate technical steps. According to Techment’s analysis of AI trends for analytics in 2026, these systems dynamically generate queries, explain results, and refine answers based on follow-up questions, enabling users to obtain insights, charts, and forecasts in natural language without writing code.
For an SME, the impact is enormous. The sales manager no longer has to wait for an analyst to extract the data, clean it up, create a chart, and then present it. They can simply ask, “Which products have seen a slowdown in recent weeks, and in which regions?” The system provides a ready-made answer, complete with visuals, analysis, and the option to drill down further.
This shift is changing the focus of BI. The required skill is no longer mastering a specialized interface; it is knowing how to ask better business questions.
To gain a broader perspective on this transition, it is worth examining the key trends in artificial intelligence for business, as AI data storytelling in 2026 is one of the most tangible manifestations of this evolution.
The second change is less visible but more fundamental. Business intelligence is no longer a linear pipeline with separate extraction, transformation, and visualization stages. The most advanced systems also incorporate the semantic data model and governance rules into the conversational layer.
This matters for two reasons.
First, the machine doesn’t just “read” data. It interprets it within a defined context, with hierarchies, definitions, and constraints already built in.
Second, the time between data collection and decision-making is getting shorter. Operational latency is decreasing because many intermediate steps are being eliminated.
Three consequences are particularly relevant for SMEs:
Reduced technical friction
Even non-technical users can explore useful insights without having to constantly rely on a dedicated data team.
Greater decision-making continuity
Follow-up questions do not create a new analysis project. They remain within the same conversation.
Forecasting within the narrative
Forecasting no longer exists in a separate module. It becomes part of the same narrative logic that explains the present.
When analytics becomes conversational, the value isn’t just in speed. It lies in the quality of the questions the company finally begins to ask itself.
This is why AI-powered data storytelling in 2026 should not be viewed as a mere upgrade to reporting. It is a new interface between people, data, and decisions.
For years, large companies have been able to afford data scientists, BI engineers, and specialized reporting teams. SMEs have not. That is why the advent of AI-powered data storytelling is not just a technological advancement. It is a redistribution of analytical power.
For an SME, competitive advantage does not come from having more data than competitors. It comes from being able to turn that data into coordinated action across departments before others do.
Many people view this phenomenon superficially: less manual work, more automated reports. That’s true, but it’s not the main point.
According to DataCamp’s analysis of the gap between AI literacy and organizational capability in 2026, 60% of organizations still report a significant gap between the availability of AI-generated insights and their ability to translate them into coordinated actions, citing the difficulty of communicating insights clearly across teams as the main obstacle.
This fact completely changes the strategic perspective. The bottleneck is no longer generating analytics. It is ensuring that marketing, finance, operations, and management all understand the same thing at the same time.
A good AI-powered data storytelling system reduces this friction. It doesn’t just hand the team a spreadsheet. It provides a shared understanding of the situation.
For an SME, the benefits are evident in very concrete areas:
Faster alignment
A well-crafted narrative prevents meetings where each department defends its own interpretation of the numbers.
Faster decision-making
If the insight has already been explained, the team can move more quickly to discussing operational options.
Distributed access t
insights Data is no longer the exclusive domain of those who know how to use complex tools.
Better prioritization
When the narrative highlights causes, impacts, and urgency, management is better able to distinguish between noise and signal.
An SME doesn’t succeed simply by automating a report. It succeeds by reducing the time wasted between “we’ve identified the problem” and “we’ve decided what to do.”
The less obvious implication is this: AI-driven data storytelling isn’t just about gaining deeper insights. It’s about improving coordination. And in small and medium-sized enterprises (SMEs), where structures are lean and every misstep in timing carries greater weight, this capability is often more valuable than pure analytical sophistication.
The most common mistake in SMEs does not stem from a lack of data. It stems from a flawed approach. People ask AI to provide definitive answers, when its most valuable role is actually to make sense of complexity, identify patterns, and lay a solid foundation upon which management can exercise judgment.
In 2026, the method that works follows a precise logic. The machine handles the “what.” People define the “why,” the strategic importance, and the relational implications of decisions. This is where the human-machine partnership ceases to be a mere slogan and becomes an operational process.
1. Connection and Data Preparation
The work begins long before the dashboard. CRM, ERP, e-commerce platforms, marketing tools, and financial systems must all come together in a cohesive structure, with consistent definitions and comparable data.
AI plays a critical technical role: it cleans and standardizes data, flags inconsistencies, and reduces noise that often skews subsequent analyses. Those who want to build a solid foundation can learn more about how to structure a business data analysis system.
2. Discovery of insights
At this point, the system can identify what traditional BI workflows miss: anomalies, unexpected correlations, deviations from historical trends, and weak signals between variables from different departments.
The advantage isn’t just computational speed. It’s the ability to explore many hypotheses in parallel, without narrowing the question down too much from the start. For an SME, this improves the quality of decision-making, because it broadens the range of possible causes before the team settles on the most convenient explanation.
3. First draft
After analyzing the data, the AI can transform the results into an initial actionable narrative. It doesn’t just describe a graph. It organizes the facts, suggests plausible connections, highlights the variables that need to be monitored, and indicates where managerial attention is needed.
This draft serves a specific purpose: it reduces the time between identifying a pattern and translating it into language that decision-makers can understand.
| Feature | Traditional BI (Manual) | AI Data Storytelling (Automated & Hybrid) |
|---|---|---|
| Access to data | It often depends on specialists | More accessible even to non-technical users |
| Query Formulation | Manual, technical | Conversational, in natural language |
| Initial output | Static tables and dashboards | Insights, visuals, and narrative outline |
| Time for a closer look | Spread across several sections | I'll continue, with follow-up in the same thread |
| The Human Role | Leading in data extraction and reporting | Central to interpretation and direction |
| Typical outcome | Partial understanding | A deeper understanding of the action |
4. Human Refinement
This is where the organization’s maturity is put to the test. People bring to the table what no model can reliably infer on its own: business history, internal political constraints, customer sensitivities, reputational impact, and unwritten priorities.
In its in-depth analysis of data storytelling for business analysts, the IIBA notes that AI accelerates the production of analysis, while interpretation, context, and direction remain human tasks. This is a point that is often overlooked. The better AI becomes at summarizing the “what,” the greater the value of the “why” provided by people.
5. Deployment and Activation
The final step involves execution. The story must reach the right team, in the right format, and with a clear call to action. An insight that is shared but not owned remains merely interesting content. An insight that is assigned, contextualized, and prioritized becomes a decision-making tool.
The most effective model for AI data storytelling in 2026 follows this logic: AI performs the initial analysis, while humans make the final judgment.
The less obvious effect is organizational. People’s time shifts from producing reports to defining meaning, trade-offs, and consequences. For an SME, this is a decisive step, because it frees up managerial expertise where it really matters—not in gathering numbers, but in choosing a direction.
The difference between an interesting technology and a useful one becomes clear when it is applied to high-pressure situations. Finance and retail are two ideal contexts because they combine large volumes of data, frequent decision-making, and immediate consequences.

In a financial SME, the challenge isn’t just detecting an anomaly. It’s determining whether that anomaly requires immediate attention, internal escalation, or simply monitoring.
An AI-powered data storytelling system can gather insights from transactions, customer profiles, operational exceptions, and compliance metrics. But the value doesn’t lie in individual alerts. It lies in the ability to weave disparate alerts into a cohesive narrative: what patterns are emerging, why they are concentrated in a certain area, and what implications they might have for the company’s risk profile.
This also makes communication between compliance, management, and operations more effective. The team no longer begins its discussions with lists of incidents. Instead, it starts with a structured explanation that ranks the severity of each incident and suggests priorities.
In finance, internal confidence grows when analysis is not presented as an isolated warning, but as a verifiable account of risk.
In retail, AI-driven data storytelling works differently. Here, the central focus is on the relationship between customer behavior, promotions, product assortment, and profit margins.
A narrative engine can aggregate campaign results, inventory fluctuations, category performance, and recurring purchase signals. Instead of simply showing which promotions “worked,” it can distinguish between genuine incremental sales, cannibalization, geographic concentration of the response, and differences between new and existing customers.
This is why personalization is attracting such significant investment. According to Exploding Topics’ projections on AI and recommendation engines, the market for retail recommendation engines is expected to reach $26.21 billion by 2030, with a CAGR of 33.6%. It’s not just a bet on technology. It’s a bet on the value of more context-aware business decisions.
For a retail SME, the most obvious applications are clear:
Smarter Promotions
Not all campaigns that boost sales also improve the business.
Better-balanced inventory
The narrative can link demand, seasonality, and local variations in a way that is easier to understand for purchasing and logistics.
More useful segmentation
Customers are not described solely by static clusters, but by their observed behavior within a specific scenario.
The key point, in both sectors, is always the same. The system does not replace the manager’s judgment. It simply helps the manager make better decisions.
If AI data storytelling in 2026 is evaluated solely on the basis of the quality of its visuals, the company is focusing on the surface and missing the substance. Success lies in the transition from insights to organizational behavior.

SMEs should focus primarily on four areas.
Time from insight to action
The time that elapses between the emergence of a signal and a concrete operational decision.
Adoption of the recommendations
How many of the issues raised are actually used to modify campaigns, processes, priorities, or resource allocations?
Forecasting Quality If the narrative includes future scenarios, the discrepancy between the forecast and the observed result must be verified.
Engagement with reports
If teams aren’t reading or discussing the reports, the problem isn’t just one of distribution. It could be a matter of storytelling.
To structure these indicators rigorously, it is best to start with a clear set of business KPIs focused on growth.
A data story that is well-received in a meeting but does not lead to any action is not yet creating value. Similarly, a forecast that is technically accurate but irrelevant to business decisions remains a technical exercise.
The right questions are tougher:
The best indicator isn’t how sophisticated the report looks. It’s how quickly it moves an organization from discussion to decision.
This approach is also useful for avoiding the most common mistake: confusing automation with maturity. A mature company isn’t one that generates the most insights. It’s one that knows which insights warrant an immediate response and which do not.
In 2026, the value of AI-driven data storytelling is measured by the quality of collaboration between the system and the decision-maker. AI identifies patterns, anomalies, and operational priorities at a speed that was out of reach for many SMEs just a few years ago. People remain responsible for what no model can deduce on its own: market context, internal political implications, and the tone in which an insight is presented to the team or the client.
That is why the human-machine hybrid model is the central theme of 2026. The machine handles the "what." Management, sales teams, and those who know the customer define the "why" and decide the "so what do we do." For an SME, the difference is not just technological. It is organizational. It means bridging the gap between analysis and action.
This is where the real advantage lies. Business intelligence becomes accessible not when data is simpler, but when its interpretation becomes clearer, more shareable, and more useful for day-to-day decision-making.
For an entrepreneur or department head, the point isn’t to imitate large companies. It’s to equip yourself with tools that make data easier to understand, prioritize key indicators, and speed up decision-making.
If you want to turn scattered data into clear insights and faster decisions, discover ELECTE, the AI-powered data analytics platform for SMEs. See how you can connect your data sources, automate analysis, and generate business-ready narrative reports. Ready to transform your data? Start with a free trial.

.svg)
.svg)
.svg)