What is an SME really buying when it looks for an online Gantt chart? A more readable timeline, or a system that impacts timelines, workloads, priorities, and the quality of decisions?
For many small and medium-sized businesses, the choice is still driven by the interface. Drag-and-drop functionality, color-coding, calendar views, and mobile apps. These are useful features, but they aren’t enough to determine whether a tool will help management handle dependencies, bottlenecks, and team capacity—or whether it will simply present the project in a more organized way.
The market is moving quickly. A previous Technavio analysis of online project management software pointed to sustained growth in the sector between 2023 and 2028 and predicted that, by 2025, adoption of these tools would also increase among small and medium-sized Italian IT companies, reflecting a much wider adoption rate than just a few years ago. The point, however, is not just the growth of the category. It is why SMEs are investing.
In some cases, they seek operational control. In others, they want to standardize processes across technical, sales, and administrative departments. Still others need to address a more practical issue: linking planning to executive reporting, so they can identify delays, resource bottlenecks, or budget variances in advance.
This is where the evaluation criteria change.
For an Italian SME, “best” doesn’t mean the same product for everyone. Context matters. A company heavily reliant on Microsoft 365 tends to evaluate integration and governance differently than one already operating within the Zoho ecosystem. A software development team has different needs than an engineering firm, a professional services firm, or an organization that manages projects for multiple clients simultaneously.
That is why this article does not treat Gantt software as a simple list of features. Instead, it organizes them according to real-world use cases for SMEs, comparing where each platform makes operational sense, where it creates friction, and where the organizational cost may outweigh the benefit. There is also a second level of analysis, often overlooked in reviews: what happens to the data generated by the Gantt chart once the plan is finalized?
If they remain confined to the project view, they serve a coordinating function. If they are integrated with an analytics platform like ELECTE, they can contribute to forecasting, capacity analysis, variance analysis, and decision-making simulations. This marks the transition from planning to forecasting. For many SMEs, it is also the point at which the software ceases to be an operating cost and begins to serve as a management tool.
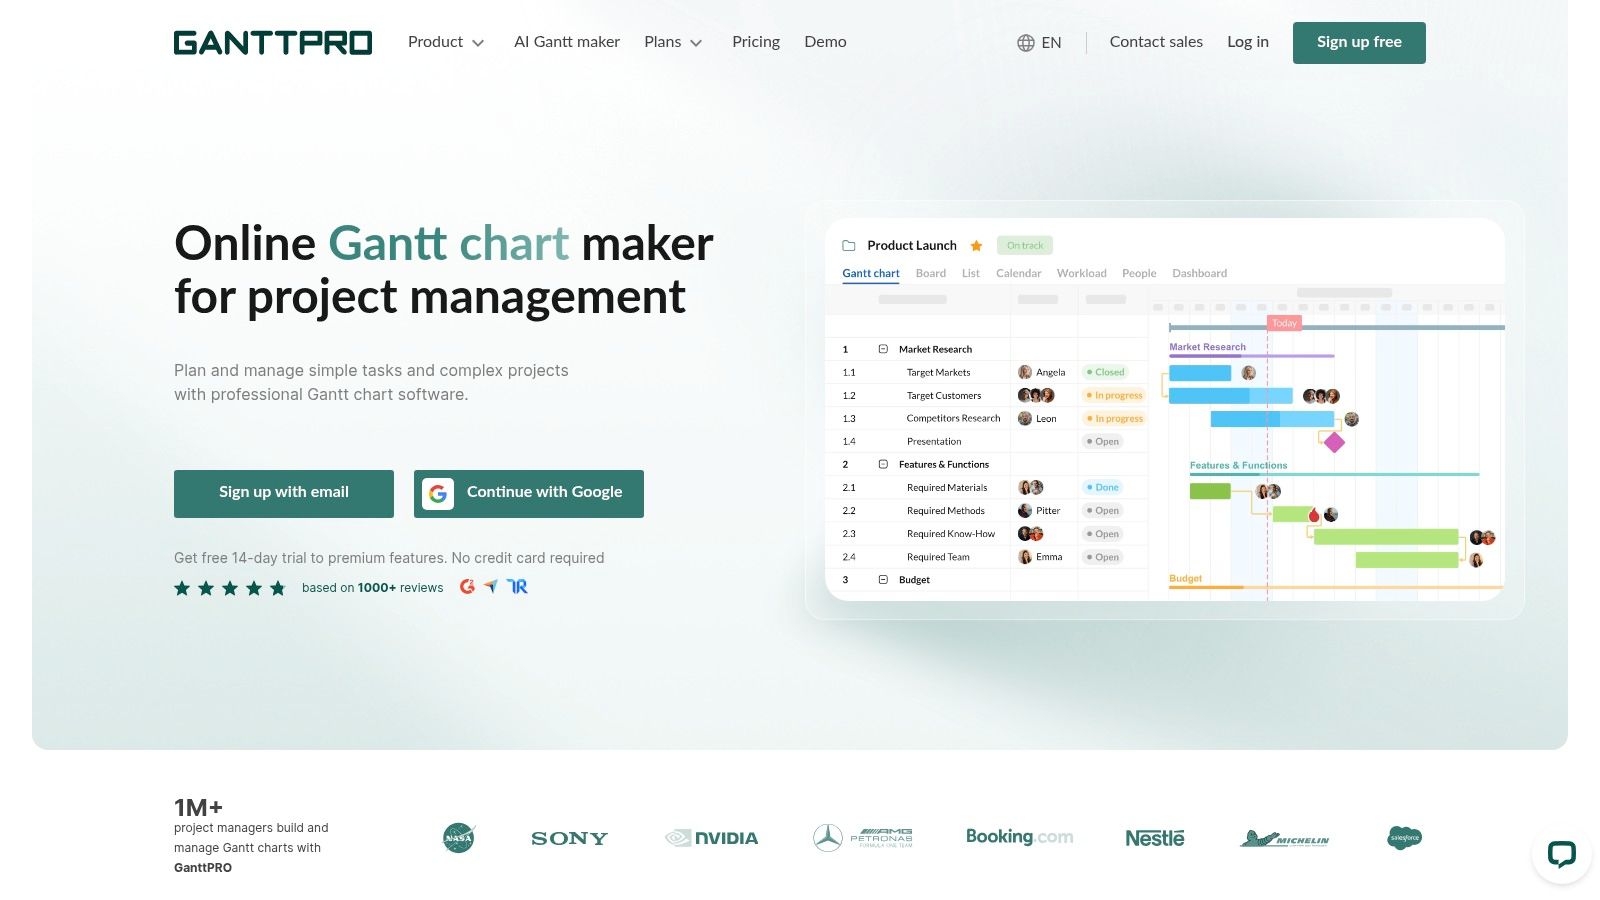
What does an SME really need when looking for an online Gantt chart? As many features as possible, or a system that makes timelines, dependencies, and responsibilities clear without months of configuration? In this market segment, GanttPRO offers a clear choice: to use the Gantt chart as the operational hub, not as a secondary feature within a broader platform.
For some companies, this is a tangible benefit. Those coming from a world of shared spreadsheets, Excel files, and manual updates will find a more organized environment for managing timelines, milestones, dependencies, baselines, and workloads. For others, the scope may seem too narrow. If the project also requires cross-functional automation, CRM, ticketing, or processes far removed from planning, a specialized product risks addressing only part of the problem.
GanttPRO really shines in one specific scenario: SMEs that need to bring structure to their planning without immediately purchasing a more complex work management suite. Its value lies in its clarity. An operations manager can see the sequence of tasks, a sales representative can understand the deadlines, and management can monitor deviations with less room for subjective interpretation.
The distinction matters. A standalone Gantt chart tool alone won’t solve the challenges of managing complex portfolios, but it can reduce initial resistance to adoption. For a company with 10 to 50 employees, this matters more than it might seem. If the team doesn’t use the tool, even the best features are irrelevant.
The points to consider are as follows:
This is where the strategic point of interest for SMEs comes into play. The real value doesn’t come just from visualizing the plan, but from using the data generated by the plan. If a company systematically exports estimated timelines, actual progress, resource utilization, and deviations from baselines, it can feed this data into an analytics platform like ELECTE and move from planning to forecasting: which projects tend to slip, which teams overestimate or underestimate, and which orders are already squeezing margins in the first few weeks.
In this context, GanttPRO should not be judged solely on the basis of its user-friendly interface or list of features. It should be evaluated based on the level of operational maturity it enables. For an SME that prioritizes order over complexity, it is a credible option. For those seeking a single system to manage every business process, however, the evaluation should be approached with greater caution.
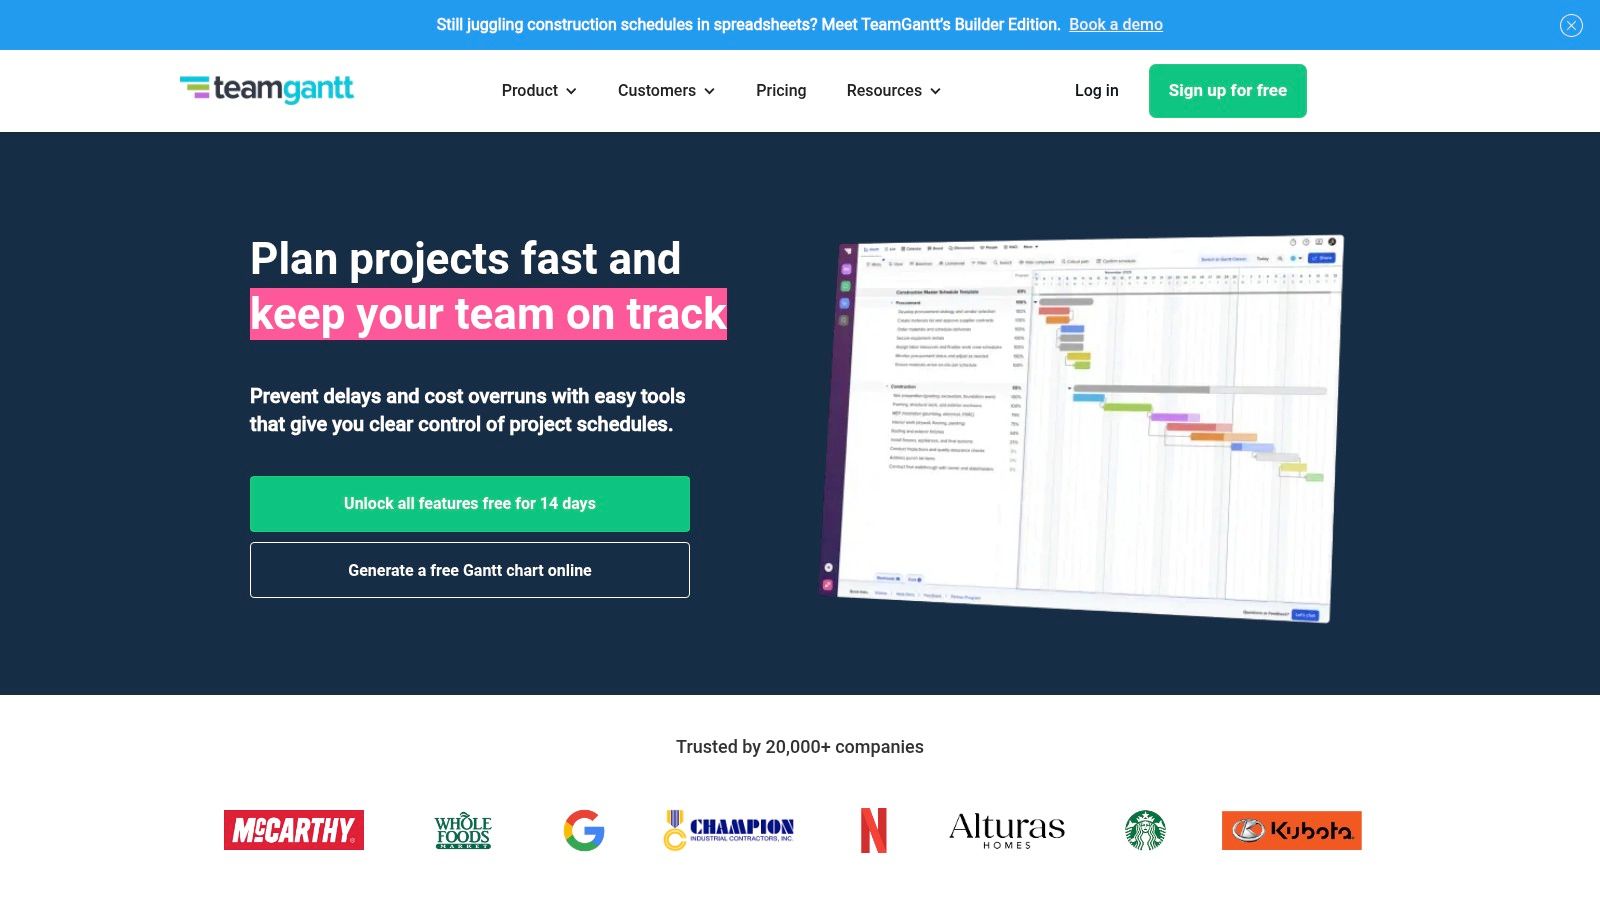
What does an SME really need if it wants to move beyond spreadsheets without ending up with an overly complex software suite? TeamGantt is designed specifically for this segment of the market. Its mission has been clear for years: to make Gantt charts accessible even to small, cross-functional teams that aren’t accustomed to the formalities of project management.
The key point to note isn’t just the interface. It’s the operational model it promotes. TeamGantt tends to work well in contexts where the project has clear boundaries, a defined duration, and a limited number of stakeholders who need to immediately understand who does what, by when, and with what dependencies. Agencies, engineering firms, small software companies, and marketing departments with parallel projects often fit this profile.
There is also an economic aspect worth considering: pricing per project, rather than the traditional per-user cost. For some SMEs, this is a tangible benefit, especially when many people need to view the schedule but only part of the team updates it daily. For other companies, the benefit is less significant, because the real bottleneck isn’t the number of licenses, but the need to integrate the schedule with broader processes, approvals, capacity planning, and executive reporting.
TeamGantt really shines when the primary goal is operational clarity. The combination of drag-and-drop functionality, dependencies, alternative views, and real-time project status updates reduces the initial learning curve. In a company that is still standardizing its methodology, this matters more than a long list of modules.
The limitation becomes apparent at a higher level. If an SME manages complex portfolios, multi-team governance, extensive automation, or PMO-style workflows, the platform may feel limiting. Not because it lacks basic Gantt chart features, but because the software is geared toward collaborative planning rather than large-scale enterprise coordination.
For buyers, this distinction is strategic.
This issue directly affects SMEs that want to move from planning to forecasting. An online Gantt chart generates useful data, but its value increases only if that data is taken out of the timeline and compared with costs, capacity utilization, average execution times, and profit margins. In this context, TeamGantt can serve as a good starting point for business process management linked to operational analysis, provided the company has already decided how to use the plan’s outputs in analytics tools such as ELECTE.
The bottom line is less straightforward than it seems. TeamGantt isn’t the most comprehensive option on the market, nor does it even try to be. For an SME seeking organization, quick adoption, and a timeline that’s easy for non-specialists to understand, it remains a solid choice. For those who want to turn the Gantt chart into a control center for highly diverse processes, however, a more cautious approach is warranted.
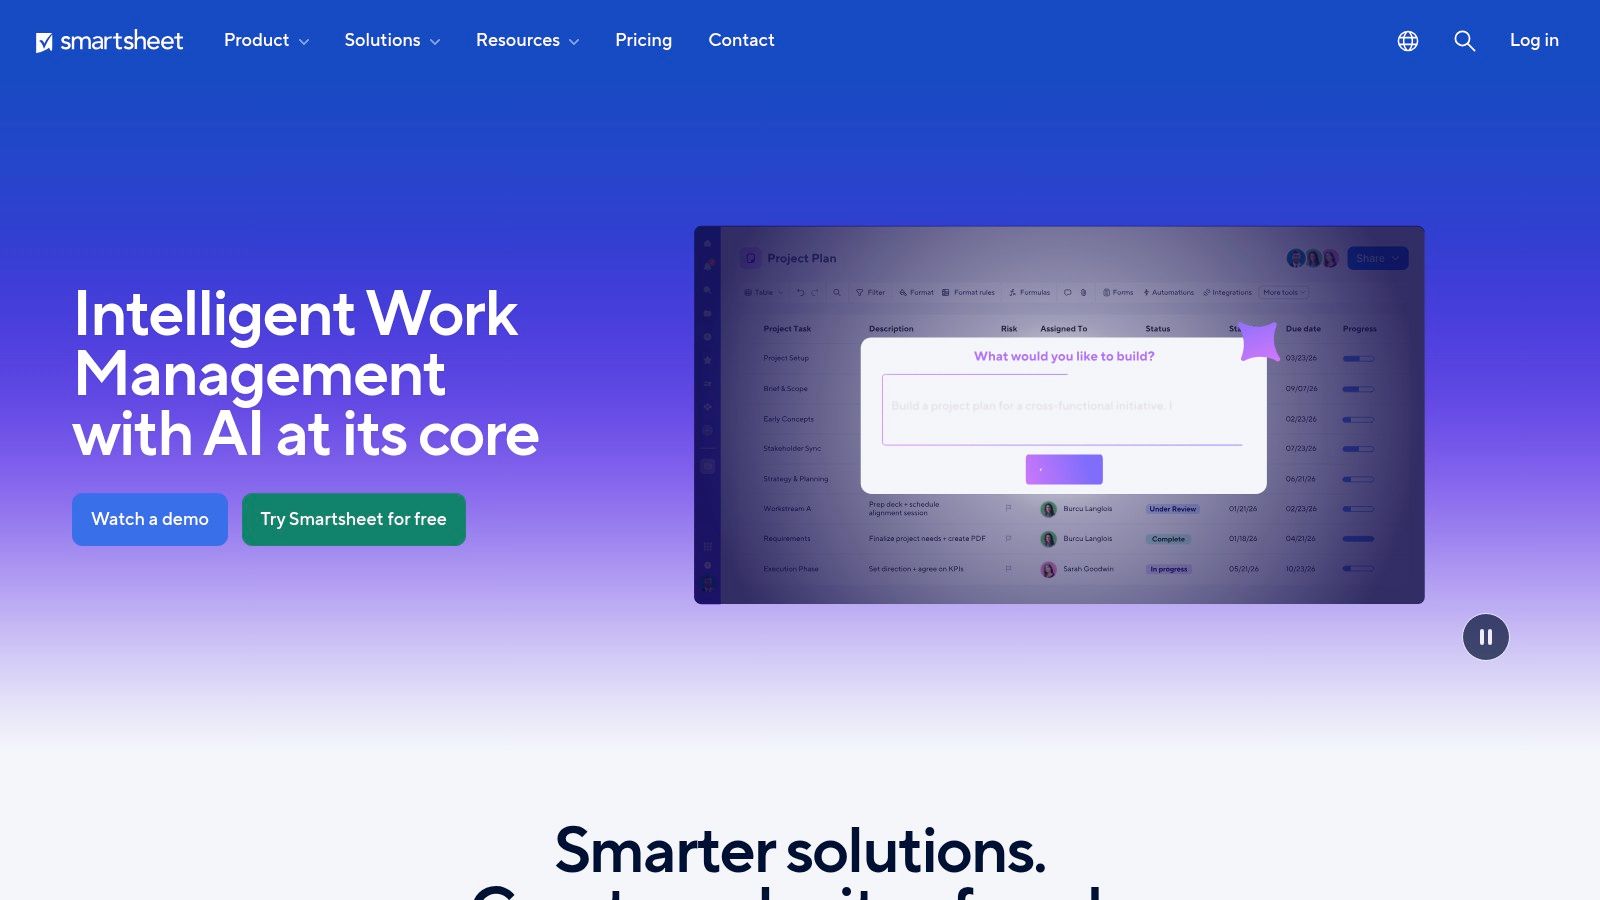
What does an SME really get when it chooses Smartsheet: a simple online Gantt chart, or a system that functions more like an operational database? The answer matters, because Smartsheet isn’t just a timeline. It’s built on sheets, views, automations, and data relationships. The Gantt chart is one of the interfaces—not the product’s sole focus.
This is where it differs from more straightforward tools. If the goal is to view tasks, deadlines, and dependencies with as little friction as possible, Smartsheet may be more complex than necessary. If, on the other hand, the project involves approvals, cross-departmental workflows, formulas, reports, and integrations with other business systems, the platform operates in a different segment of the market.
Smartsheet’s official documentation emphasizes this point: the product combines a grid, a timeline, automations, and integrations to manage operational work and reporting within the same environment. This approach is particularly appealing to growing SMEs, where the challenge isn’t just planning, but keeping sales, operations, and delivery aligned without creating a proliferation of files.
For small and medium-sized businesses, Smartsheet makes sense when the Gantt chart generates data that needs to be retained beyond the timeline. Planned and actual dates, recurring delays, approval bottlenecks, team workloads, and resource saturation become more useful when they feed into an analytics system. Following this logic, planning can link to data-driven business process management and then to analytics platforms like ELECTE, with one key step: using the Gantt chart’s output for forecasting, not just progress tracking.
This approach isn't for everyone.
A small business that manages only a few short-term projects may primarily see the organizational costs associated with greater flexibility. A service company with multiple active clients in the same month, on the other hand, can benefit from automation, multiple views, and integrations with external dashboards. The difference lies in the use case, not in brand prestige.
The verdict, therefore, is less clear-cut than it seems. Smartsheet isn’t the obvious choice for those looking solely for an online Gantt chart. For small and medium-sized businesses that want to turn their planning into a database that can also be used for forecasting, operational oversight, and cross-functional analysis, it remains one of the most credible options to consider.
Does Microsoft Planner Plan 1 make sense as an online Gantt chart tool for an SME, or is the fact that it’s already integrated into Microsoft 365 more important?
The answer varies greatly depending on the operational context. For a company that uses Teams, Outlook, SharePoint, and Entra ID on a daily basis, Planner Plan 1 reduces a cost that is often overlooked in software selection: the time wasted getting a separate system adopted. For an SME that is primarily looking for advanced control over its project portfolio, resources, and multiple scenarios, the same product may seem more limited than the Microsoft brand might suggest.
The point here isn’t the richness of the individual Gantt view. The point is the continuity of the workflow. Microsoft has gradually brought tasks, plans, and collaboration back into Planner, building on the legacy of Project for the web. For many companies, this means one concrete thing: fewer switches between tools, less friction in coordination, and a higher likelihood that the plan will actually be updated.
It’s an operational advantage, not just a technical one.
For Italian SMEs with administrative, sales, and delivery teams already set up on Microsoft 365, Planner Plan 1 tends to work well in three specific use cases: internal projects with simple dependencies, cross-departmental task coordination, and planning that needs to remain visible within the day-to-day context of Teams. In these scenarios, the value doesn’t come from flashy features, but from its practicality.
The limitation becomes apparent elsewhere. If management wants to compare workloads across projects, simulate resource allocations, or convert Gantt chart data into structured forecasts, the scope of Plan 1 may prove too narrow. This is where an SME needs to think strategically: either use Planner as an integrated planning tool within the Microsoft ecosystem, or move up to more sophisticated tools for project portfolio management.
There is also a less-discussed but important aspect to consider when making a purchase. Microsoft’s naming conventions—including Planner, Project, and the various product transitions over the past few years—have created confusion in many comparative evaluations. Buyers should carefully verify what is included in the plan, which views are available, which dependencies are supported, and where the native reporting capabilities end.
From an SME perspective, this leads to a useful distinction. Planner Plan 1 is a viable option if the goal is to integrate the Gantt chart into a platform the company is already using. It becomes less compelling if the Gantt chart is also intended to serve as an analytical foundation for forecasting decisions. In the latter case, the key step is not merely to choose software with more features, but to link planning outputs to an analytics platform like ELECTE, so that delays, team overload, and variances can be interpreted as predictive signals—not just as progress updates.
Therefore, the decision depends less on brand strength and more on initial demand. Does your company need to plan within the ecosystem it already uses, or does it need to build a project database for more in-depth analysis? Planner Plan 1 is a solid solution for the first scenario. In the second, it can serve as a starting point, though not always the end goal.
monday.com frequently makes the shortlist for small and medium-sized businesses for a specific reason. The Gantt chart isn’t the main product. It’s just one feature within a broader platform designed to coordinate sales, marketing, operations, and delivery all within the same environment.
For an SME, this difference matters. Those looking for an online Gantt chart focused purely on planning may find monday.com more complex than necessary. On the other hand, those managing campaigns, product launches, customer onboarding, or retail workflows involving multiple departments may view the Gantt chart as just one part of a broader workflow system.
The key strategic point is this: monday.com tends to perform best in situations where a project generates data that needs to be shared immediately across different teams. Timelines, custom columns, automations, and dashboards help turn the plan into a shared workflow. The advantage lies not only in visualizing dependencies, but also in the ability to link project activities to related business processes.
For SMEs with hybrid workflows, the comparison shouldn’t be limited to specialized Gantt chart software. It should also include platforms that aim to combine planning with cross-functional coordination. In this regard, monday.com holds its own, especially where work governance matters as much as the chart itself.
A useful perspective concerns the method itself. If a company alternates between structured and iterative approaches, the value of the Gantt chart increases when it is linked to a more flexible operational model. This is the same tension that emerges in agile IT project management practices for SME teams, where the timeline serves to highlight constraints and priorities without making the entire workflow rigid.
There is, however, a second level of analysis that is often overlooked in reviews. If monday.com becomes the place where dates, delays, bottlenecks, and workloads are tracked, that data can move beyond descriptive reporting and inform predictive analysis. For an SME, the most mature step is not just to view the project in progress, but to use the Gantt chart’s outputs alongside an analytics platform like ELECTE to estimate team saturation, recurring deviations, and operational risk before they become financial problems.
The main practical limitation remains the seat-based pricing model. For small teams, seasonal teams, or those with sporadic usage, cost-effectiveness must be carefully evaluated. monday.com is most effective when a company truly leverages the full scope of the platform, not when it uses the Gantt chart as a standalone feature.
Asana doesn’t speak the traditional language of specialized Gantt software. It speaks the language of cross-functional collaboration. Its Timeline is Gantt-like, with visible dependencies and conflicts, but the product is designed to help marketing, IT, operations, and management work together in a single environment.
This makes it particularly well-suited for small and medium-sized businesses that have cross-functional processes but lack a highly formal project management culture. In other words, Asana is popular in environments where projects are seen as a means of coordinating work, rather than a methodological framework to be strictly enforced.
In 2025, user satisfaction with online Gantt charts reached 89% among data analysts and retail managers in the study cited by Integrate.io, with 72% of SMBs using them to coordinate AI-driven workflows. This figure pertains to the category as a whole, not Asana specifically, but it helps explain why tools with strong usability and broad integration continue to grow.
For those who work using hybrid methods, Asana’s Timeline can serve as a reliable bridge between lean agile and more visible planning. On the topic of balancing agility and coordination, ELECTE’s article on agile IT project management is also worth reading.
“If the team can open the timeline without needing training, half the work of getting them on board is already done.”
Asana is therefore less of a “Gantt chart tool” and more of a “collaboration space with a timeline view.” For many teams, that’s exactly what they need. For others, it’s not specialized enough.
Wrike comes into play when an SME is no longer just looking for a clear timeline, but for a project management system. The platform combines advanced Gantt charts, shareable snapshots, dependencies, constraints, dashboards, automations, resource management, and EU data center options. The point isn’t the sheer number of features. It’s the type of organization it’s designed for.
For companies with established processes, multiple departments involved, and a need for traceability, this approach may make sense. For small teams or those with limited project management experience, it can result in longer setup and adoption times.
For many SMEs, the issue isn’t simply having an online Gantt chart. It’s about determining whether the Gantt chart should serve as the central hub for managing workloads, priorities, and responsibilities across different departments. Wrike positions itself precisely here, in a space closer to operational governance than to visual task management.
A useful reference comes from the Confartigianato Imprese Lombardia observatory, which closely monitors digitalization, work organization, and the needs of local SMEs. It does not provide a ranking of software, but the context is clear: in companies that grow on a project-by-project basis, the pressure on planning, interdepartmental coordination, and resource management increases rapidly. In this scenario, more structured tools find their place even where, at first glance, they might seem overkill.
Wrike really shines when the timeline needs to reflect teams’ actual capacity, not just the sequence of tasks. This is particularly relevant for engineering firms, professional services firms, project-based manufacturing companies, and organizations with numerous internal stakeholders.
There is also a strategic aspect that is often overlooked. In an SME context, the value of a Gantt chart extends beyond planning. If data on progress, delays, resource utilization, and milestone slippage is exported and analyzed within an analytics platform like ELECTE, the software ceases to be merely a monitoring tool and becomes a foundation for operational forecasting. This is where Wrike can appeal to more analytical buyers: not so much for “making a plan,” but for generating scenarios, identifying recurring bottlenecks, and improving decisions regarding capacity and margins.
The downside, however, is the learning curve. Wrike works best when a company already has established processes, roles, and reporting criteria. Without this structure, the wealth of features risks outweighing the benefits.
Is Zoho Projects a compelling choice for an SME that really wants an online Gantt chart, or is it primarily an ecosystem purchase? The answer depends less on the feature list and more on the company’s operational context.
For many small and medium-sized businesses, Zoho Projects is worth considering for one specific reason: it combines Gantt charts, dependencies, timesheets, budgets, and mobile apps at a price point that is often more affordable than that of several general-purpose competitors. The point, however, isn’t just the cost. What matters is how the product fits into existing processes, especially if CRM, finance, or collaboration are already managed within the Zoho environment.
This is where its true market positioning becomes clear. Zoho Projects tends to work well for small and medium-sized businesses seeking consistency across planning, execution, and administration, without creating new software silos. For a buyer on a tight budget, this consistency may be more important than a more polished interface or advanced enterprise features.
There is a downside. Companies that manage complex portfolios, require more in-depth cross-project reporting, or have multi-level governance may find that the basic plans have certain limitations and need to upgrade to get the visibility they need. This isn’t necessarily a flaw; it’s a matter of the scope of use.
For a strategic perspective, Zoho Projects should be viewed beyond just the work plan. If milestones, variances, workloads, and actual results are imported into an analytics platform like ELECTE, the Gantt chart ceases to be merely an operational view and becomes a source of data for forecasting. An SME can use this data to estimate recurring delays, team capacity utilization, profit margins per project, and the reliability of commercial deadlines. This is the step that distinguishes a tactical decision from a managerial one.
In short, Zoho Projects doesn’t aim to stand out through its image or perceived sophistication. It really shines when project management software needs to fit into a broader digital workflow, with transparent costs and streamlined processes. For many SMEs, this is a more practical consideration than it might seem.
OpenProject doesn’t compete on the same playing field as SaaS solutions that prioritize immediate ease of use. Its offering is centered on open source, European cloud hosting, on-premises options, code transparency, and data control. For some SMEs, these factors are secondary. For others, especially in sensitive sectors, they are decisive.
This changes the criteria for choosing. If the question is “Which Gantt chart is the simplest?”, OpenProject isn’t the top contender. If the question is “How do I maintain control, auditability, and deployment flexibility?”, it becomes part of a much smaller group.
The growth of mobile and cloud-based Gantt charts in Italy has also brought to light a less-discussed issue. According to data reported by TILOS Help, cloud adoption in Lombardy rose by 29% in Q1 2026, while AGID 2025 reports a 37% breach rate in non-compliant tools. This data should be treated as a risk scenario, not as a judgment on individual vendors. But it is enough to explain why some companies are beginning to look beyond UX alone.
OpenProject makes sense when control over the infrastructure is a factor in the decision.
Not all SMEs need data sovereignty. Those that do, however, usually cannot treat it as a minor detail.
This approach benefits companies with an in-house IT department or a reliable partner. For others, maintenance costs can offset the theoretical advantage.
What does an SME really need? Is it more about internal team collaboration, or greater clarity regarding who needs to approve, fund, or monitor the project from the outside?
This is where ProjectManager comes into play. Its interactive Gantt chart updates in tandem with the board, calendar, and sheet, but for many companies, the most important feature isn’t the view itself. It’s the ability to share plans, progress, and deadlines with stakeholders who don’t use the software on a daily basis.
For an SME that manages clients, suppliers, and management simultaneously, this changes the value of the tool. In many cases, the challenge isn’t creating a plan. The challenge is sharing it in a clear and accessible way, with as little friction as possible, without turning every update into a meeting or a chain of emails.
In the online Gantt chart market, ProjectManager isn’t as well-known as some of the more frequently mentioned names, but it has a clear rationale. It focuses on a multi-perspective approach, with integrated timelines, task management, and reporting—a feature that’s useful when a project needs to be presented to different audiences. The project lead wants to see dependencies and workload. The client wants dates and status updates. Management wants to know whether the plan remains aligned with the budget and priorities.
This also highlights a strategic point that is often overlooked in reviews. For many SMEs, the Gantt chart should not stop at planning. It should serve as input for subsequent analysis of delays, bottlenecks, resource saturation, and recurring deviations. From this perspective, the ELECTE section on the types of charts essential for turning data into decisions helps explain how data from a plan can be reorganized into dashboards and forecasting models, rather than remaining confined solely to the timeline.
The point, then, is not just whether the Gantt chart “looks good.” It is whether the data generated by the plan can be reused to make decisions earlier.
ProjectManager makes the most sense in a specific scenario: companies that aren’t looking for infrastructure sovereignty—as is the case with OpenProject—nor an overly extensive ecosystem. Instead, they’re seeking a tool capable of integrating internal operations with external communication. For some Italian SMEs, this is a concrete priority, not just a secondary feature.
ProductKey FeaturesUser Experience & QualityIdeal AudienceUnique Selling PointsPricing / PlanGanttPROInteractive Gantt, dependencies, critical path, resources, baselines, mobile appClean interface, quick learning curveTeams looking for a comprehensive Gantt chart without an extensive suiteEase of use, EU data residency (Azure)Pricing per user, transparent and competitiveTeamGanttDrag-and-drop Gantt, calendars, timelines, CSV/PDF reports, add-onsIntuitive and quick to adoptTeams that frequently start and close projectsProject-based pricing (not per user)Price per project; paid add-onsSmartsheetSpreadsheets + Gantt views, automations, formulas, BI/API integrationsPowerful and flexible, more complexPMOs and multi-project portfoliosExtensive BI integration and advanced automationsBusiness/Enterprise plans; Comprehensive add-ons and rolesMicrosoft Planner (Plan 1)Timeline/Gantt, dependencies, sprint support, M365/Teams integrationSeamless for Microsoft users, native integrationOrganizations already on Microsoft 365/TeamsDeep integration with M365 and TeamsCompetitive pricing if on M365; Limited for advanced PPMmonday.com Work ManagementTimeline/Gantt, Kanban, automations, integrations, data residencyModern, highly customizable UITeams seeking flexibility and templatesApp ecosystem, data residency options (EU/US/APAC)Pricing per seat with minimums; features available on higher tiersAsana (Timeline)Timeline with dependencies, portfolios, goals, integrationsPolished UX, rapid adoptionCross-functional and collaborative teamsUser experience and ease of adoptionTiered plans; bundles, and complex pricing policiesWrikeAdvanced Gantt, resources, dashboards, automations, EU data residencyRobust for complex projects, steeper learning curveEnterprise companies with compliance requirementsEnterprise features and EU data center optionsTiered plans; key features at higher tiersZoho ProjectsGantt, dependencies, timesheets, budgets, EVM, mobile appGood value for money, functional interfaceSMEs and users of the Zoho ecosystemNative integration with Zoho suite, multilingual (IT)Affordable, accessible plans for SMEsOpenProjectGantt, WBS, cost tracking, EU hosting or on-premise, BIMFlexible but requires setup and managementEU organizations requiring data sovereigntyOpen-source, full data control, and on-premise deploymentEU Cloud or self-hosted; Enterprise optionsProjectManagerGantt, Board, Calendar, MS Project import, read-only guestsGood for external sharing and stakeholdersTeams that need to share plans with many stakeholdersImport from MS Project, unlimited read-only guestsPortfolio plans on Business; details after plan selection
Which investment will be more important for an SME in 2026: another project management software, or the ability to turn project data into better decisions?
After comparing ten solutions, one conclusion stands out clearly. The decision to use an online Gantt chart is no longer just about the quality of the timeline. It’s about the level of control the company wants to exercise over timelines, resources, costs, and operational priorities.
Viewed from this perspective, the tools are categorized by use case rather than by popularity. GanttPRO and TeamGantt remain straightforward options for SMBs seeking rapid adoption and a manageable learning curve. Microsoft Planner Plan 1 makes the most sense within established Microsoft 365 environments, where value comes from daily integration rather than the depth of the Gantt chart. Asana and monday.com work well in cross-functional teams—sales, marketing, and operations—where collaboration and visibility matter as much as project discipline. Smartsheet and Wrike rank higher on the scale of governance, reporting, and complex processes. Zoho Projects remains a rational choice for those on a tight budget who don’t want to sacrifice operational control. OpenProject meets specific needs for data sovereignty and customization. ProjectManager has a practical advantage in contexts where sharing with external stakeholders is part of the job.
For many small and medium-sized businesses, the critical point comes after the planning phase.
A Gantt chart organizes tasks, dependencies, and deadlines. However, it is not enough to explain why certain delays keep recurring, which teams are more prone to variability, or which projects are eroding profit margins before the problem shows up in the financial statements. This is where the nature of evaluation changes. Project management software remains at the operational level. Competitive advantage shifts to the analytical level.
In practice, the data generated by the Gantt chart—such as progress, delays, resource utilization, and average durations per phase—can be sent to an analytics platform to build predictive scenarios, risk models, and reports that are understandable even to those who do not manage the project on a daily basis. For a manufacturing SME, this might mean estimating the impact of a production bottleneck on future deliveries. For a service company, it can mean identifying in advance which projects are exceeding their budgeted scope. For a retail business with multiple campaigns and suppliers, it can mean linking project delays, inventory, and promotions into a single decision-making framework.
Here, the distinction between the “best tool” and the “most suitable tool” becomes clear.
Organizations with few projects, small teams, and standardized processes can achieve satisfactory results using simple tools, provided they are used consistently. Those managing cross-functional projects, supply chains, external suppliers, or regulatory constraints should evaluate not only the interface but also the API, export quality, permission structure, data residency, and the potential for subsequent analysis. In many companies, the hidden cost isn’t the software license fee. It’s the fragmentation of data across planning, execution, and reporting.
That is why the most useful question for an SME is not “What is the best online Gantt chart?” It is a different one: Which combination of planning tools and analytical capabilities best enables you to predict delays, workloads, and financial results?
If these answers are clear, the shortlist becomes clear as well. And the choice ceases to be merely a matter of personal preference.
If you want to go beyond basic planning, ELECTE—an AI-powered data analytics platform for SMEs—can help you link your online Gantt chart data with forecasting, risk assessment, automated reports, and operational insights that even non-technical teams can understand. This is the step that transforms a timeline into a decision-making tool. Discover how ELECTE works and consider whether your next step forward might not be yet another PM software, but a smarter way to interpret the data your project is already generating.

.svg)
.svg)
.svg)