
An SME may realize this in the simplest—and most costly—way: a project falls behind schedule, an order gets held up, a file disappears, or a check is skipped. At that moment, operational risk management is no longer just a theoretical concept; it becomes the difference between a problem that’s resolved and one that recurs. That’s why it’s best to treat it as an ongoing process, not as a checklist to pull out only after an incident occurs.
In practical terms, operational risk is the risk of losing money, time, or reputation due to processes, people, systems, or external events that do not function as they should. Italian regulatory authorities have already established a structured approach, based on internal data, external data, scenarios, and factors related to the operational environment and internal controls, using a quantitative and preventive methodology in line with the Bank of Italy’s guidelines. For an SME, the implication is simple: you need to know where things go wrong, how much it costs you, and how to spot the problem early on.
A warehouse error that disrupts a shipment, a glitch in the management software that halts invoicing, or unauthorized access that exposes sensitive data. This is operational risk management in its most concrete form: identifying where business continuity could be compromised and taking action before the damage becomes structural.
For an SME, the main sources are immediately apparent. People make mistakes, processes get bogged down, systems crash, and external factors change the rules of the game. Categorization is useful precisely because it prevents you from labeling everything as a “generic problem” and forces you to distinguish between a data entry error, a flawed procedure, and an IT failure.
Within the AMA framework, the Bank of Italy highlights four essential components: internal loss data, external loss data, scenario analysis, and factors related to the operating environment and the Bank of Italy’s internal controls. For an SME, this means developing a perspective that is not limited to the past but also looks ahead to what might happen and assesses how well internal controls actually hold up.
Rule of thumb: If an event can recur without anyone noticing it in time, it is already a poorly managed operational risk.
This approach works because it turns everyday experiences into decisions. There’s no need to wait for a major loss to realize that a procedure needs to be rewritten; often, recurring minor incidents, unusual delays, and anomalies in workflows are enough. Operational risk management serves precisely to prioritize these friction points before they erode margins and erode trust.
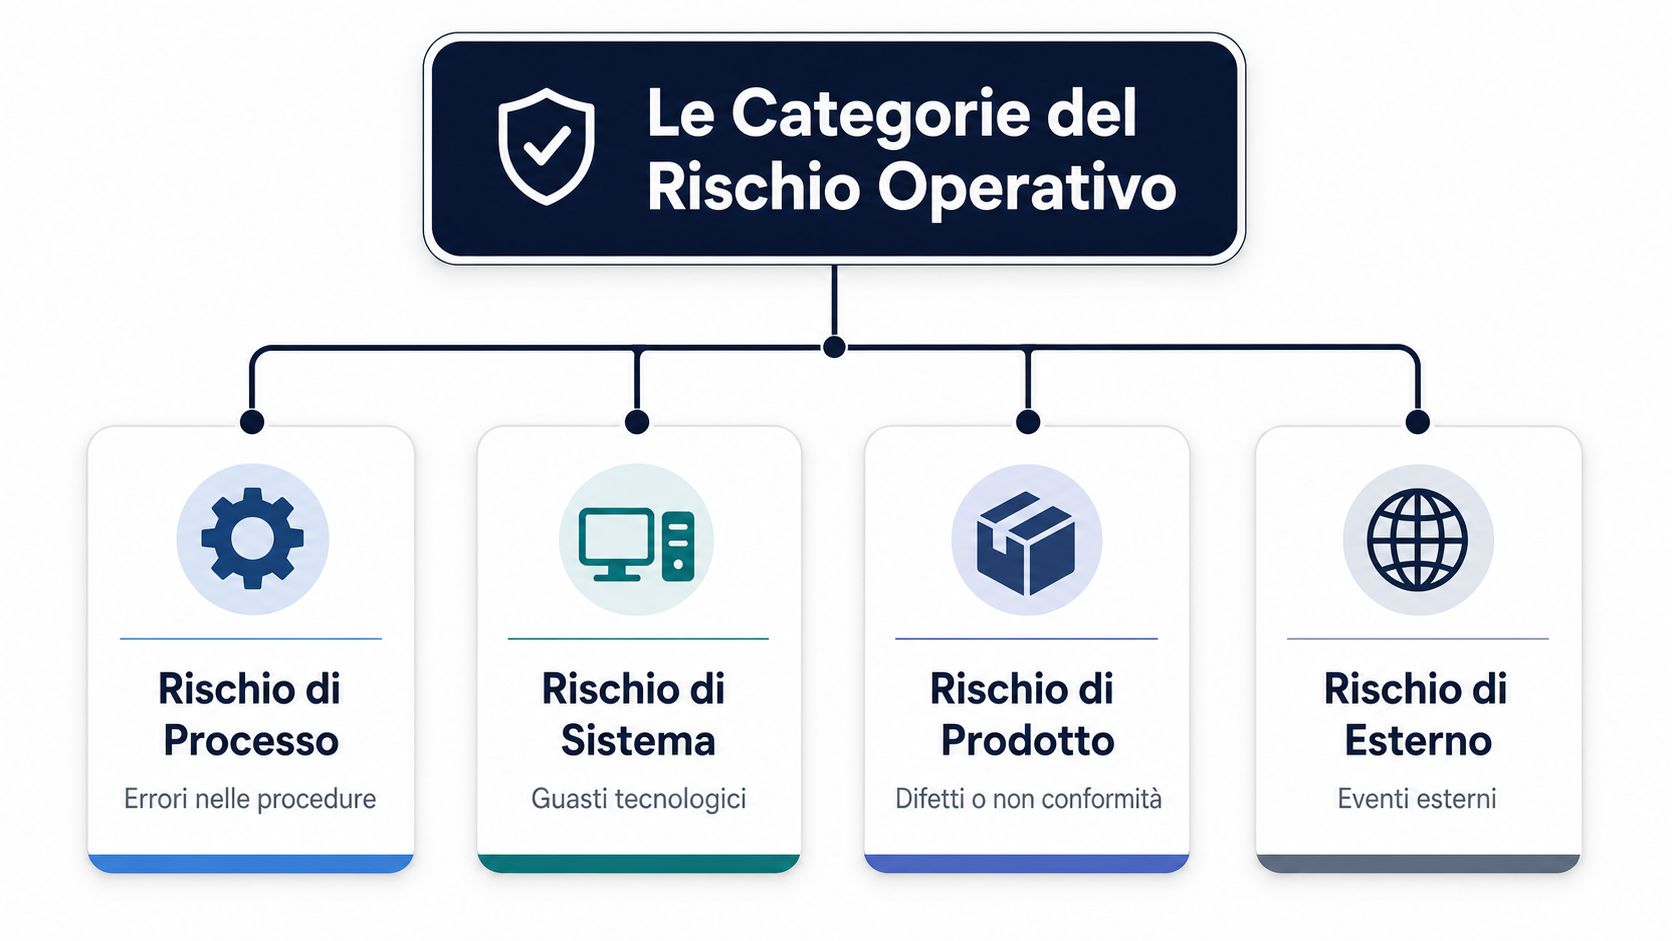
A clear classification helps avoid two common mistakes: underestimating “harmless” risks because they seem trivial, and overestimating the more visible ones simply because they attract attention. In business practice, the most useful taxonomy is one that distinguishes between people, processes, systems, and external events. It is simple enough to be used by a department head, yet robust enough to support a comprehensive risk map.
People create risk when they lack the necessary skills, when roles are unclear, or when opportunities arise for fraud and repeated errors. In retail and e-commerce, for example, a single manual entry made incorrectly can affect inventory, prices, or returns, and the error spreads quickly.
Processes become fragile when there are overly lengthy procedures, unnecessary approvals, or undocumented steps. The Italian guidelines on operational risk assessment methodologies describe a shift from a simple accounting approach to a more analytical one, based on controls, indicators, and the mapping of vulnerabilities (LIUC documentation). In the context of an SME, this means the process must be designed to be repeatable, not just “correct on paper.”
These systems include software, infrastructure, and cybersecurity. FINMA emphasizes the need for a comprehensive inventory of critical hardware and software, with a defined risk tolerance and a focus on availability, confidentiality, and integrity as defined by FINMA. For a company, this translates into a concrete question: Which assets can they not afford to have down for even an hour?
External events include supply disruptions, regulatory changes, and logistical disruptions. In e-commerce, all it takes is a critical partner falling behind schedule or a change in the payment process to create a risk that doesn’t originate within the company but immediately impacts its results.
A good risk map doesn't have to be fancy—it has to be useful. If an item doesn't clearly fall into one of the four categories, it's usually not a new risk—it's a poorly described risk. Getting this organized makes everything else easier, from assessment to monitoring.
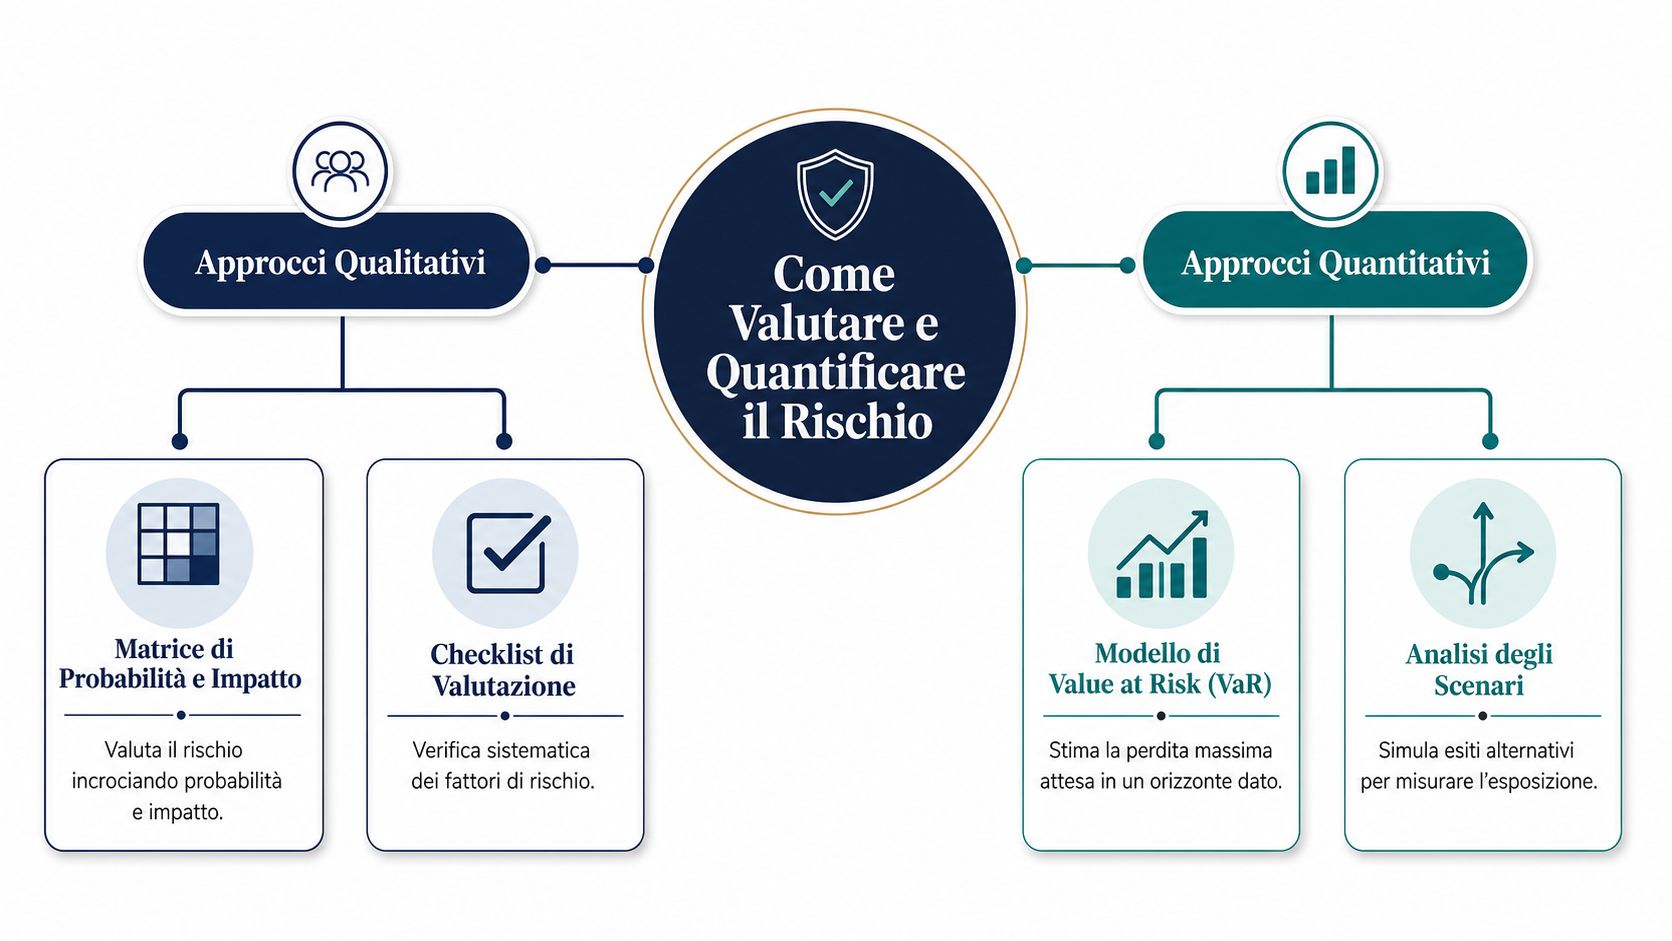
In an SME, risk assessment works best when it remains practical. You start with simple tools, gather reliable indicators, and increase the level of analysis only for risks that have a real impact on costs, business continuity, or reputation. The probability-impact matrix is often the first step because it allows you to make quick decisions without waiting for an overly complex system to be put in place.
The qualitative matrix serves to organize the team’s assessment. Probability, impact, and operational priority are assigned to each risk, so as to distinguish between those that require immediate action and those that can remain under observation.
For an SME, the advantage lies in practicality. A risk that is well-described becomes part of daily operations, while a poorly described risk remains a vague perception and does not help in deciding where to allocate time and budget.
The Italian guidance on the European standard method specifies a capital requirement equal to 15% of the relevant indicator published by the Ministry of Economy and Finance. For an SME, the goal is not to simply replicate that calculation, but to understand the underlying logic, convert an operational exposure into a comparable measure, and use it to set consistent priorities.
An unmeasured risk isn't small; it's just not very visible.
Quantitative analysis comes into play when the risk is recurring, costly, or linked to decisions that require a more precise estimate. The Italian technical literature describes the construction of frequency and severity distributions of losses, which are combined to form an aggregate distribution, with calculation of the 99.9th percentile (Ca’ Foscari University thesis). In practice, this is used to estimate how much the worst plausible operating day could cost.
The average reflects typical behavior. The percentile shows the extreme end of the distribution—the part that doesn’t occur every day but carries significant weight when it does. For an SME, this distinction is useful when deciding whether to invest in an additional control, a backup, a process review, or an automation solution.
Risk prediction models are particularly helpful at this stage, because they make it easier to assess which events warrant ongoing attention and which can be handled through standard controls. Here, AI provides a tangible operational advantage, as it can process large volumes of reports, identify recurring patterns, and support more regular monitoring without burdening the team with repetitive manual tasks.
The key for an SME is to move from a general perception to a useful estimate that informs decision-making. When the assessment is clear, the budget isn’t wasted, controls are focused where they’re truly needed, and operational risk management ceases to be mere theory and becomes a process.

A control system works when everyone knows what to look for and when to take action. The Basel Committee’s international best practices indicate that, in nearly all banks, internal controls and internal audit are the primary tools for managing operational risk (Basel Committee). For an SME, this does not mean copying a bank; it means adopting a clear and sustainable structure.
The first line consists of those who perform the work—purchasing, sales, operations, and IT. The second line establishes rules, controls, and priorities, while the third line independently verifies that the system is actually working. If any of these lines is missing, the risk becomes either unrecognized or uncontrolled.
Effective identification requires both qualitative and quantitative information to describe areas of operational, ICT, and security risk, as Intesa Sanpaolo notes in its Operational Risk Documentation. This point is fundamental because controls do not rely solely on policies; they rely on data, audits, and documented incidents.
Every event must leave a clear record. If a failure, fraud, or deviation is not included in an incident management process, management loses track of it, and the problems resurface under a different name.
A useful report isn't long; it's clear. It should explain what happened, which controls worked, which didn't, and what actions still need to be taken. When a report becomes nothing more than a decorative file, governance is already weaker than it appears.
Practical rule: The best internal control is one that produces decisions, not documents.
In an SME, this architecture can remain streamlined. All that is needed are clearly defined responsibilities, a consistent review schedule, and an escalation process that brings critical issues to the attention of decision-makers without delay.
Key Risk Indicators, or KRIs, are used to identify a situation deteriorating before it leads to an incident. Their strength lies in their ability to transform operational events into easy-to-read signals, so that the team does not discover the problem only after the damage has been done. A culture of continuous monitoring is already embedded in the international practices and guidelines cited in the BIS’s operational risk framework.
A good KRI doesn't measure everything; it measures what foreshadows a failure. In manufacturing, this might be the number of unplanned machine downtimes; in sales, the rate of blocked orders; and in IT, the volume of open tickets exceeding a threshold or an increase in log anomalies.
A useful rule is to select just a few indicators, each linked to a specific control or risk. If a KRI never leads to a decision, it is not a risk indicator—it is just another piece of data.
To create a clear and easy-to-read view, it’s best to separate the alert levels. Green for “situation under control,” yellow for “caution,” and red for “immediate action.” If you need a practical guide on how to use strategic dashboards, imagine a screen that shows only trends, thresholds, and required actions.
The right dashboard isn't meant to impress management; it's meant to help you take the right action faster.
The key factor is the link between data and accountability. A KRI without an owner remains just a number, whereas a KRI with a threshold and an accountable party becomes a governance tool.

In an SME, the challenge isn’t just identifying a risk once, but catching it as it unfolds. When controls are manual, monitoring often comes too late, because weak signals get lost among separate emails, files, tickets, and reports. AI makes operational risk management more continuous, because it analyzes data automatically, consistently, and in real time.
AI excels atanomaly detection because it identifies unusual behavior before it becomes apparent in monthly reports. A transaction flow that deviates from the norm, a recurring failure, or a ticket that grows abnormally are all signals that a platform can detect without waiting for the next audit.
With predictive analysis, the system doesn't just flag the problem—it tries to anticipate it before it happens. This is useful in technical processes and high-frequency workflows, where the delay in taking action matters more than the initial error. For those who need to optimize workflows with AI, the goal is not just to automate a single step, but to integrate monitoring into the operational workflow that generates it.
The guidelines on the ongoing management of operational risks specifically highlight the need to monitor and update risk profiles and key indicators, but in practice, many SMEs struggle to translate these principles into a truly actionable process. This is where AI fills the gap, because it links data to alerts and alerts to action.
The practical difference becomes apparent in repetitive cases—those that are time-consuming and leave truly critical controls unchecked. If the system recognizes a pattern, it can trigger an alert, assign it to the appropriate manager, and initiate the review without waiting for a manual intervention.
AI does not replace a manager's judgment. It makes that judgment faster, more informed, and less dependent on chance. For an SME, this means less time spent trying to identify the problem and more time spent solving it.

An SME can build a robust system without launching a massive project. The key is to work in phases, with clear, verifiable steps linked to a specific outcome. In practice, the process must immediately result in a risk map, clearly defined responsibilities, and faster decision-making. This approach is consistent with Italian methodologies that combine identification, assessment, controls, monitoring, and an action plan— the 4AIM framework.
First of all, you need to understand where the risk actually lies. Map out processes, people, systems, and external dependencies, then identify the points where an error, a delay, or an operational disruption would have an immediate impact on the service or costs.
At this point, gather the information generated by day-to-day operations. Incidents, near misses, audits, complaints, and operational anomalies help distinguish one-off problems from recurring risks—those that require ongoing monitoring and a designated owner.
Not all risks require the same level of attention. Use a probability-and-impact matrix to distinguish between risks that are tolerable and those that need to be addressed immediately, then rank the risks by priority based on the potential damage and the frequency with which the problem might recur.
This is where we see whether the controls actually work. Verify whether the controls exist, whether they operate as intended, and whether they cover the risk they are supposed to mitigate. If a control is missing, or if the control exists but is not being used properly, the gap must be identified and clearly assigned, leaving no ambiguity between the operational department and the control function.
The final phase is designed to ensure the process remains dynamic over time. Define KRIs, thresholds, review frequency, and escalation responsibilities, then use these elements to establish a monitoring system that goes beyond a one-time review and tracks the evolution of residual risk.
The logic behind residual risk is straightforward. It’s not just the initial risk that matters; what matters is what remains after controls are applied. When a risk remains too high, there’s no point in discussing it endlessly—what’s needed is to assign responsibility and set a deadline. In this way, operational risk management becomes a learning cycle, not a bureaucratic exercise.
If an SME wants to take a leap forward, AI can support every stage, from data collection to continuous monitoring of alerts. A well-configured system can identify recurring patterns, flag anomalies, update dashboards, and generate operational reports without relying on manual labor. The benefit isn’t just speed—it’s also consistency: the team identifies the most critical issues first and can take action with less wasted effort.

.svg)


.svg)
.svg)