The historical FOI index is a crucial data series published by ISTAT, essential for measuring the impact of inflation on rents and benefits. But are you sure you’re making the most of it? For many small and medium-sized businesses, it’s just a bureaucratic requirement. For the most competitive companies, however, it serves as a strategic compass for anticipating market trends and protecting profit margins.
In this guide, we won’t just explain how to calculate a contractual adjustment. We’ll show you how to turnthe historical FOI index from a simple number into a powerful ally for your business decisions. You’ll learn how to interpret fluctuations, find official sources, and use innovative tools to move from passive analysis to active forecasting, turning data into profit.

If you’ve ever dealt with a lease or a separation agreement, you’ve likely come across this acronym. FOI stands for “Consumer Price Index for Blue-Collar and White-Collar Workers.” It is one of the main inflation indicators calculatedby ISTAT (the National Institute of Statistics), the only official and certified source for this data. Relying on ISTAT’s historical data series is the only way to avoid calculation errors and potential legal disputes.
Unlike other indices, the FOI focuses on a basket of goods and services that reflects the consumption patterns of a specific segment of the population: households headed by a salaried worker. Its function is primarily legal in nature and serves to preserve the real value of monetary amounts over time.
That's whythe historical FOI index is so important to you:
Its role is not optional; rather, it is established by specific regulations.Article 81 of Law 392 of 1978 designates it as the official benchmark for monetary adjustments. For the latest information, you can check the most recent ISTAT index value and its practical implications.
To help you navigate this, it’s useful to understand the differences between the FOI, NIC, and IPCA. Each has a well-defined purpose and scope of application. Using the wrong index can lead to incorrect calculations and ineffective decisions.
In summary, while the NIC provides a snapshot of inflation at the national level and the HICP is used for comparisons within Europe, the FOI is the legally binding index you must use for the revaluation of contracts and financial obligations. Choosing the correct index is the first step toward an accurate analysis and protecting your interests.
To usethe historical FOI index, it’s not enough to simply look up a number in a table. The real value lies in knowing how to read and interpret it. ISTAT doesn’t just provide raw data; it also includes two types of changes that have very different meanings. Understanding this difference is the first step toward turning a number into useful information for your business.
A rushed reading can lead to calculation errors, especially when you need to adjust contracts or analyze economic trends. Let’s clarify these concepts, because this is where accuracy really matters.
The two key metrics for interpreting the index are the month-over-month change and the year-over-year change. Both measure changes in prices, but they do so over different time horizons, and that is the crucial point.
To give a practical example, if you need to adjust a rent in May, you will need the year-over-year change in the FOI index, calculated by comparing the May value of the current year with that of May of the previous year.
There is another aspect you cannot ignore: the base year. Periodically, ISTAT updates the base year for calculating the index, setting it to 100 (for example, “base 2015=100”). This isn’t just a bureaucratic formality: it serves to ensure that the basket of goods and services remains representative of consumer habits, which change over time.
Please note: when the base changes, the absolute values of the index are no longer directly comparable with previous historical series. This is where bridging coefficients come into play—special numbers that ISTAT publishes to "link" the old series to the new base. This ensures the continuity and accuracy of comparisons over the long term.
This consistency is essential if you want to analyzehistorical FOI data over a period of many years. Ignoring the coefficients leads to a distorted analysis, invalidating any conclusions about inflation trends. Fortunately, tools such as ELECTE, an innovative AI-based data analytics platform, can automate these complex calculations by integrating ISTAT data with business analytics tools to transform these figures into actionable insights.
Now that you have the basics down, let’s move on to the practical side. Knowing how to usethe historical FOI index to adjust a rent or alimony payment is the skill that makes the difference between a rough estimate and a precise calculation. It’s not a complicated process, but accuracy is everything. Let’s go through the steps together, one by one, to avoid the most common mistakes.
The core of the calculation is always the year-over-year change. In simple terms, you’ll compare the index for the month in question with that of the same month in the previous year. This will give you the annual inflation rate—the figure you need for the adjustment.
To calculate the new amount of a rent or allowance, the mathematical formula is quite straightforward. The mistake to avoid is simply subtracting the indices; what you need is a percentage change.
The correct formula to use is: ((Current Month Index / Same Month Index from the Previous Year) - 1) * 100.
The result of this calculation is the exact percentage change, which you will then apply to the amount you need to revalue.
This concept map effectively summarizes the key concepts of the FOI index, clarifying the difference between month-over-month (short-term) changes and year-over-year (long-term) changes.
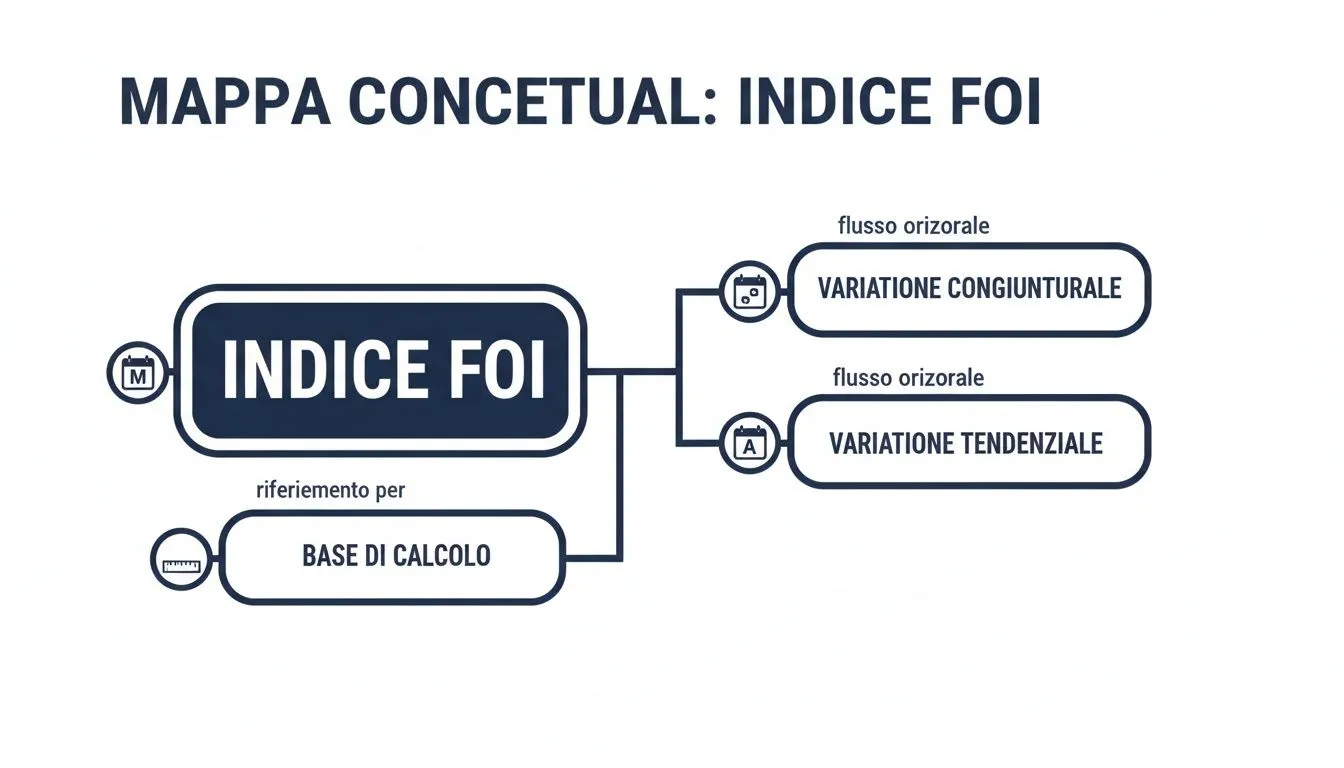
As you can see from the chart, it is precisely the year-over-year change that is crucial for the annual update, because it captures the trend in inflation over a 12-month period.
Suppose we need to adjust a €600 monthly rent in May 2025 . As is often the case, the lease specifies an adjustment equal to 75% of the ISTAT change.
((121.3 / 119.3) - 1) * 100 = 1.676%.75% of 1.676%, which makes 1,257%. This is the revaluation rate you should actually use.€600 * 1.257% = €7.54. The new fee will therefore be €600 + €7.54 = €607.54.As you can see, the process is logical and easy to follow. The most common mistake is calculating the simple difference between the indices, an error that leads to a completely inaccurate result.
The use of partial percentages, such as 75%, is standard practice for rent-controlled leases. For market-rate leases, however, the full 100% of the increase is typically applied. The first thing you should always do is check what your lease actually says in writing.
The mechanism for child support is virtually identical. The main difference is that, as a rule, 100% of the ISTAT adjustment is applied. The aim is to fully preserve the recipient’s purchasing power, without any reductions.
Let’s take a check for €400 to be adjusted annually using the same ISTAT inflation rate as in the previous example (1.676%). The calculation is even simpler:
€400 * 1.676% = €6.70.€400 + €6.70 = €406.70.Following these steps carefully will help you avoid mistakes and potential disputes. To make the process even faster and more error-proof, there are reliable online calculators or analysis platforms such as ELECTE that can automate the entire process.
When it comes to calculating contractual adjustments or conducting economic analyses, there is only one golden rule: always start with the official source. Forthe historical FOI index, there is only one such source:ISTAT, the National Institute of Statistics.
Relying on data from unverified websites is a losing proposition from the start. You risk calculation errors, legal disputes, and, in the worst-case scenario, strategic decisions based on incorrect information. Let’s take a look at how you can obtain data directly from the source, safely and reliably.
The go-to resource for anyone looking for statistical data in Italy is the I.Stat portal, the official database where the institute stores all its surveys, including the complete historical series of the FOI index. Navigating the site may seem a bit tricky at first, but if you follow the right steps, you’ll get right to the point.
This is the screen you'll see: the starting point for your search.
From here, by navigating the menu on the left, you can explore the different topic areas and find exactly the historical seriesof the FOI index you need.
Once you’ve found the table with the historical data, the I.Stat portal gives you full control. You can filter the time period you’re interested in, choose between the general index or a specific expenditure category, and, most importantly, decide which file format to download.
When working with this data, the best choice is almost always the CSV (Comma-Separated Values) format. It’s a universal, lightweight format that’s compatible with virtually any tool—from spreadsheets like Excel or Google Sheets to more structured data analytics platforms such as ELECTE.
Choosing CSV ensures maximum flexibility. If you're not very familiar with it, we've put together a practical guide on how to work with CSV files in Excel to help you prepare your data effectively.
The ultimate goal is simple: to transform ISTAT’s raw data into a clean, organized dataset, ready to be analyzed and used to extract valuable insights.
Once you have the historical datafor the FOI index—downloaded from official sources—a world of possibilities opens up that goes far beyond simply adjusting a contract. That inflation data is a strategic goldmine. To capitalize on it, however, SMEs need tools capable of turning numbers into concrete decisions.
This is where AI-powered data analytics platforms come into play, such as ELECTE. These systems allow you to move beyond the limitations of a spreadsheet and shift from reactive cost management to a strategy that truly looks to the future.

The dashboard in the image above is a perfect example of how AI visualizes trends, making complex data—such as historical inflation trends—immediately understandable. In an instant, you can correlate FOI trends with your operating costs and revenue, identifying hidden risks and opportunities at a glance.
The first step is to upload your data to the platform. With a tool like ELECTE, importing the CSV file you downloaded from ISTAT takes just one click. The platform automatically recognizes the data structure and prepares it for analysis, without you having to do a thing.
That's when artificial intelligence starts working for you. Instead of manually calculating the variations, the system is able to:
The real game-changer? Data analysis is now accessible to everyone. You no longer need a team of data scientists to gain high-level insights. An SME can independently predict the impact of inflation on future costs and proactively adjust its pricing to protect its profitability.
Imagine you run a retail business. By importinghistorical FOI data into ELECTE linking it to your suppliers’ purchase cost data, the platform could reveal something very specific. For example, that a1% rise in inflation translates, after three months, into a 2.5% increase in your raw material costs.
With this forecast in hand, you can take proactive steps. You might decide to renegotiate a fixed-price supply contract before the price increase takes effect, or plan a strategic adjustment to retail prices to absorb the impact without hurting sales volumes.
This approach turns a regulatory requirement into a powerful competitive advantage. The goal is to stop "suffering" from inflation and start "managing" it intelligently, optimizing margins and making the business more robust.
For too many companies,the historical FOI index is merely a figure used to adjust rents—a bureaucratic formality. This is a mistake that can prove costly. For the most forward-thinking SMEs, this data serves as a true strategic compass for navigating market turbulence and safeguarding profitability.
Understanding inflation trends allows you to move away from a reactive approach—always playing catch-up—and adopt a proactive strategy. This is a crucial step if you want to make decisions based on data rather than instinct, especially when the economic outlook is uncertain.
Analyzinghistorical FOI data delivers immediate, tangible benefits in the most critical areas of your business. We’re not talking about economic theories, but practical applications you can implement right away to protect your margins and reduce risks.
This is the essence of Business Intelligence: it’s not just about looking at past data, but using it to shape the future. It means transforming a generic economic indicator into a specific competitive advantage tailored to your industry and business model.
The ultimate goal is to incorporate inflation analysis into your day-to-day decision-making process. When evaluating a new investment, launching a product, or planning a marketing campaign, the potential impact of inflation must become one of the key variables to consider. Using a modern business intelligence such as ELECTE also makes this type of analysis accessible even without a team of data scientists, democratizing insights that were once the privilege of large corporations.
Even after reviewing the calculations and analysis, it’s normal to still have some questionsabout the historical FOI index. Here are the answers to the most common questions to help you use this tool with confidence.
The confusion is understandable. Although both measure inflation, they serve different purposes.
In short, the FOI helps ensure that your contracts balance out. The NIC is the barometer that measures the health of the country's economy.
Timeliness is everything here. Fortunately, ISTAT follows a precise and reliable schedule.
The update is released monthly. Generally, ISTAT publishes the official figure around the middle of the month following the reference month. For example, the April data is typically released around mid-May.
The short answer is: almost never. For lease agreements, Italian law designates the FOI index as the sole standard benchmark for rent adjustments. As a general rule, it cannot be replaced with other indices such as the NIC or the IPCA.
Of course, the parties are free to agree otherwise in the contract by specifying alternative mechanisms, but such a clause must be clear and mutually agreed upon. In the absence of specific agreements,the historical FOI index remains the only legally valid benchmark.
This happens periodically and is no cause for alarm. ISTAT updates the base year (e.g., from 2015=100 to 2025=100) to ensure that the basket of goods reflects current consumption patterns.
To ensure that historical analyses are not interrupted, ISTAT always publishes adjustment factors. These are simple multipliers that allow older time series to be "linked" to the new base. In this way, continuity is ensured, and comparisons over long periods remain accurate.
In this guide, we’ve seen thatthe historical FOI index is much more than just a figure used for contract adjustments. It’s a powerful business intelligence tool that, when analyzed correctly, allows you to forecast costs, develop smart pricing strategies, and negotiate from a position of strength.
You’ve learned how to distinguish between ISTAT indices, calculate revaluations without errors, and find official data. But the real leap forward comes when you use AI-powered platforms like ELECTE turn historical data into accurate forecasts. Moving from reactive to proactive management is no longer a luxury reserved for large corporations, but a real possibility for any SME that wants to grow.

.svg)
.svg)
.svg)