Have you ever looked at your sales data and noticed a figure that’s way off the charts? Maybe your daily sales usually hover between 100 and 150 units, but one day, out of nowhere, you record 1,500 sales. Well, you’ve just found a statistical outlier.
These outliers aren’t just typos to be deleted. They’re data points that tell a story. Ignoring them can lead you to make decisions based on a distorted reality, while analyzing them can reveal hidden problems or unexpected opportunities. Understanding how to correctly identify and handle outliers in statistics is essential for any small or medium-sized business that wants to base its growth on reliable data.
In this guide, we’ll show you exactly what outliers are, why they’re so important for your business, and how you can manage them strategically. You’ll learn to distinguish between a simple error and valuable insight, turning every anomaly from a problem into a competitive advantage.
An outlier isn’t just a strange number in a spreadsheet. It’s a data point that deviates significantly from the rest of your dataset. Understanding its origin is the first, crucial step in building a data analysis you can trust, because these exceptional points can have very different causes and, as a result, require specific handling.
An outlier can be either a problem to solve or an opportunity to seize. The key is to quickly understand its nature so you can take the right action.
Ignoring this data is risky. A superficial approach to managing this data can lead to inaccurate sales forecasts, incorrect inventory estimates, or a distorted assessment of your team’s performance. Including a single day of exceptional sales in the average, for example, can inflate expectations for the coming months, creating inventory and planning issues.
An outlier isn’t an enemy to be eliminated at all costs, but a messenger to be questioned. It can reveal flaws in your data collection processes or uncover growth opportunities that would otherwise remain hidden.
In the Italian context, proper outlier management has become a priority for SMEs. With the Big Data and Analytics market projected to reach €4.1 billion by 2025, the ability to maintain data integrity is a decisive competitive advantage. Outliers, in fact, can distort key metrics such as the mean and standard deviation, skewing the results of any analysis. You can explore this topic further by reading additional research on data management.
AI-powered platforms like ELECTE automate the identification of these outliers, turning a complex task into a quick and easy process. Before you continue, you might find our guide on how to create a chart in Excel helpful for getting started with visualizing your data.
Once you understand what an outlier is in statistics and why it’s so important, the next question is: how do I find it in my data? Fortunately, you have a wide range of tools at your disposal, from classic statistical methods to much more sophisticated machine learning techniques.
The choice depends on the nature of your data and the complexity of the problem. For a simple dataset, traditional methods are often more than sufficient. But when the analysis becomes more complex, artificial intelligence becomes a valuable ally.
This infographic effectively summarizes the process: a single data point deviates, becomes an outlier, and ends up influencing the entire dataset.
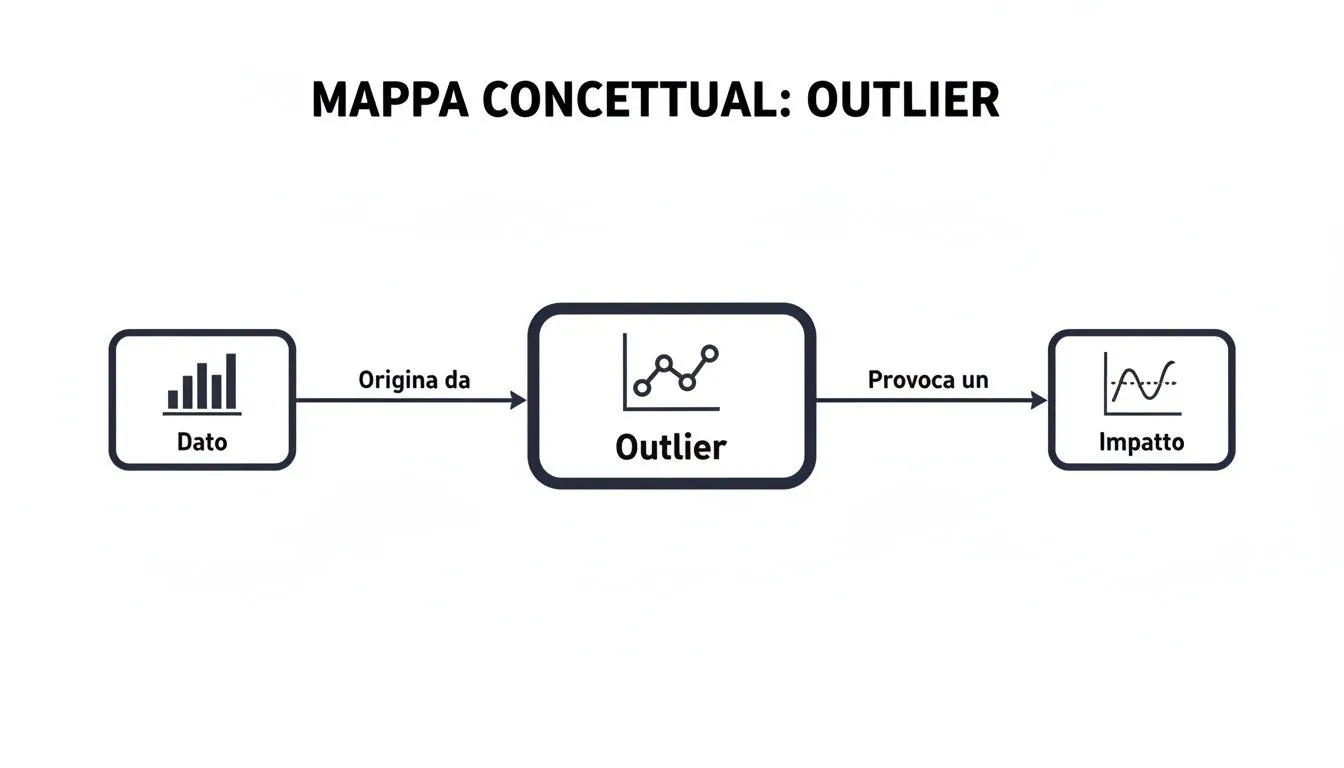
As you can see, it all starts with a piece of data whose deviation creates an anomaly, ultimately distorting your overall view.
These are the natural starting point for your outlier analysis. They are tried-and-true methods that are easy to understand and quick to implement, especially when working with one or a few variables (univariate or bivariate analysis).
And what happens when the data becomes a tangled web of dozens or hundreds of variables (multivariate analysis)? That’s when traditional methods reach their limits. This is where machine learning comes into play, uncovering anomalous patterns that the human eye (and a simple statistical method) would never detect.
As data becomes more complex, machine learning is no longer an option but a necessity for truly reliable outlier detection.
Algorithms such as DBSCAN or Isolation Forest do not examine a single value at a time, but analyze the hidden relationships among multiple variables simultaneously.
Choosing the right technique is a crucial step in conducting an analysis that yields concrete results—a concept we explore in depth in our article on howpredictive analytics transforms data into winning decisions.
To further clarify the differences, here is a table comparing the two approaches. It will help you quickly determine which tool might be right for you, depending on the context.
Statistical methods (such as Z-scores and IQRs) are relatively simple and are ideal for univariate or bivariate data with known distributions. Their main advantage is their simplicity: they are easy to implement and interpret, and quick to apply. Their main limitation is their ineffectiveness when dealing with multidimensional data and their sensitivity to the shape of the data distribution.
Machine learning methods (such as DBSCAN and Isolation Forest) have medium to high complexity and are designed for multivariate, complex, and large-scale datasets. Their strength lies in their ability to detect complex and nonlinear patterns, with good robustness and scalability. On the other hand, they require a higher level of technical expertise, and interpreting the results can be less straightforward.
In short, there is no single "best" method. The right choice always depends on the objective of your analysis and the structure of the data you have available.
You've found an outlier in your data. Now what? The instinctive reaction is almost always the same: remove it. Yet this is rarely the best choice. Acting too hastily can cause you to lose valuable information or, worse, invalidate the entire analysis. The right strategy, in fact, depends entirely on why that outlier is there.
Before you do anything, ask yourself a fundamental question: where did this outlier come from? The answer to this question will determine the course of action you should take. There is no one-size-fits-all solution, but rather a reasoned approach that safeguards the integrity of your data.
Deleting data is an extreme measure that should be reserved exclusively for cases where you are absolutely certain that an error has occurred. If a customer has entered "150" in the age field or if you see a negative price where there shouldn't be one, you are looking at a clear data entry error. In scenarios like these, deletion is not only justified—it is necessary to prevent the dataset from becoming corrupted.
But be careful: removing an outlier that represents a real event—however rare—is a serious mistake. That data point could indicate a fraudulent transaction, a sales spike caused by an unexpected event, or the behavior of a "power user." Deleting it would mean turning a blind eye to a reality that your business should instead analyze carefully.
When an outlier isn’t an error but an extreme value that skews your metrics (such as the mean), there are far more sophisticated techniques available than simply removing it. These methods allow you to mitigate the impact of the outlier without discarding the information it contains.
Here are three effective strategies:
Approaches to handling outliers in statistics have evolved significantly. Techniques such as windsorization offer a practical alternative to exclusion, while the use of robust statistical methods based on the median makes it possible to reduce the influence of outliers without having to remove them. For more information, you can consult these case studies in the field of data science directly from Istat.
Choosing a strategy is not merely a technical decision, but a strategic one. The goal is to obtain an analysis that is both accurate and representative of the reality of your business, with all its unique characteristics.
Theory alone isn't enough. In statistics, an outlier isn't just an anomalous data point on a graph; it's a potential threat to be defused or a hidden opportunity to be seized. Looking at how other companies have interpreted these signals makes the concept immediately clearer and more applicable.
Let’s take a look at three real-world scenarios that show how an anomaly, when interpreted correctly, can become a strategic lever for growth, efficiency, and security.

In the financial world, speed is everything. A glitch can cost millions in a matter of minutes.
When detecting fraud, an outlier is not a data point to be "corrected," but a warning sign to be heeded. Identifying it promptly is the first line of defense against financial losses.
In retail, an unexpected sales spike can be a golden opportunity or a managerial nightmare. It all depends on how you interpret it.
Sometimes, an exceptionally positive outlier holds the key to improving the entire team’s performance.
These examples show that managing outliers in statistics goes far beyond simple "data cleaning." It is a strategic activity that, when supported by the right tools, allows you to reduce risks, seize market opportunities, and replicate successes.
Manually handling outliers is a slow, complex process with a high risk of error. Looking for an outlier in a spreadsheet full of rows is like looking for a needle in a haystack: a task that consumes valuable time your team could be spending on strategic activities.
This is where ELECTE, an AI-powered data analytics platform, completely changes the game. Our platform is designed to turn this process into a tool that’s accessible to your entire team. Instead of spending hours on manual analysis, you can go from raw data to informed decisions in just a few minutes.

With ELECTE, the process is incredibly straightforward. The platform securely connects to all your data sources, whether it’s your CRM, business management software, or simple Excel files. Once the data is connected, ELECTE's AI engine kicks into action.
The platform initiates an automatic scan using a combination of advanced statistical and machine learning algorithms designed to detect any potential anomalies. It doesn’t just identify extreme values; it analyzes the relationships between multiple variables to uncover even the most hidden outliers—those that would always go unnoticed to the naked eye. The results are presented to you in interactive, easy-to-interpret dashboards, allowing you to see each outlier in context and decide immediately how to proceed.
The real value lies not just in identifying the outlier, but in understanding what it means for your business. ELECTE turns an outlier into a starting point for strategic decision-making.
ELECTE provides you with powerful tools to manage issues proactively rather than reactively.
The goal is simple: free up your resources from manual analysis and allow your team to focus on what really matters—making better decisions based on data you can trust. You can learn more about how AI supports decision-making by reading our articleon using ELECTE predictive features.
What ifthat statistical outlier you just spotted isn't an error to be corrected, but the key to your next big insight? Anomalies in data aren't just noise; they're often faint signals that foreshadow major changes.
A spike in negative customer reviews could reveal an unmet market need. An anomaly in your app’s usage data could point to a new feature your users want. Instead of rushing to normalize this data, the real value lies in examining it with curiosity. The right question to ask isn’t “How do I fix this?”, but “Why did this happen?”.
Adopting a detective’s mindset transforms every outlier into a potential goldmine for innovation. This approach has even revolutionized medical research. In the Italian oncology sector, for example, outlier patients have become key allies. One emblematic case involved a patient with approximately 17,000 genetic mutations, a statistical anomaly that garnered international attention, demonstrating how analyzing these extreme cases can pave the way for personalized therapies. You can learn more about how outliers help in the fight against cancer.
This principle is incredibly powerful in your business as well. Every anomaly is an invitation to look at your business from a completely new perspective.
Treating an outlier as an opportunity means fostering a data-driven culture where every piece of data—even the strangest—is a chance to learn and innovate.
Here are 3 practical steps for turning an outlier into an insight:
This approach transforms a simple statistical outlier from a question mark into a starting point for a winning strategy.
At this point, it’s normal to still have some questions. Here are straightforward answers to the most common questions about outliers.
Imagine you’re analyzing the delivery times for your e-commerce business. Most orders arrive in 2–3 days. Then you come across one that took 20 days. That’s an outlier: a value so different from the others that it warrants your attention. It’s not necessarily a mistake, but it’s an exception that needs to be investigated.
Absolutely not. In fact, that’s often a mistake. Only delete a data point if you’re 100% certain it’s the result of an input error. In all other cases, an outlier is a valuable signal. It could indicate a sales spike, a logistics issue, or unusual (but genuine) customer behavior. Ignoring it means missing out on crucial information.
There’s no magic solution. The choice depends on the complexity of your data.
On the contrary, it’s often a golden opportunity. A positive outlier—such as a salesperson with record-breaking performance or a marketing campaign with an off-the-charts ROI—isn’t a problem to “fix.” It’s a success story worth analyzing. Understanding why that data is so exceptional gives you the key to replicating that winning strategy on a large scale.
Turn every setback into an opportunity for growth. With ELECTE, you can automate outlier analysis and gain decisive insights in just a few minutes.

.svg)
.svg)
.svg)