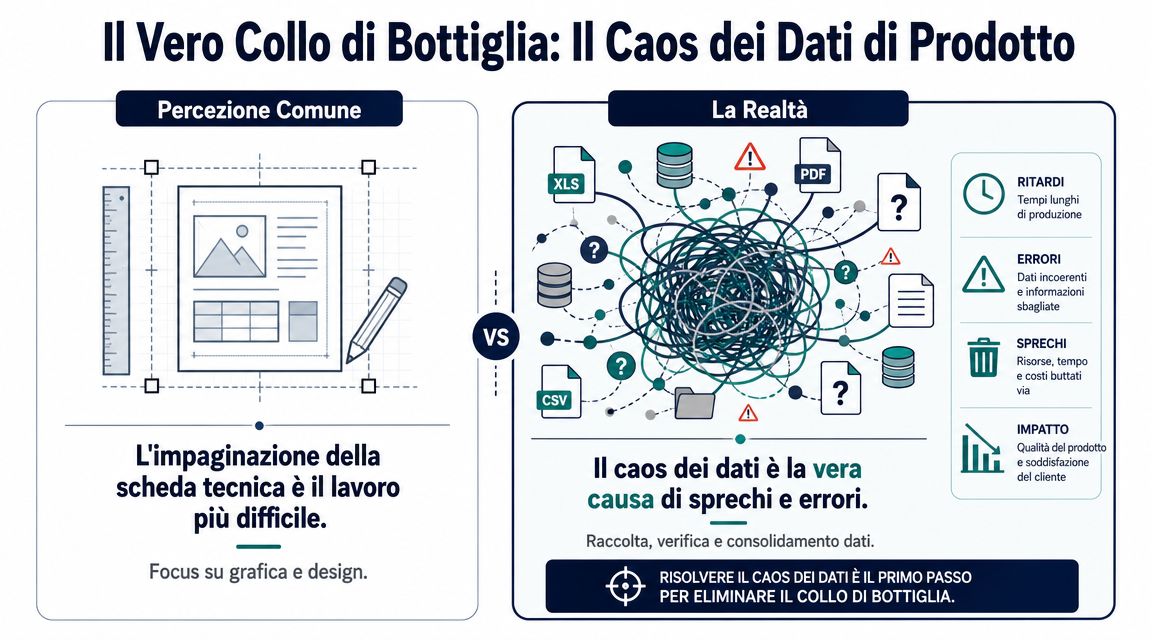
You create a new product sheet, open the product manager’s Excel file, then the export from the ERP system, and then the CRM. The weight doesn’t match. The technical description is up to date in a shared folder, but the logistics information is still based on a previous version. Meanwhile, sales, quality, and operations are all asking you the same thing: “Which figure is correct?”
For many companies, the problem with product data sheets doesn’t arise when the document is actually written. It begins much earlier, when no one is really sure which field is reliable. That’s where errors, delays, endless revisions, and duplicate versions pile up.
Italian guidelines treat technical data sheets as serious documents, not as brochures. They must present the product in a clear, standardized, and comparable manner throughout its life cycle, including measurable data, design specifications, certifications, instructions for use, and maintenance information, as noted in the Italian guide to product technical data sheets.
The good news is that this problem can be addressed in a practical way. Not by starting with the template, but by focusing on the quality of the data that feeds the template.
The typical scenario is simple. The technical department updates a measurement in the management system. The marketing department continues to use an old Excel spreadsheet. The sales department copies the data from a PDF presentation. Eventually, the data sheet is released, but no one would be able to explain every single field to a customer, a distributor, or an internal auditor.

This happens because many companies treat the technical data sheet as a form to be filled out, rather than as the final output of a data governance process. When data is generated incorrectly, it circulates even worse. And when it circulates worse, the data sheet becomes merely the point where the error becomes visible.
The same pattern can also be seen outside the manufacturing sector. In any context where authenticity, traceability, and attention to detail make all the difference, value lies in the quality of the information and the ability to interpret it correctly. A useful example—albeit in a different field—is this expert guide on counterfeit Rolex watches, which shows just how much technical detail really matters when you need to distinguish between reliable information and a convincing appearance.
Rule of thumb: If you have to compare multiple files, departments, and versions to complete a form, the problem isn't the document. It's the data architecture.
Product data sheets can only be filled out quickly when there is a clear "source of truth" in place. As long as that foundation is missing, every new data sheet is a small manual reconciliation project.
A technical data sheet is truly effective when it can answer a simple question: Where does this data come from, who validated it, and when was it updated?
This is where many companies get their priorities wrong. They focus on the template, the order of the fields, and the final PDF. Then, at the first serious review, inconsistencies emerge: codes that don’t match, weights copied from old versions, certifications cited without a link to the correct document, and descriptions that vary from department to department. The quality of the data sheet depends first on data discipline, and then on the format in which you present it.
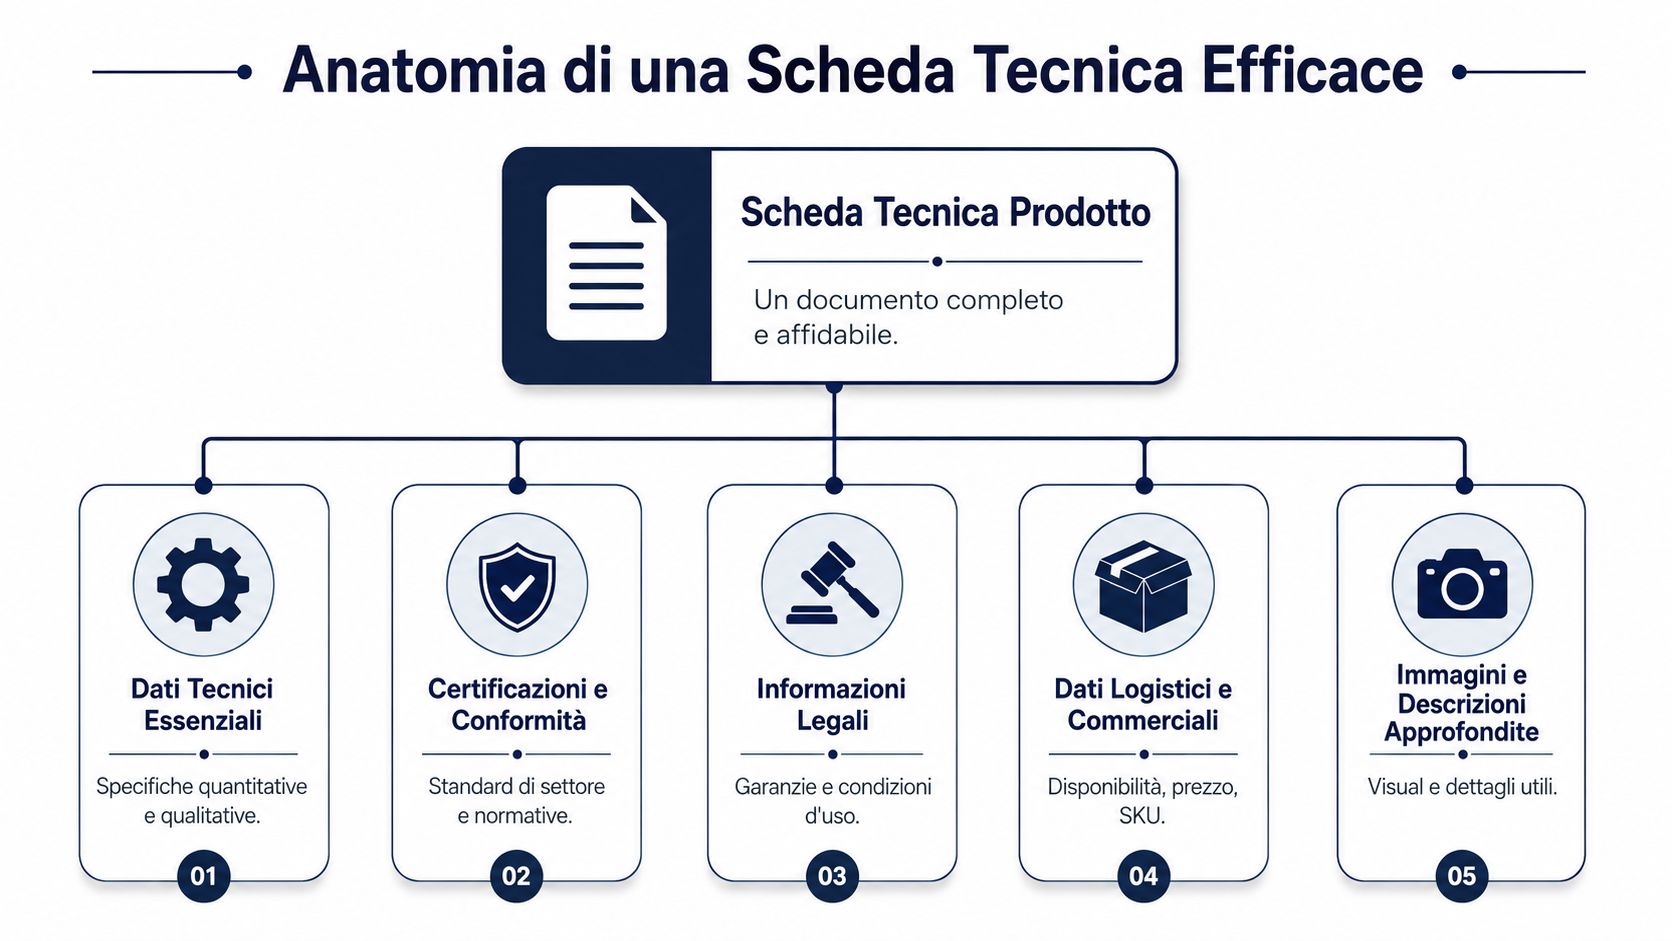
A useful structure starts with fields that have a clear owner and a unique definition. In practice, these blocks are the ones you almost always need:
The common mistake isn’t forgetting a field. It’s mixing static data and frequently changing data in the same field, or using generic labels for information that means different things within the company. “Weight,” on its own, isn’t enough. You need to know whether you’re referring to net weight, gross weight, or shipping weight. The same applies to “dimensions,” “capacity,” “compatibility,” and any certification listed without context.
For this reason, it is advisable to define the field dictionary and the acceptable sources early on, especially if the data comes from ERP, CRM, PLM, or distributed repositories. A well-managed database, fed by linked and verifiable product sources, reduces errors even before the data entry phase.
Even a well-organized record can still be unreliable. This often happens in situations where the document is updated manually and no one checks for consistency across systems.
| Signal | Why does it cause problems? |
|---|---|
| Field with no update date | The team doesn't know if the data is still valid |
| Technical data written in free-form | Comparing products becomes a slow and confusing process |
| Certifications mentioned but not linked to the documents | Quality and Compliance must perform manual checks |
| General Descriptions | Sales, purchasing, and distributors interpret the content differently |
| No distinction between static data and variable data | The circuit board is aging rapidly, and no one knows what needs to be overhauled |
The structure varies from sector to sector. In fashion, it includes variations, sizes, materials, manufacturing processes, and production notes. In the food industry, it requires ingredients, allergens, shelf life, and regulatory references. In technical retail, compatibility, dimensions, logistics data, and display constraints are key factors. The principle remains the same: if the source data isn’t clearly defined and verified, the product sheet will simply present a jumble of information.
A reliable technical data sheet contains information that is verifiable, traceable, and consistent across departments.
Those who create truly useful forms follow a specific order: they define the fields, assign responsibility for the data, establish validation rules, and only then decide on the layout. In this way, the form ceases to be a document filled out at the last minute and becomes the consistent output of a reliable process.
When a team says that “creating worksheets takes too much time,” they’re almost never talking about the layout. They’re talking about the hunt for the right data. It’s a huge difference, because it completely changes the type of solution that needs to be adopted.
In a real-world example shared by the ELECTE team, a client with a catalog of 340 product listings spent an average of 45 minutes per product sheet just to gather up-to-date data from various sources. With the data already standardized and analyzed, that same process was reduced to less than 10 minutes. The point isn’t that the document writes itself. The point is that you stop wasting time checking whether your ERP, CRM, and local files contradict each other.
The most common breakdowns are very specific:
If your teams currently gather information from multiple sources before filling out a form, the priority isn’t to redesign the template. The priority is to clarify the sources of the data and consolidate them. A good place to start is to build a single view of the sources, as in an integrated data-source-oriented approach for the business.
When trust is lacking, the workload doubles. The product manager double-checks everything. Marketing asks for confirmation. Sales waits. The quality control department halts the release. No one says outright, “We don’t trust the system,” but the process makes that clear at every step.
If three departments validate the same field at different times, the problem isn't quality control. It's that the data isn't governed.
The consequences go beyond product data sheets. This same disorganization slows down price lists, catalogs, distributor data sheets, e-commerce documentation, and performance analyses. That’s why the data sheet is an excellent indicator. If creating one is a struggle, your product data assets are almost certainly already in trouble.
A buyer opens a product sheet and finds that the weight, dimensions, and material are correct. Then, when they check the ERP system, they see a delivery time that differs from the one shared with the sales team. At that point, the product sheet ceases to be an operational tool and becomes a document that needs to be verified.

In retail, a product spec sheet is useful if it helps with decision-making. It’s not enough to simply describe the product. It must also reflect the actual conditions under which that product is sold, returned, restocked, and compared with other options in the catalog.
That’s why the most useful fields aren’t always the most “technical” ones in the strict sense. Often, information such as the following makes all the difference:
I often see the same mistake here. The team enhances the template but continues to pull data from different sources, each with its own set of rules. The result is a report that is only seemingly more comprehensive. If turnover, inventory, and profit margins aren’t aligned, the document sparks discussions instead of resolving them.
Those who work on product assortment, distribution, and sell-through need to analyze product data and performance data within the same operational context. This need is clearly evident in use cases related to retail and distribution.
The structure of product pages also varies greatly across different verticals. In fashion, factors such as variations, sizes, materials, production notes, and visual references come into play. In the food industry, ingredients, allergens, nutritional values, and regulatory requirements are key considerations. The bottom line, however, remains the same: the more specialized the content becomes, the more expensive it is to manage without a well-organized and governed database.
In the financial sector, the product itself isn't touched, but the problem is the same. An information sheet, an internal KIID, or support material for the sales force is only useful if it contains data that is consistent across analysis, compliance, and client-facing documentation.
The typical error isn't a poorly compiled measurement. It's a risk assessment that has been updated in the system but remains outdated in the document used by those who sell to or assist the customer.
The consequences differ from those in the retail sector. In retail, inconsistent data slows down orders, restocking, or negotiations. In the financial sector, it raises issues of governance, control, and accountability.
For this reason, in regulated contexts, the quality of the entry depends first on the data standards and only secondarily on the document’s format. If the source is reliable, the entry is updated with less difficulty. If the source is unreliable, even the most carefully prepared PDF remains unreliable.
The limitation of PDF isn't the format itself. The limitation lies in using it as the final container for data that no one has really structured properly. When a technical data sheet relies on copy-and-paste, attachments, and manual revisions, every update creates a new point of failure.
A very practical question that has emerged in Italian technical documentation is this: How can a technical data sheet be transformed from a static PDF into an automated, up-to-date compliance check? This issue is critical because companies manage multiple document versions, and the predominant approach remains static—not based on structured data—with implications for quality, safety, and legal liability, as highlighted in this article on the relationship between technical documentation and operational compliance.

Here, the shift in perspective is clear. ELECTE does not automatically generate the technical data sheet and does not replace the marketing team’s or engineering department’s document management tool. Its role is different—and, for many companies, more useful: it makes data available that has already been standardized, analyzed, and verified before anyone begins filling out the document.
The typical workflow is as follows:
When source data comes from unstructured documents, one of the preliminary steps is to convert the content into a format that can be analyzed. For those who frequently work with technical attachments and locked tables in unstructured documents, it is helpful to better understand the process of converting PDFs to Excel.
The biggest difference isn't aesthetic. It's operational.
First, here's how the team works:
| Phase | Manual Mode |
|---|---|
| Data Collection | Search Across Multiple Systems and Files |
| Consistency Check | Manual cross-departmental verification |
| Update | Unlinked versions |
| Filling Out the Form | Copy-and-paste and repeated confirmations |
Once you have a solid database, the work changes:
The real leap forward comes when the question shifts from “Who has the latest version?” to “Has the data already been validated?”
For those who manage many product data sheets, this step matters more than any layout automation. If the data is reliable, drafting the document is a straightforward process. If the data is questionable, even the best template will only produce a well-laid-out but fragile PDF.
Companies that truly improve their product data sheets don’t start with the font, the layout, or the software they use to export the PDF. They start with a much more challenging question: Which product fields are reliable, who updates them, and how do we validate them before they’re included in the document?
If your process currently requires constant checks, coordination between departments, and manual data reconstruction, you don’t need another template. You need a clearer data management framework. A technical data sheet works when it reflects a solid system in place upstream.
| Action | Key Benefit |
|---|---|
| Map all the sources that feed the data sheet | Find out where inconsistencies and duplications arise |
| Define an owner for each critical field | Reduce conflicts and uncontrolled updates |
| Separate static data from variable data | Avoid treating information that changes frequently as fixed |
| Standardize names, units of measurement, and versions | Make data comparable and reusable |
| Build a validation flow before the template | Speed up the drafting process and improve reliability |
A perfect technical data sheet isn't the one with the most fields. It's the one you can defend without hesitation, because every piece of information has a clear source, a shared logic, and a recognizable update history.
If you want to reduce the time spent searching for, verifying, and consolidating the data that ends up in your spreadsheets, ELECTE—an AI-powered data analytics platform for SMEs—helps you centralize various sources, normalize the information, and transform it into reliable insights ready for downstream processes. It doesn’t create the document for you. It empowers you to fill it out with clean, consistent, and up-to-date data. If you’d like to see how it works, you can explore the platform and learn how to bring more order to the decisions you make based on your product data.

.svg)
.svg)
.svg)