
A marketing manager at an Italian small-to-medium-sized enterprise (SME) needs to launch a promotion. In the CRM system, she can see her customers’ age, gender, and area of residence, but she doesn’t know who has visited a particular category multiple times, who has abandoned the checkout process, or who only makes a purchase when offered a discount. The database describes the people, but it doesn’t reveal what actually drives them to make a purchase.
This is the limitation of traditional segmentation. A one-size-fits-all message may reach many contacts but resonate with only a few. Behavioral segmentation shifts the perspective: it analyzes actions, frequency, recency, purchase value, and interactions across different channels, then transforms these signals into groups that can inform decision-making.
You don’t need to set up a data science team to get started. With data already available in your CRM, website, email, and e-commerce platforms—and with an AI-powered platform—you can move from static lists to actionable insights. Here’s a practical guide, featuring examples for retail, finance, and e-commerce, a focus on privacy, and a method for creating dynamic segments.
The manager of an online store knows the monthly revenue. They know which products are selling and perhaps how many customers live in a specific region. However, when it comes to deciding who to send a promotion to, they often use broad categories, such as “women in a certain age group” or “customers in Northern Italy.”
This information may be useful, but it doesn't explain the behavior. Two people from the same area may have opposite needs: one shops every month without waiting for discounts, while the other visits the website, compares prices, and only makes a purchase during a promotional campaign. Treating them the same way means ignoring important signals.
Behavioral segmentation pays close attention to these very signals. A repeat visit, a recent purchase, an abandoned shopping cart, or a response to a “ newsletter ” reveal where the customer is in the buying journey. Marketing can then adjust the content, channel, and timing, rather than relying solely on demographic data.

Rule of thumb: Before you ask yourself what message to send, ask yourself what action you want to understand from the customer.
For an SME, the first step can be simple: compare purchase history with digital interactions and identify groups that deserve to be treated differently. You can start with ELECTE’s customer insights to transform the available data into a clearer foundation for your work, without confusing the complexity of the analysis with the value of the information.
Behavioral segmentation divides the customer base into homogeneous groups based on what people do. Demographic segmentation answers the question “Who are they?”, using factors such as age, gender, or geographic area. Behavioral segmentation adds a question that is more useful for taking action: “How do they behave when they interact with the company?”
Variables may include:
The simplest analogy is that of a store owner. Knowing that a person lives near the store is informative, but remembering that they come in every week, always ask for the same product, and don’t take advantage of promotions allows you to serve them better. Behavioral data links observation to a decision.
In Italy, research on grocery customers has long relied on deciles of spending, purchase frequency, and purchase recency. This approach predates RFM models, which classify customers based on recency, frequency, and monetary value and help identify loyal customers, high-value customers, and those at risk of churn. A historical overview is available in the in-depth analysis on multichannel consumer behavior.
Descriptive classification groups together already known characteristics. Profiling, on the other hand, can use correlations and models to estimate future tendencies. The difference is important: a segment might say, “These customers have made a purchase recently,” while a model can help identify who is showing signs consistent with a new purchase.
Italian studies on segmentation highlight that recency and frequency may have greater predictive value than demographic characteristics alone, because they reflect needs that have already been expressed. This makes segmentation more useful for personalizing campaigns and business priorities, as discussed in the analysis of generational segmentation in digital marketing.
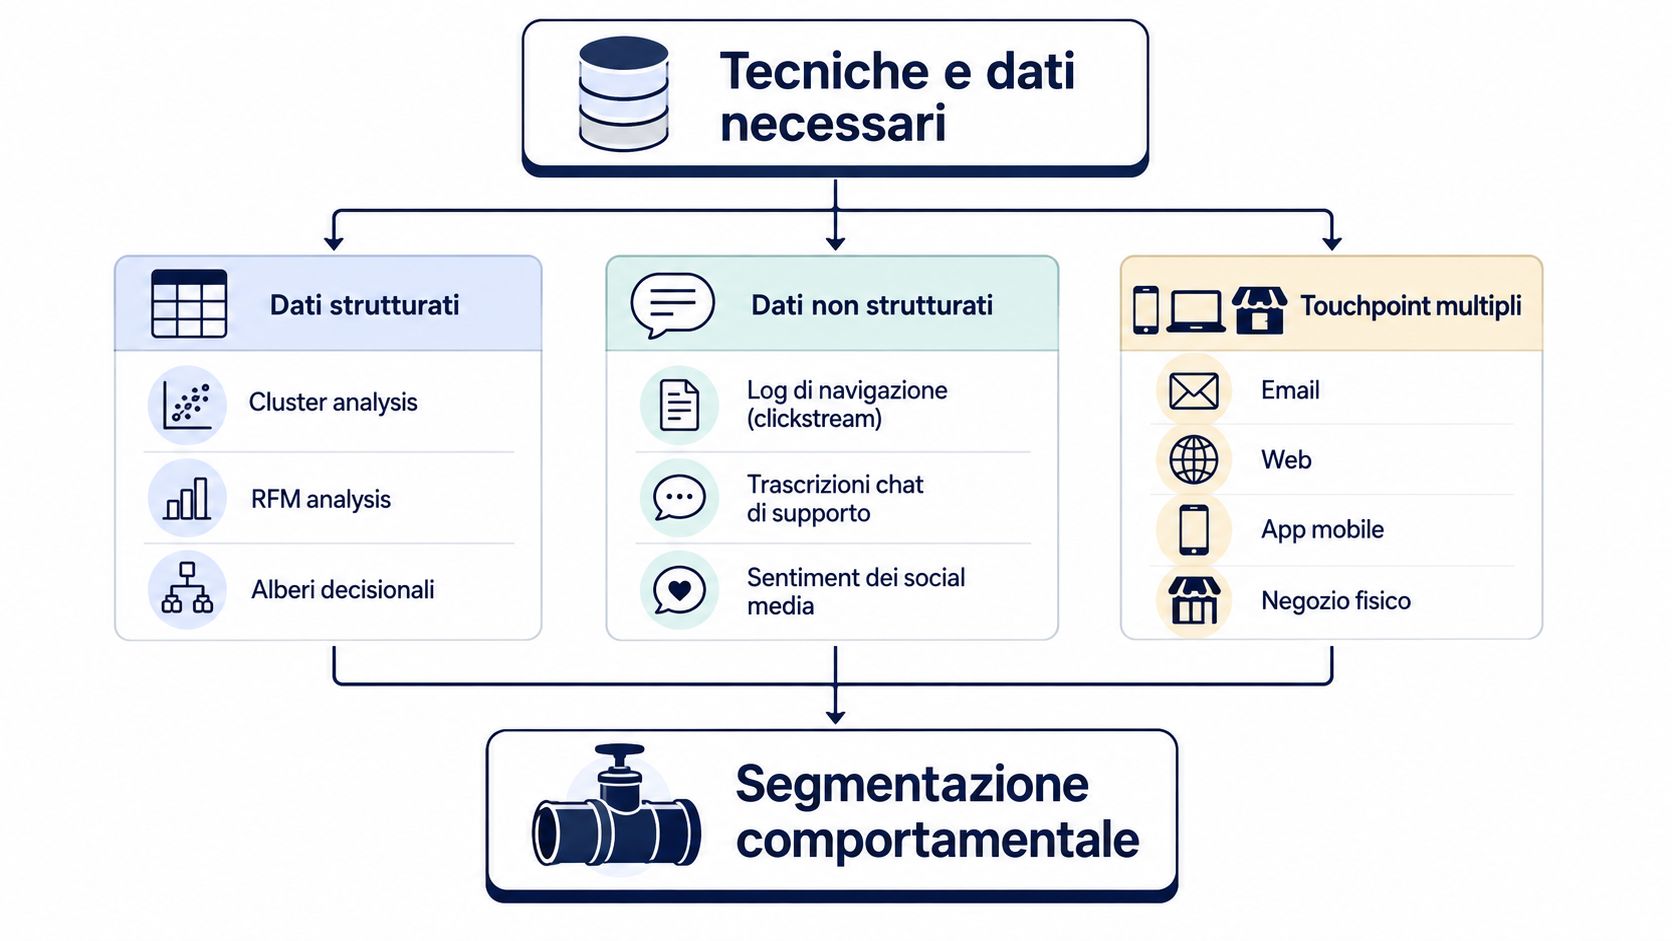
Effective segmentation results from the combination of structured data, digital events, and business context. It’s not enough to simply add a lot of information. You need to link actions to the same customer, define consistent events, and choose variables that can guide a campaign or a business decision.
Before creating clusters, clarify the result you want to achieve. “Getting to know customers better” is too vague. “Re-engaging customers who haven’t purchased in a while” or “suggesting accessories to customers who have purchased a main product” provides a concrete criterion for selecting data.
For an SME, an initial foundation may include:
The RFM model is often a good starting point because it breaks down historical data into three easy-to-understand questions: Who has made a recent purchase? Who buys frequently? Who generates the most value? Clustering can then combine these variables with preferred categories, responses to offers, or browsing behavior.
In 2020, there were 46.5 million Italian multichannel consumers, accounting for88% of the population aged 14 and older—which totaled 52.7 million people—representing a 6% increase from the previous year, according to CustomerMinding’s analysis of multichannel segmentation. The same study reveals differing payment preferences among behavioral profiles: PayPal was preferred by Digital Rooted and Digital Engaged consumers, both at 53%, while Digital Bouncers and Digital Rookies preferred prepaid cards, at 41% and 44%, respectively .
The value of this example does not lie in the payment itself. It shows that observable behavior can guide offers, channels, and messages more effectively than a generic demographic category.
A cluster should help someone do something. “Group 4” doesn’t mean anything to the marketing team. “Recent, frequent, and promotion-sensitive customers,” on the other hand, suggests a communication strategy and a metric to track.
Maintain a centralized database, define a consistent identifier, and check data quality before automating. The guide to business data analysis can help you integrate data collection, cleaning, and interpretation into a process that even non-technical teams can understand.
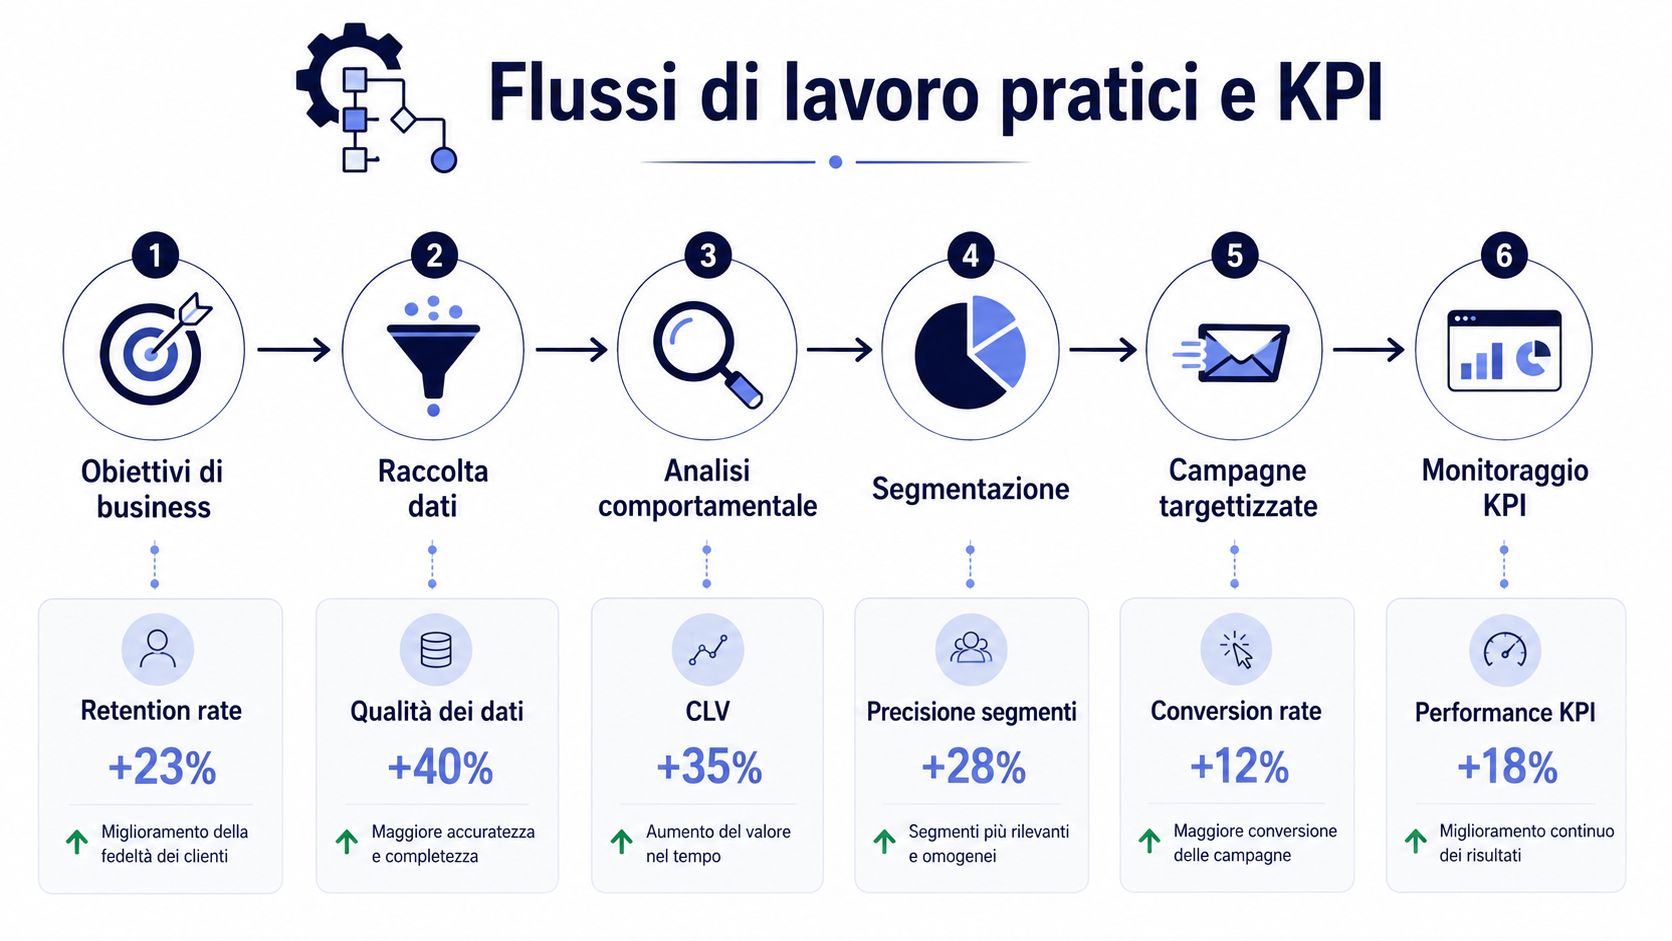
A segment is only useful when it triggers a workflow. The process can begin with a business objective, proceed through the selection of relevant events, and end with a campaign, a sales action, or a service decision.
Let's say an e-commerce site wants to reduce checkout abandonment. It doesn't need to categorize every possible behavior. It can focus on users who have viewed a product multiple times, added an item to their cart, and abandoned the purchase process before completing the transaction.
The segment becomes actionable if it contains:
Technical guides focused on the Italian market recommend combining RFM metrics with navigation events—such as repeat visits, click paths, email interactions, and checkout abandonment—to create granular yet measurable microsegments. The principle is simple: fewer decorative labels, more groups linked to a specific action.
The conversion rate indicates whether the segment is responding to the campaign. The purchase frequency helps determine whether the relationship is strengthening. Lifetime value, or LTV, links the economic value of the relationship to marketing decisions, while the churn rate signals a loss of engagement.
You can use these metrics alongside a segment-specific NPS, provided that the data is interpreted in conjunction with actual actions. A customer may express satisfaction but make purchases infrequently, or interact frequently without completing an order. Behavior does not replace feedback; it complements it.
Quality criterion: A KPI is useful when it influences a decision, not when it simply fills up a dashboard.
Dynamic segmentation updates the group when behavior changes. A customer who completes a purchase is removed from the "abandoners" segment. A regular customer who stops visiting may be placed on a reactivation path. To set up this process and select appropriate metrics, you can consult ELECTE for business analytics KPIs.
The same logic takes on different forms depending on the industry. A supermarket tracks shopping frequency and spend. A financial services company monitors service usage and risk indicators. An e-commerce business tracks the customer journey from search to product selection, shopping cart, and payment.
In the Italian retail sector, segmentation based on spending deciles and on the variables of purchase frequency and recency represents a historical foundation of the RFM approach, as documented in research on grocery customers. A retail location can therefore distinguish between high-value customers, frequent customers with modest spending, occasional shoppers, and customers who have reduced their purchase frequency.
These groups do not necessarily require the same incentive. Regular customers may receive faster service or additional recommendations. Occasional customers may need a message related to the category they have already purchased. Customers who have reduced their purchase frequency first require a contextual analysis, not an automatic promotion.
Price is a sensitive factor. A family may choose a cheaper alternative because they are loyal to the store brand, or because their budget for that period is tighter. The observed behavior alone does not explain the reason.
In the financial sector, behavioral clusters can describe how customers use services: frequency of access, types of transactions, preferred channels, and changes in usage patterns. These signals can support the personalization of offerings, priority management, and the monitoring of compliance processes.
However, the analysis must remain separate from high-impact automated decisions that are not adequately governed. A model may flag a change that needs to be verified, but it should not be treated as a complete explanation of customer behavior. For financial, credit, or compliance activities, human oversight, documentation, and specific legal assessments are required. This content does not constitute financial advice or a compliance opinion.
A conservative workflow might follow this sequence:
An online store can segment users based on where they drop off in the customer journey. Someone who views a product page multiple times has a different interest than someone who reaches the checkout page and abandons the purchase at the last step. Even someone who opens an email without clicking on anything signals a different need than someone who clicks, compares multiple products, and returns to the site.
The campaign should reflect this difference. An informative message can help those who are still considering their options. A reminder may be appropriate for those who have abandoned the checkout process. A follow-up suggestion can be useful for those who have already completed their purchase. The goal is not to send more communications, but to bridge the gap between behavior and content.
Research on Italian households reveals differences between stated intentions and observed behaviors. There are consistent groups and more contradictory groups; therefore, what a person says they prefer does not always match what they actually buy.
By mid-2024,85% of low-income Italian consumers had already “traded down,” choosing more affordable alternatives, according to Statista data cited in the research available inthe University of Parma’s archive. This does not automatically indicate lower brand loyalty. It may point to a temporary budget constraint.
For this reason, retail and e-commerce should take into account behavior, price, category, channel, and context. A segment that confuses price sensitivity with actual preference can lead to misguided campaigns and unfair conclusions about the customer.
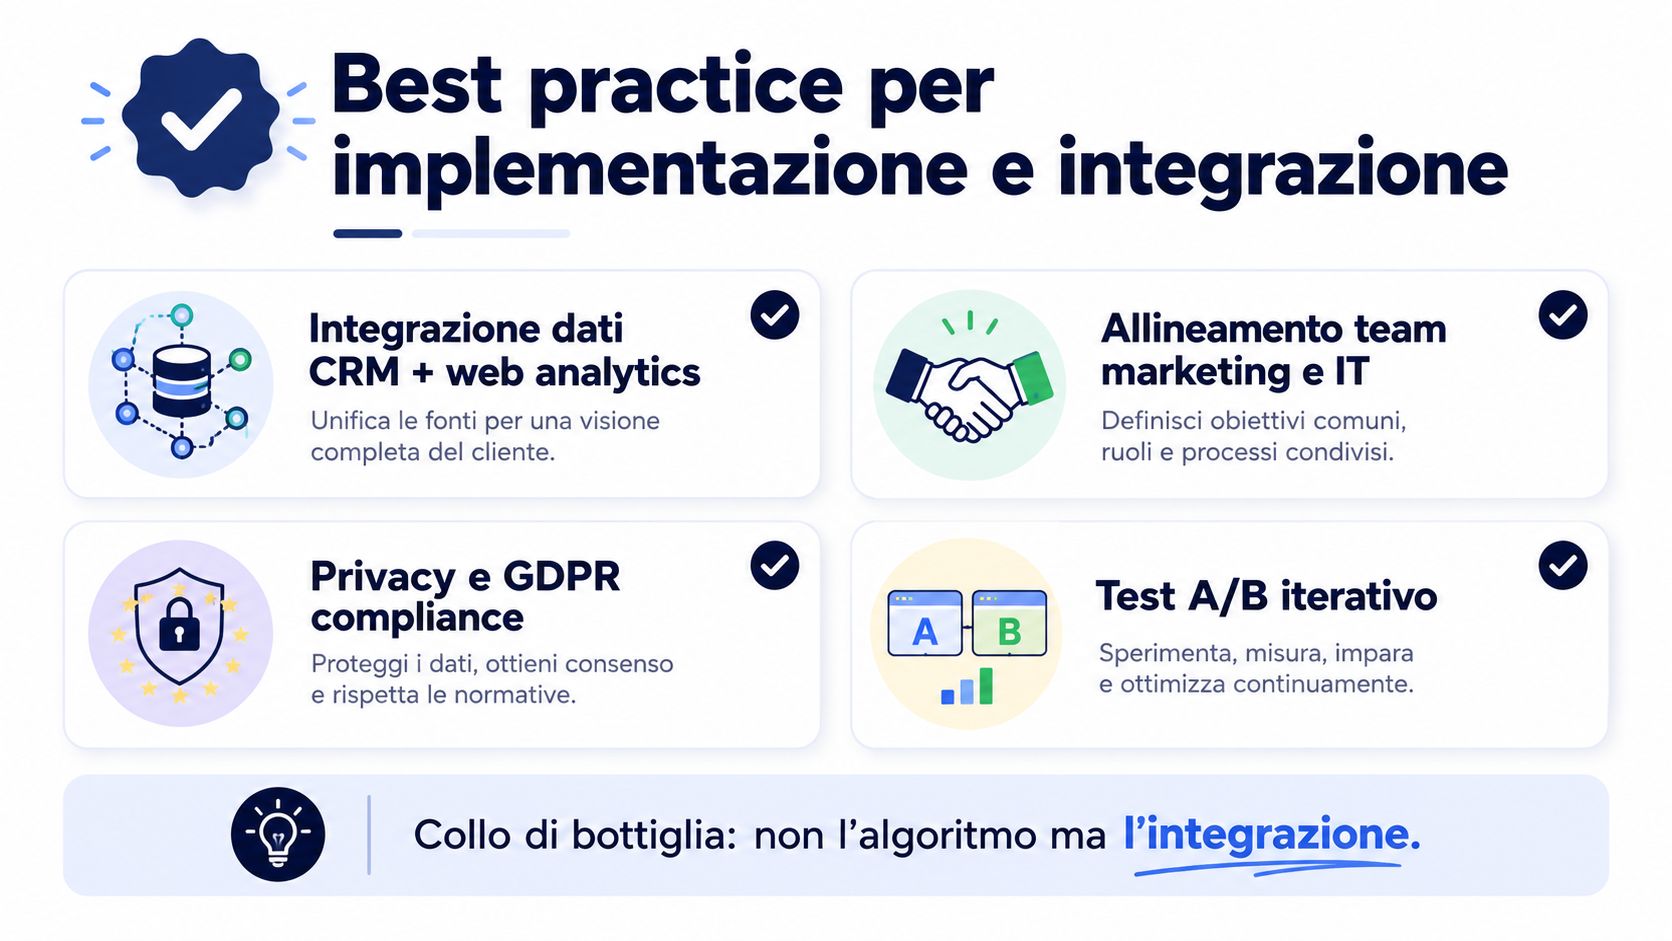
The transition from static segments to dynamic segments does not depend solely on the algorithm. An SME may have a good model and still achieve poor results if the CRM system does not communicate with the website, emails do not use the same identifier, and the sales team interprets events differently from the marketing team.
In Italy, AI adoption remains more widespread among large companies than among SMEs: 53.1% of large companies use AI solutions, compared with 15.7% of SMEs, according to Intesa Sanpaolo’s annual report on artificial intelligence in Italian companies. This figure points to a gap in infrastructure, skills, and data quality—not a lack of value in the method itself.
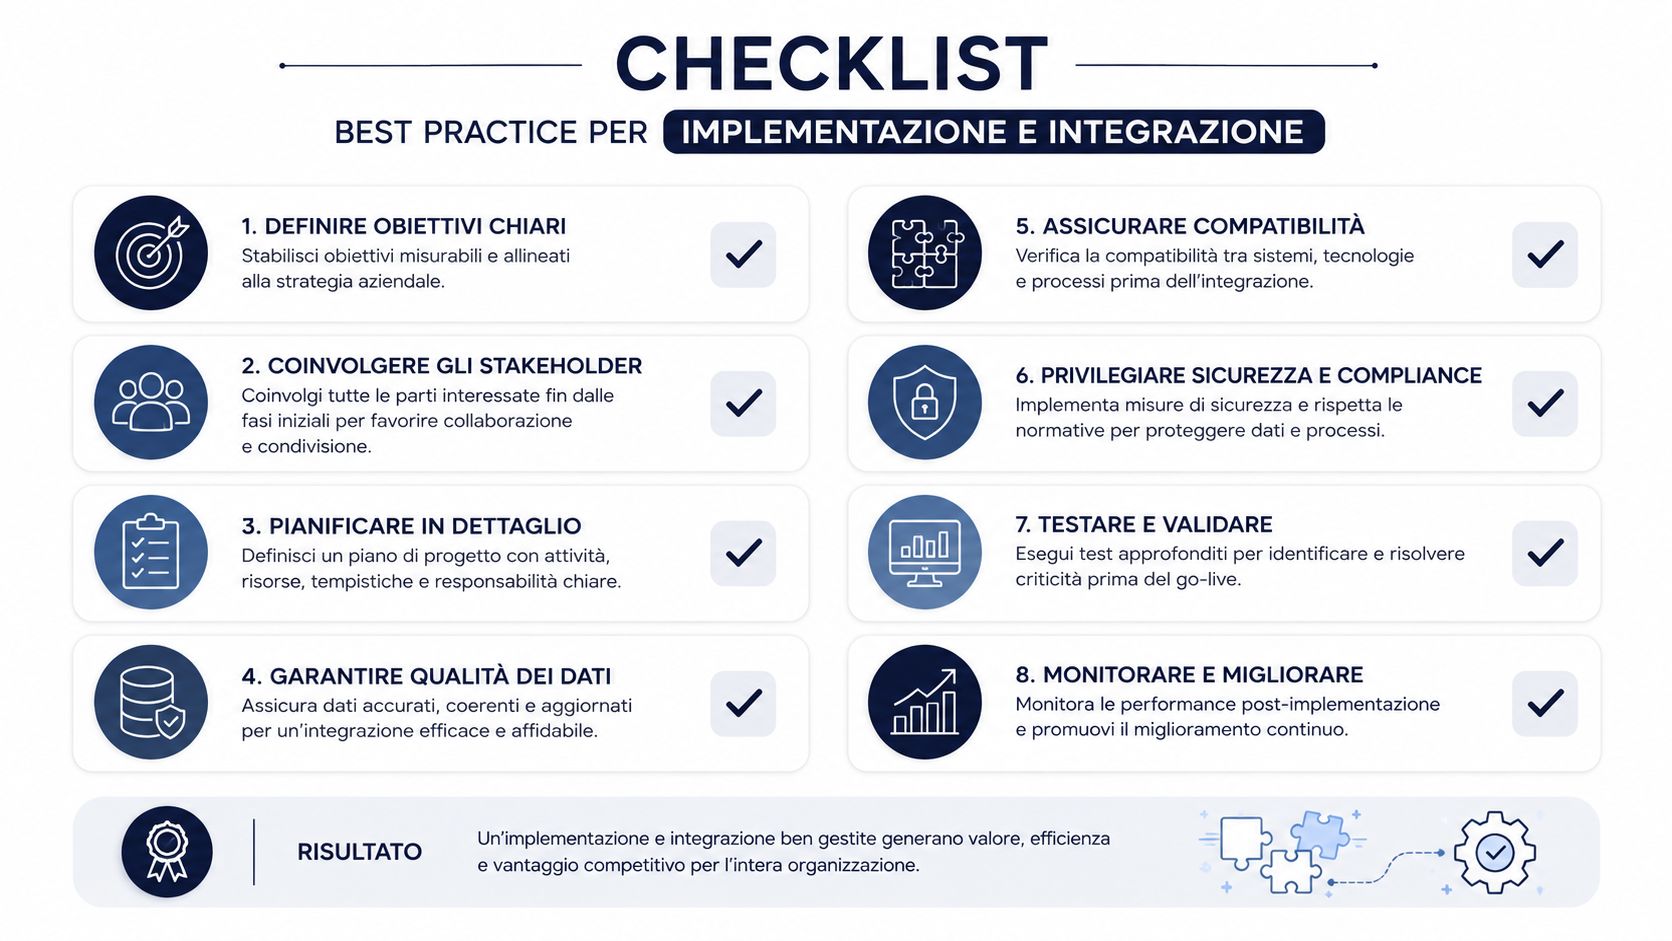
Start with a specific use case. If the goal is to reactivate inactive customers, define what “inactive” means for your business, what events indicate this status, and which team should take action. Then assign responsibilities: who monitors the data, who approves the campaign, and who measures the results.
A sustainable plan includes:
You don't have to start with an extremely complex segmentation strategy. A small, well-defined group—regularly updated and linked to a clear action—offers more value than dozens of clusters that no one uses.
The GDPR defines profiling as a form of automated processing used to evaluate personal aspects, including preferences, interests, reliability, behavior, location, and movements, as clarified by the Data Protection Authority in its definition of profiling. In Italy, the Data Protection Authority also distinguishes between the collection of data and the subsequent grouping of data subjects into homogeneous groups for specific purposes.
For marketing profiling, consent must generally be specific and separate from consent to receive promotional communications. The privacy notice must explain the profiling; the processing must be recorded in the processing register; and, when the activity is carried out on a large scale, an impact assessment may be required, according to the summary of Italian practice on GDPR profiling.
The Data Protection Authority’s ruling on Google also shows that data cannot be used for profiling without prior consent. The privacy notice must clearly explain the monitoring and use of data for advertising purposes, including techniques such as fingerprinting, as indicated in the Data Protection Authority’s ruling on Google.
Simple segmentation can use queries based on known characteristics. Profiling incorporates models, correlations, and inferences to estimate propensities or behaviors, as explained in the analysis of the differences between profiling and segmentation.
This distinction changes the responsibilities. Before implementing a model, verify the legal basis, transparency, data quality, and the ability to explain the use of the data segment. A platform like ELECTE—an AI-powered data analytics platform for SMEs—can help link data sources, automate preprocessing and analysis, identify patterns, anomalies, and trends, and generate reports; however, governance over the purposes and processing operations remains the responsibility of the company.
Behavioral segmentation isn't just for large corporations. It's a method for linking observable actions to everyday decisions—from retail promotions to shopping cart management, all the way to interpreting signals in financial services.
Start with the data you already have. Choose a goal, identify the most relevant variables, ensure that your CRM, website, email, and sales teams can communicate effectively, and create an initial, meaningful segment. Measure the response using consistent KPIs, then update the rules when behavior, the economic context, or business priorities change.
The difference between static and dynamic segmentation isn't just about technology. It lies in the team's ability to turn an event—such as a recent purchase or an abandoned cart—into a timely, privacy-conscious action. An AI-powered process can reduce manual work and make insights accessible even without a data science team.
ELECTE connects your business data sources, automatically analyzes purchasing behavior, and helps turn segments, anomalies, and trends into actionable reports. Visit ELECTE to find out how to incorporate dynamic segmentation into your small business’s daily operations.

.svg)


.svg)
.svg)