

You’re looking at a forecast that seems convincing. Sales are expected to rise, costs to remain under control, and the project to appear solid. Then someone in the meeting asks a simple question: “What happens if the margin shrinks?” Or: “If operating costs change, does the decision still hold?” At that moment, many business models reveal their limitations. They work well as long as no one challenges the assumptions.
This is where sensitivity analysis proves useful for managers, analysts, and finance teams. It’s not just about “running tests.” It helps identify which variables truly impact the outcome, which assumptions are fragile, and where the model ceases to be reliable. For an SME, this means making more informed decisions regarding budgets, pricing, inventory, investments, and forecasting.
Whether you work in administration, retail, operations, or data analysis, the logic is the same. A single forecast isn't enough. You need to know how much the result changes when the inputs change.
In this guide, you'll find a practical step-by-step approach, written in simple language with concrete examples, and designed for those who need to apply sensitivity analysis in their day-to-day work—not just understand it in theory.
A financial manager is preparing an analysis of a new investment. The file is organized, the formulas add up, and the final result looks promising. At the same time, a marketing manager is reviewing a sales forecast model and trying to determine whether the promotional plan will hold up even if customer retention is weaker than expected. Both face the same problem: the outcome depends on assumptions that could change.
That is precisely whysensitivity analysis was developed. It helps us understand which factors have the greatest impact on the outcome and to what extent a decision remains valid when the inputs do not behave as expected. It is not an academic exercise. It is a practical way to avoid overconfident decisions based on fragile foundations.
In practice, instead of accepting a single prediction at face value, you start to stress-test the model with controlled variations. If the output changes only slightly, you have a more solid foundation. If it changes significantly, you’ve identified a critical point that requires attention.
Rule of thumb: A useful model isn't the one that seems accurate. It's the one whose weaknesses you understand before using it to make a decision.
That is why sensitivity analysis is relevant to both those who run the business and those who build the model. One seeks reliability. The other seeks transparency.
The simplest definition is also the most useful: sensitivity analysis is “the set of mathematical techniques that examine how asynchronous changes in individual input variables to a model affect the output results, applicable to any field, including economic, financial, physical, and social,” as explained by Vedrai in his guide to sensitivity analysis.
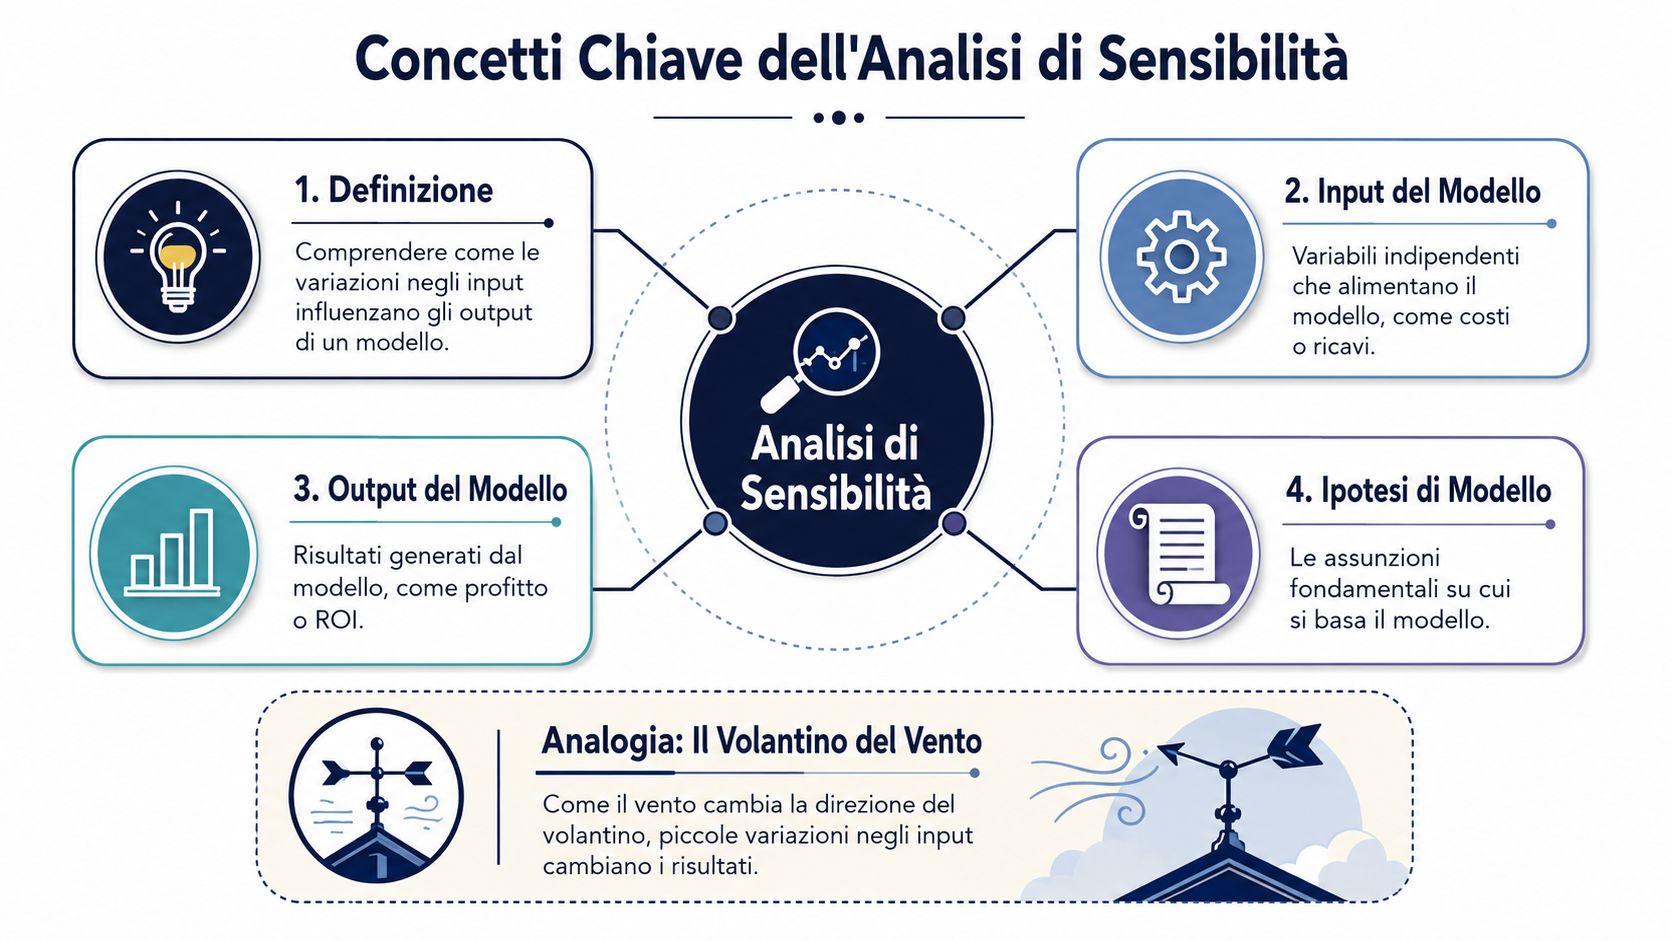
To get your bearings, you just need to distinguish between three elements.
Many people get confused here. They think that sensitivity analysis is just about changing the numbers. In reality, it’s also used to test the soundness of the assumptions. If an output depends on an unsound assumption, the problem isn’t the Excel spreadsheet. It’s the decision-making logic behind it.
Think of a wind vane on a roof. If the wind shifts slightly, the vane moves. If it shifts more sharply, it can turn abruptly. Something similar happens in business models. Some inputs have a limited effect. Others change the direction of the outcome.
This analogy helps us understand two things.
If you don't know which inputs actually drive the output, you're steering the model in the dark.
When a team learns to recognize this dynamic, sensitivity analysis ceases to be “just another test” and becomes a quality filter for decision-making.
A key historical point is this: sensitivity analysis is used to determine the robustness of an assessment by examining how much of the results are influenced by changes in models, unmeasured variables, or assumptions, in order to identify results that depend on questionable or unsupported assumptions, as summarized by SIMRI in its in-depth analysis on sensitivity analysis.
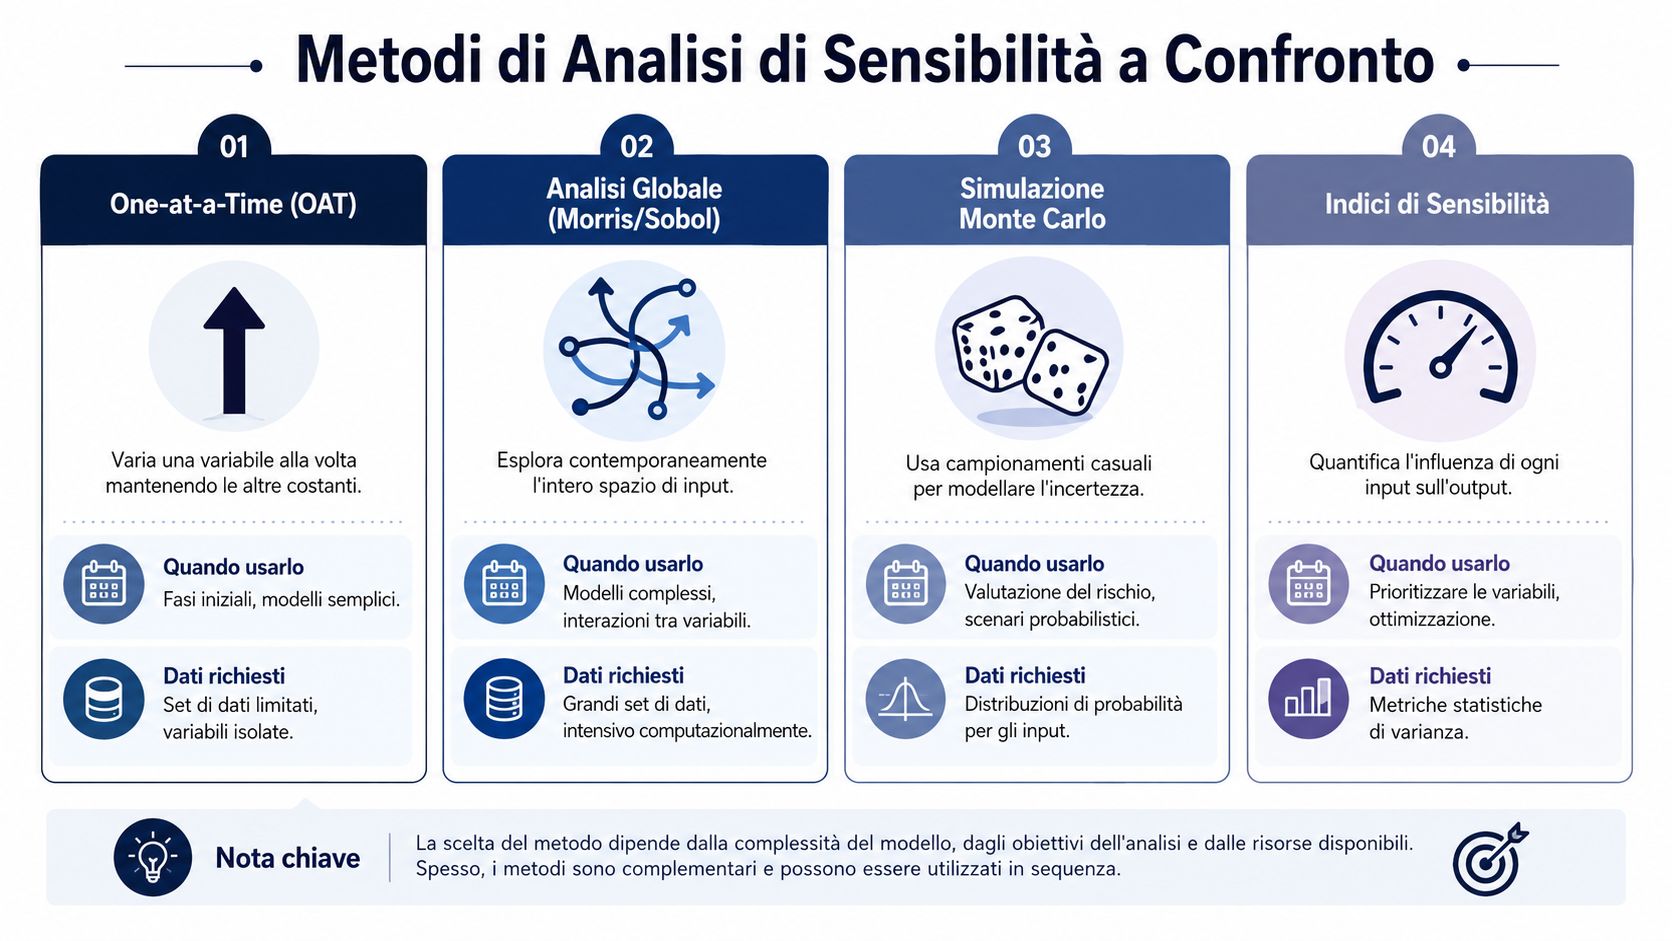
The most intuitive method is " One Factor at a Time," often abbreviated as OAT. Keep all variables at their reference values and change them one at a time, observing what happens to the output.
This is the right method when:
The main advantage is interpretability. The limitation is that it may not clearly reveal the interactions between variables. If price and demand influence each other, analyzing them in isolation may not be sufficient.
When the model is more complex, global methods come into play—methods also mentioned in teaching and practical applications, such as the Morris approach or Monte Carlo simulation. Here, you don’t change one variable at a time. Instead, you vary several variables within predefined ranges to observe the system’s overall behavior.
Monte Carlo simulation is particularly useful when you want to treat inputs as uncertain values and generate many possible scenarios. It does not yield a single answer. Instead, it yields a distribution of possible outcomes, which is much closer to how a company experiences uncertainty.
Sensitivity indices also help quantify the relative weight of the inputs. They are invaluable when you need to set priorities. Not all variables warrant the same amount of time for data collection, cleaning, or monitoring.
For those working on experimental models or structured tests of variables, it is also worth reading ELECTE’s DOE guide, which is useful for linking the logic of experiments to the quality of the analysis.
MethodWhen to Use ItData RequiredStrengthsLimitationsOATSimplemodels, initial analysisLimited data, clear baselineEasy to explainDoes not captureinteractions wellGlobal analysisComplex modelsReliable intervals for multiple inputsCaptures combined effectsMore challenging toperformMonte CarloRiskand forecastingInput distributions or rangesShows probabilistic scenariosRequires greater rigor inpreparationSensitivity indicesPrioritizationand optimizationStatistical model metricsHighlights key leversMay be less intuitive for those are not analysts
A good rule of thumb is to start simple and increase complexity only when the model requires it. There’s no need to use the most sophisticated method. You should use the one that makes the decision the most reliable.
Sensitivity analysis is invaluable when a business cannot afford to make decisions based on a single estimate. This often occurs in financial planning, procurement, pricing, promotion management, inventory management, and project evaluations. In all these cases, the key is not “getting the number right,” but understanding how well the number holds up when conditions change.
One particularly important aspect concerns decision reversal. In both statistical and operational contexts, sensitivity analysis makes it possible to determine by how much and in which direction each input variable must change in order to alter the sign of the response variable. In other words, it helps us understand when a decision shifts from being favorable to unfavorable. This concept is explained in the University of Padua’s material on sensitivity.
For a company, this has immediate practical consequences:
A model becomes more credible when you can explain where its vulnerabilities lie. This improves discussions with stakeholders, management, investors, and operational teams. Instead of saying, “This is the forecast,” you can say, “This is the forecast, and these are the variables that could cause it to change significantly.”
Effective sensitivity training does not eliminate uncertainty. It makes it visible and manageable.
In many small and medium-sized enterprises, this step is missing. The models exist, but they are not accompanied by an understanding of their fragility. The result is a false sense of security, which is often more dangerous than outright uncertainty.

In finance, sensitivity analysis is often used to understand how a company’s value responds to operational drivers. One specific finding is particularly useful: in the financial sector, a 10% increase in return on invested capital and gross margin results in a 20.58% change in enterprise value in the absence of growth and a 43.23% change in the presence of growth, as reported by Evaluation in its in-depth analysis of sensitivity analysis to support investment decisions.
For a CFO or controller, the message is clear. Not all variables deserve the same level of attention. If two operational drivers have such a significant impact on valuation, then they must be the focus of monitoring and stress testing.
Those who work on multi-year budgets, cash management, or planning can integrate this logic with dedicated advanced financial planning tools, thereby transitioning from a static model to a more dynamic interpretation of the assumptions.
In retail, the starting point isn’t corporate value but choosing the right inputs. Sales data analysis requires real-time monitoring of 8 specific KPIs, includingthe inventory turnover ratio—calculated by dividing total sales at cost by the average inventory for the period—and customer retention, obtained by dividing the number of customers who made the most purchases by the total number of active customers, as described in DTR Italy’s article on retail KPIs to monitor.
This changes the way you approach sensitivity analysis. In a retail store or an e-commerce business, you don’t start with abstract variables. You start with metrics that the team already tracks on a daily basis. If inventory turnover declines, what impact does that have on inventory levels, margins, and cash burn? If customer retention improves, how much does that change the sales forecast for the quarter?
The same reasoning applies to seasonal industries or those with highly variable demand. If you’re considering an outdoor hospitality business and want to develop realistic revenue scenarios, it can be helpful to compare fixed costs with external operational resources—for example, a guide on how much a glamping tent costs. This isn’t a minor detail. It’s a concrete example of how a good sensitivity analysis depends on the quality of the initial assumptions.
In forecasting, Monte Carlo simulation is useful when you don’t want to limit yourself to a “central” forecast. By sampling parameter values within specified ranges, you can generate many scenarios and transform the uncertainty in the inputs into a distribution of outputs. This is especially helpful when sales, costs, or demand are volatile.
A sales team can use this logic to answer practical questions:
When the forecast is viewed as a range rather than a single, definitive figure, managerial discussions immediately improve.
The advantage isn't having more formulas. It's making less naive decisions.
A good sensitivity analysis does not start with simulation. It starts with data discipline and model design.
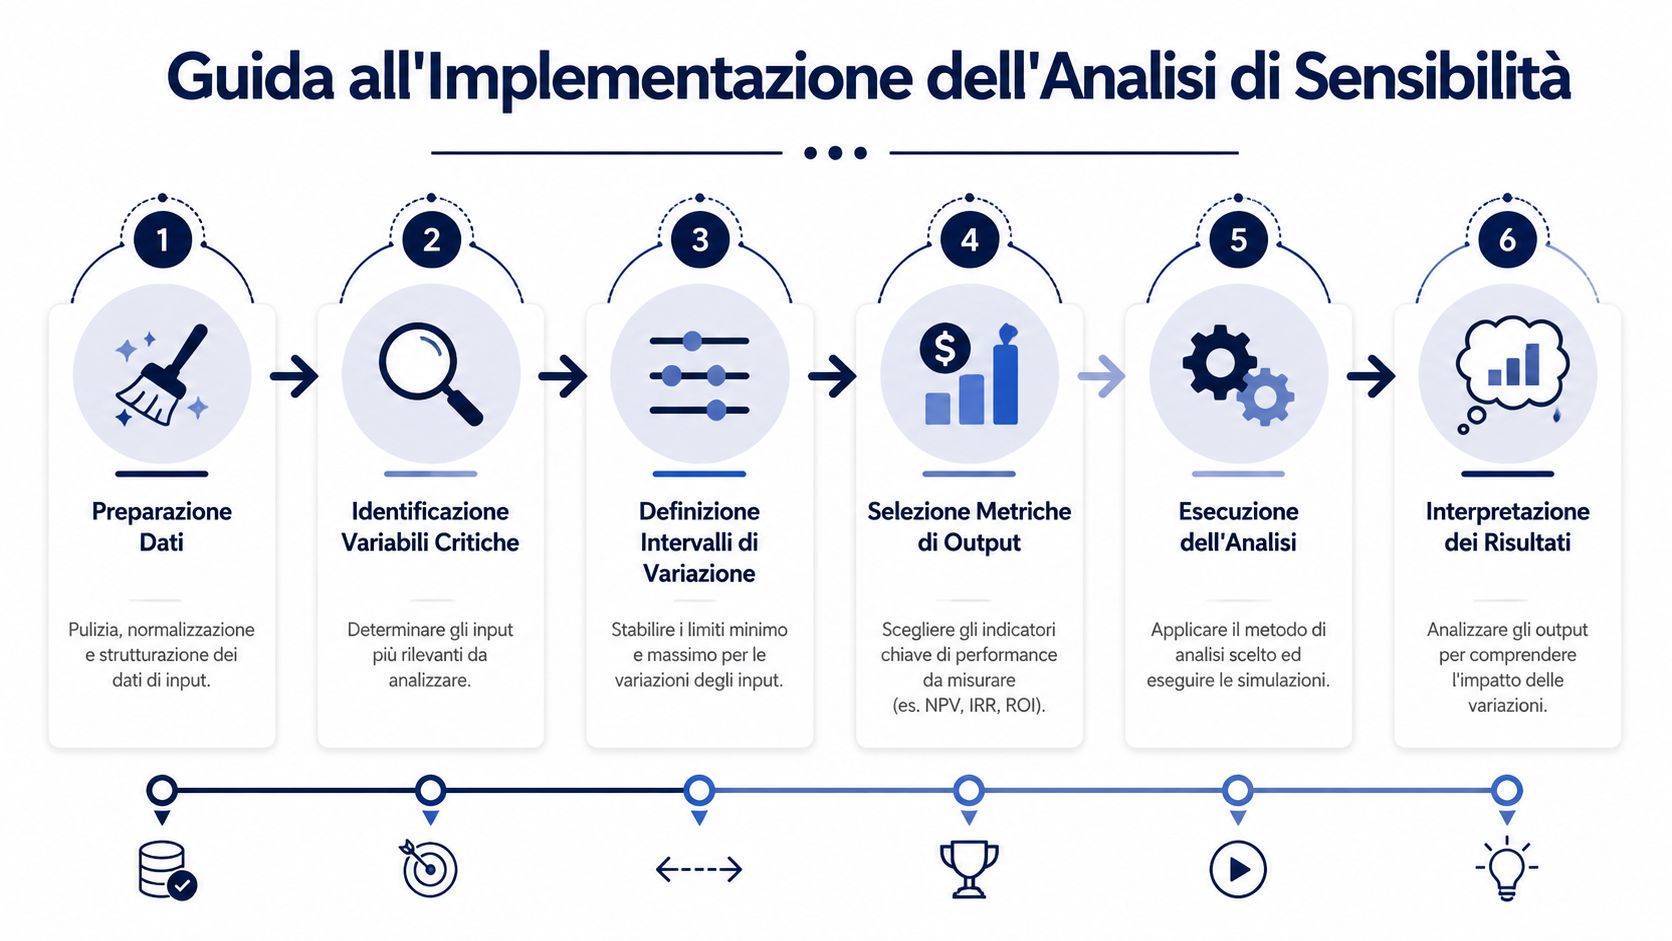
First of all, make sure the inputs are consistent, clean, and described in the same way throughout the dataset. If you have costs in one monthly sheet and revenues in another, aggregated differently, the test will produce noise instead of insights.
It's a good idea to work on these steps:
At this point, choose the critical variables. Don't choose them all at once. Start with the ones that have the greatest uncertainty or the greatest expected impact on the result.
Here's a simple approach:
This is where the most delicate concept comes into play. Sensitivity analysis allows us to answer precise quantitative questions, such as determining by how much and in which direction an input variable must change to alter the sign of the response variable. It is the point at which the model signals a possible decision reversal. For decision-makers, this is not merely a technical curiosity. It is the threshold beyond which the plan changes in nature.
Operational note: If you do not first define realistic ranges, the result will be mathematically sound but useless from a managerial perspective.
This is the stage where many people make a mistake. They see that a variable has a significant impact and conclude that that variable “is the problem.” That’s not always the case. Sometimes it’s simply the most uncertain variable. Other times, it’s the one that’s measured most inaccurately.
To interpret the results correctly, ask yourself:
Question: Why does it matter whether the output changes significantly or only slightly? It tells you whether the model is stable. Which inputs drive the deviation? It helps you prioritize monitoring and data collection. Is there a threshold that changes the decision? It alerts you to the real risk to the business. Is the effect linear or not? It helps you avoid oversimplifications.
Finally, present the results outside the technical report. A manager doesn't need fifty raw simulations. He needs three things: the sensitive variables, the magnitude of the effect, and the attention threshold.
That is why it is a good idea to conclude every analysis with a practical summary:
If you work in finance or compliance, please keep in mind that this guide is for educational purposes only and is not a substitute for financial, legal, or regulatory advice.
The most underrated aspect of sensitivity analysis is often visualization. You may have a sound analysis, but if you present it poorly, no one will understand where to take action.
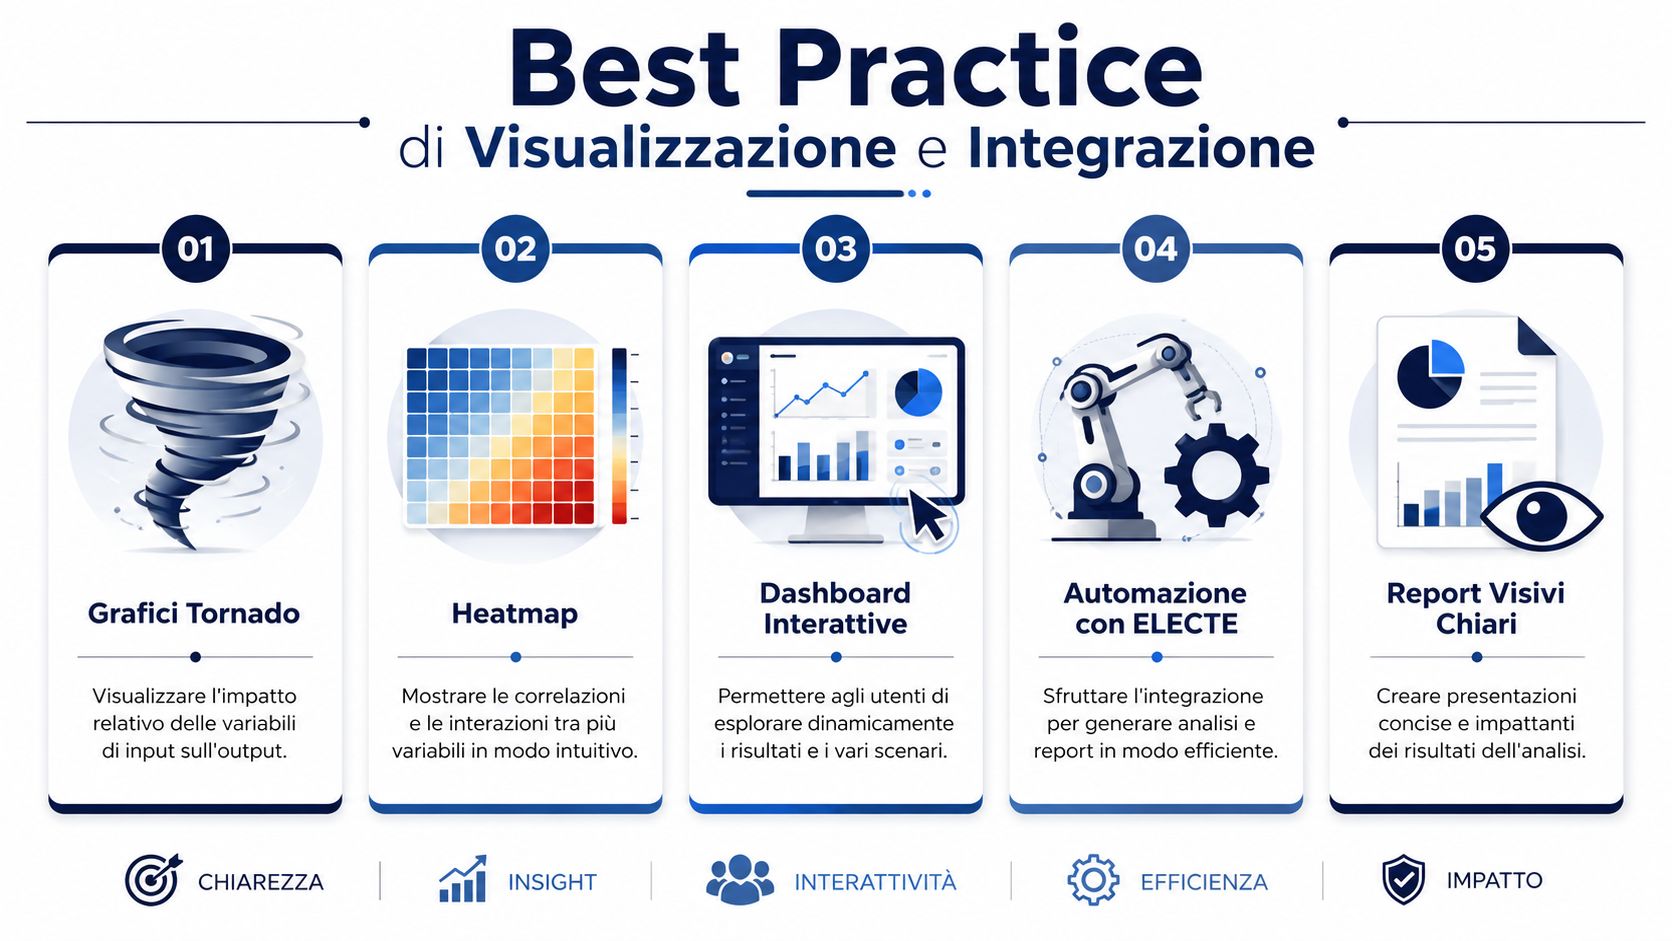
Three formats work very well.
In retail, this approach is even more important, because the selection of variables must be based on KPIs monitored in real time, such as inventory turnover and customer retention, as highlighted in the analysis of the industry’s sales KPIs. If you select the wrong inputs, even the most elegant chart won’t tell you much.
To choose the most appropriate visual format, it is helpful to compare specific examples in ELECTE’s guide to chart types.
When you incorporate sensitivity analysis into your business routine, focus on repeatability.
A well-configured platform is a great help in this process, especially when the team is small and doesn't have time to manually update models and reports.
Sensitivity analysis transforms a rigid forecast into a smarter decision. It shows you where the model is robust, where it is fragile, and which variables deserve ongoing attention. For an analyst, it means working more effectively. For a manager, it means making decisions with fewer surprises. For an SME, it means bridging the gap between theoretical numbers and operational reality.
The true power of sensitivity analysis does not lie in generating more scenarios. It lies in clarifying which assumptions truly drive the outcome and under what conditions a decision ceases to be valid. When this practice becomes part of daily work, forecasts, budgets, inventory levels, and assessments become more credible and more useful.
If you want to make this approach easier to implement, it’s worth using tools that automate data, insights, and reporting without increasing technical complexity.
ELECTE, an AI-powered data analytics platform for SMEs, helps teams transform raw data into clear insights, actionable forecasts, and repeatable analyses. If you want to incorporate sensitivity analysis into your decision-making process with less manual effort, discover ELECTE and try a faster approach to analyzing your data.

.svg)


.svg)
.svg)



.webp)
.webp)
.webp)