
Incorrect forecasts rarely stem from a single cause. They usually result from a familiar combination of factors: inventory ordered “on a hunch,” budgets based on the previous quarter, and demand spikes identified too late. If you run an SME, you’re all too familiar with this problem. One product sits idle in inventory while the right one sells out. A team is overloaded in some weeks and underutilized in others. Cash flow tightens just when you need the most visibility.
Time series forecasting helps reduce this uncertainty. In practice, it uses historical data organized chronologically to estimate what might happen next. It’s a bit like planning a trip by checking recent weather reports, but applied to sales, demand, support tickets, consumption, orders, or operational needs.
It matters more today than ever before because the environment is changing rapidly and patterns are not always linear. Time series forecasting is considered one of the most valuable analytical methods for business precisely because it helps make informed decisions based on reliable data and identify opportunities for efficiency and structural improvement, as summarized in Snowflake’s overview of time series analysis.
Many business forecasts fail because they treat the past as a simple average, rather than as a sequence with its own rhythm, seasonality, and changes. A spreadsheet with a trend line can help, but it often overlooks promotions, irregular spikes, local holidays, and operational variations.
The point isn't to "guess better." The point is to read the signals that your data already contains. Daily sales, e-commerce traffic, customer requests, and IT resource usage all form time series. If you analyze them carefully, you can understand when demand is accelerating, when it's slowing down, and when an apparent anomaly is actually a recurring pattern.
Rule of thumb: If your data changes over time and your decisions depend on timing, you already have a forecasting problem—even if you don't call it that.
When implemented correctly, time series forecasting improves inventory management, cash flow planning, scheduling, procurement, and resource allocation. It is not a discipline reserved for data scientists. It is a more reliable way to turn business history into operational decisions.
Time series forecasting estimates what might happen in the coming days, weeks, or months using data collected over time. For an SME, the difference compared to a historical average is simple: it’s not just the total that matters—it’s the order in which events occur.

An example immediately clarifies the point. Two companies may have the same monthly average sales, but one grows steadily while the other alternates between peaks, dips, and strong seasonal fluctuations. On an Excel spreadsheet, they look similar. In actual planning, they are not at all.
Forecasting is precisely designed to identify this difference. It helps you distinguish between three phenomena that are often confused:
For those who run an SME, this means fewer decisions made "on a hunch." It means knowing whether to increase orders, strengthen the support team, adjust shifts, or protect cash flow before the problem affects the bottom line.
In large companies, there are teams dedicated to analysis, modeling, and monitoring. In an SME, however, these tasks often fall on the shoulders of those already responsible for operations, finance, or sales. That’s why time series forecasting is practical when it’s understandable, manageable, and linked to concrete decisions.
It works like a planning system with a memory. It doesn't just look at the most recent data. It uses the history to estimate the next stretch of the route.
This is where it delivers tangible results:
| Corporate Section | Operational Question | How Forecasting Helps |
|---|---|---|
| Inventory | How Much to Tidy Up and When | Reduces stockouts and excess inventory |
| Cash Register | How much liquidity will be needed in the coming weeks? | Improve Financial Planning |
| Staff | When More Resources Are Needed | Adjust shifts and capacity to meet expected demand |
| Sales and Marketing | Is a spike stable or temporary? | Avoid misinterpreting campaigns and promotions |
The key takeaway for an SME is this: there’s no need to start with complex models. What’s needed is a method that transforms historical data into more reliable decisions. If you want to better understand how to transform data using machine learning, forecasting is one of the most practical applications to implement in your business.
To get a good overview, simply divide the models into two groups.
| Family | When It Makes Sense to Use It | Main Advantage |
|---|---|---|
| Statistical Models | Do you have a single set or just a few sets? Is the history organized? Do you need clear explanations? | They are easier to interpret and often faster to put into production |
| Machine Learning and Deep Learning Models | Do you have multiple variables, many products or retail locations, or irregular patterns? | They are better at handling complex relationships and less linear signals |
This distinction is especially useful for avoiding overinvestment. If you have limited data and fairly steady demand, a well-designed statistical model can provide more value than a sophisticated system that’s difficult to maintain. If, on the other hand, you’re working with many SKUs, different channels, frequent promotions, and rapidly changing consumer behavior, more advanced models become a sensible choice.
Here’s a good analogy. Statistical models are like a simple dashboard with a few reliable gauges. Machine learning models are like a more powerful control center, but one that’s also more demanding in terms of data, maintenance, and verification.
For an SME without a dedicated data science team, the right question isn’t “What is the most advanced model?” The right question is “Which model improves an operational decision with the least management effort?” This is where useful forecasting comes from—not just forecasting that’s technically correct.
A good forecasting model is like a reliable operational advisor. It doesn't have to be impressive. It should help you place orders more effectively, plan with less waste, and reduce errors in your day-to-day decisions.
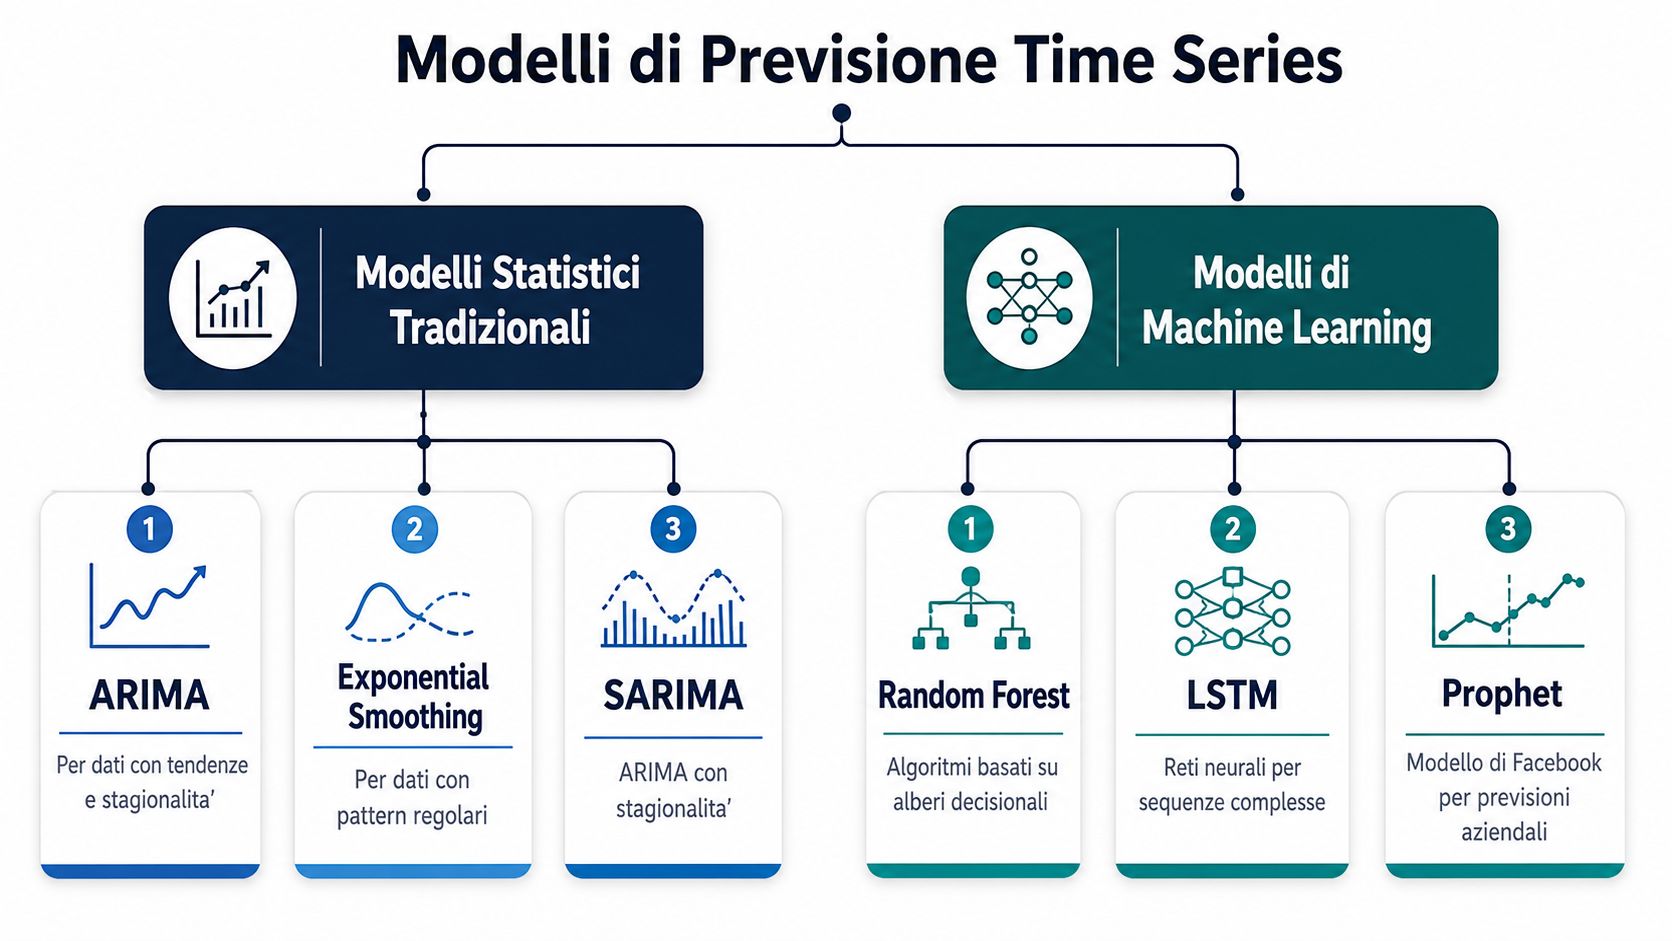
For an SME, the difference isn't just a matter of theoretical precision. It also matters how easy the model is to maintain, explain, and use without a dedicated technical team. That's why it makes sense to evaluate models based on the problem they solve, not just on their complexity.
ARIMA works well when the time series has a fairly clear structure and the recent past helps explain the near future. It’s a sensible choice for sales, orders, or consumption data with a steady trend, especially if you want to understand why the model produces a certain forecast.
SARIMA is the model to consider when seasonality is a major factor. If each month, quarter, or season follows a recurring pattern, this model captures it more explicitly than ARIMA.
ETS and Exponential Smoothing are often among the most practical models for an SME. They work well when the level, trend, and seasonality are fairly stable. In operational terms, this means faster startup times and less friction when those managing purchasing, inventory, or budgets interpret the results.
Theta is particularly worth considering when the history is not very long. In many cases, it offers a useful balance between simplicity, reliability, and implementation time.
Then there’s the issue of uncertainty. Some models aren’t just used to predict “how much you’ll sell,” but also “how wide the plausible range is.” For a manager, this difference is significant. A precise forecast helps set a target. A forecast range helps determine how much safety stock to keep.
Prophet is often chosen by companies that want to get up and running quickly with a model capable of handling seasonality, holidays, and calendar effects. It’s useful when demand patterns follow recognizable cycles, but you don’t want to build everything from scratch.
Then there are RNNs and LSTMs, families of models designed to handle more complex time series. They are best suited when demand does not follow a linear pattern, when you have many products or retail locations, or when promotions, external variables, and frequent changes come into play.
Here, it’s best to take a practical approach. A deep learning model can identify relationships that a traditional approach misses, but it requires more data, more testing, and more oversight. For an SME, it makes sense to use it only if the complexity of the business justifies the effort. If you want to better understand how these approaches help transform data using machine learning, it’s worth exploring the shift from descriptive models to decision-making models.
Attention mechanisms can also improve these models, because they help the system place greater weight on the historical data points that are truly relevant. In practice, it’s like asking the model not to treat all past data equally, but to focus on what most closely resembles the current situation.
The right question isn't which model is the most advanced. The useful question is which model delivers a clear operational improvement at a level that your team can sustain.
To help you get your bearings, use this mental framework:
Regular season and organized history
Historical Short Story
Many SKUs, many locations, external signals
A Strong Need for Explainability
Limited in-house technical expertise
The best model is one that improves a specific decision and remains manageable over time.
Making the right choice starts with a simple question: Which decision do you want to improve? If forecasting is meant to help you better manage next week’s inventory, the ideal model isn’t necessarily the same one you’d use to plan capacity or your annual budget.
Start with four criteria.
Data volume. If you have limited historical data, it’s best to prioritize reliable and straightforward approaches. If, on the other hand, you collect data from many products, locations, or channels, you can take advantage of models capable of learning from multiple data sets simultaneously.
Data quality. Missing values, anomalies, and inconsistent records can ruin even the best model. A thesis from the Politecnico notes that 70% of Italian SMEs lack standardized procedures for data filtering and imputation, and emphasizes the importance of removing outliers and isolating regular components to improve accuracy, as discussed in the Politecnico’s research.
Complexity of the pattern. A simple seasonal pattern is different from multiple overlapping cycles. Some companies have a predictable schedule. Others are driven by promotions, events, weather, or logistical constraints.
Forecast horizon. Forecasting the coming week is not the same as forecasting the coming year. As the forecast horizon increases, uncertainty increases and the type of model that is best to use changes.
You can use this mini-guide as a compass:
Good forecasting doesn't start with the model. It starts with the business decision you want to make with greater confidence.
Many SMEs make the mistake of asking the model to solve a problem they haven't clearly defined. If you don't clarify whether you want to reduce stockouts, protect cash flow, or plan capacity, you'll end up with a fancy forecast that's not very useful.
A useful forecast in a company is more like a production line than a statistical exercise. If a step is missing, the error carries through to the final decision: incorrect orders, unreliable budgets, and cash flow under pressure.
That is why it is important to follow a clear process. The studyby the University of Bologna breaks it down into seven steps: 1) defining the problem, 2) collecting data, 3) analyzing data, 4) selecting a model, 5) validating the model, 6) building the predictive model, 7) monitoring performance.
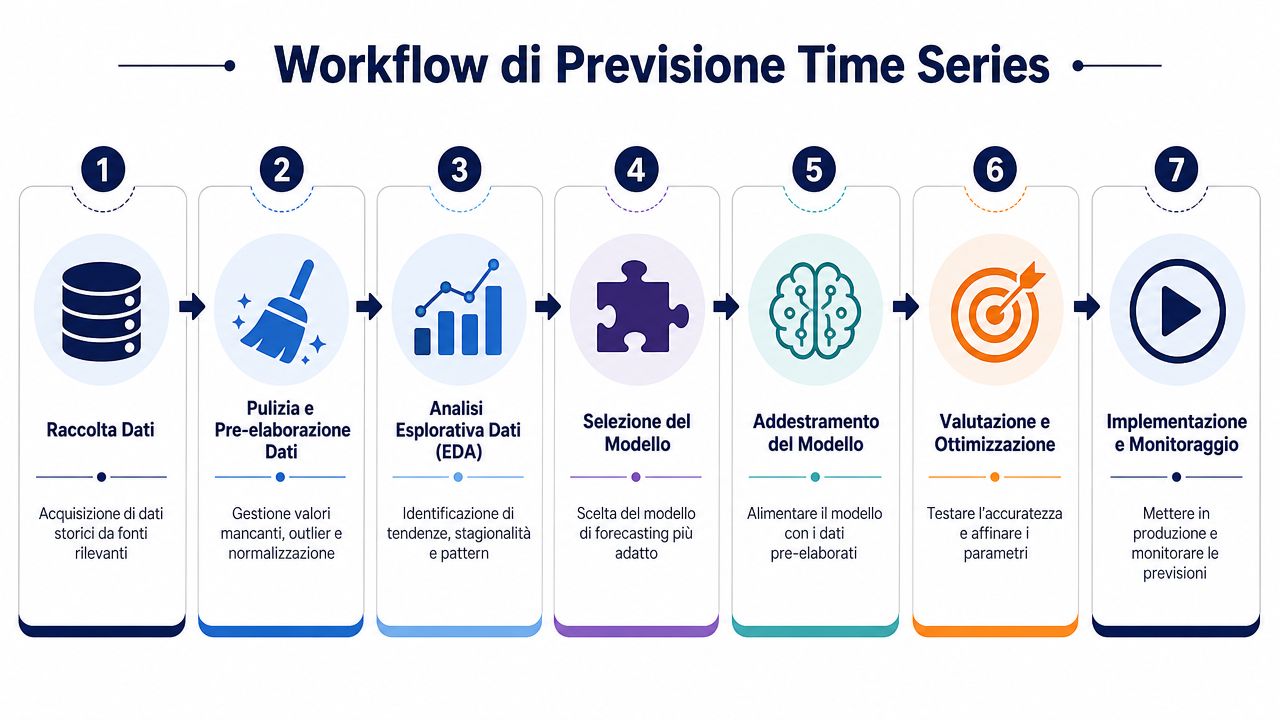
1. Defining the Problem
Start with the decision, not the data. You need to clarify what you want to forecast, over what time horizon, and for what specific action. Forecasting weekly volumes to plan purchases is different from forecasting cash needs to avoid financial strain. If the problem is vague, even the best model will produce a figure that is of little use.
2. Data Collection
This is where many SMEs encounter the real bottleneck. The data often already exists, but it’s scattered across ERP systems, e-commerce platforms, CRMs, POS systems, and Excel files created by different departments. The goal isn’t to accumulate everything. The goal is to build a consistent foundation with accurate data, uniform frequency, and variables that have a real connection to the forecast.
3. Data Analysis
Before building a model, you need to interpret the data series just as you would analyze a retail store’s sales trends over time. Are there months with regular peaks? Is there steady growth? Are there gaps, outliers, or changes in behavior following a promotion, a price increase, or the launch of a new channel?The University of Bari’s materials provide a useful overview of classic methods, such as the centered moving average and seasonality estimation, which help distinguish noise from underlying trends.
4. Choosing a Model
Only at this point does it make sense to compare models. In practice, it’s like choosing a vehicle after you’ve figured out the route you need to take. For a stable and interpretable set of results, a simple statistical approach may suffice. If, on the other hand, you have many external variables, multiple business lines, or less linear dynamics, a more sophisticated model may be needed. For an SME without a data science team, the right question to ask is: Does this model truly improve an operational decision, or does it just add complexity?
5. Model Validation
Validation must be performed using data from a different time period. The model must be tested on periods that come after those used for training; otherwise, you’ll end up with an overly optimistic estimate. In practical terms, you can’t ask a forecast to “predict” April if it has already seen April during the testing phase. This is one of the most common mistakes in projects that are rushed.
6. Setting Up the Forecasting Model
This is where forecasting becomes part of business processes. Decide how often to update the model, who receives the output, in what format, and with what alert thresholds. This step is particularly important for SMEs, because the value doesn’t come from the model itself but from the fact that someone uses it at the right time. If you’re working on financial planning and cash management, a relevant example isAI-powered cash flow forecasting for SMEs.
7. Performance Monitoring
A model does not remain reliable forever. Prices, channels, customers, suppliers, and market conditions change. For this reason, it must be reviewed regularly by comparing forecasts with actual results, in order to determine whether the margin of error remains acceptable or whether an update is needed.
Recurring errors are almost always operational in nature.
To accurately measure performance, it’s best to use a few stable metrics that are easy for the business to understand, such as average percentage error and average error deviation. There’s no need to impress with complex formulas. What matters is determining whether the forecast is reliable enough to support purchasing, production, staffing, or cash flow.
If you measure the error using a consistent method, you can improve your forecasting. If you change your criteria every month, you're just changing the way you look at the same problem.
The value of forecasting becomes clearer when it becomes part of daily operations. There’s no need for futuristic scenarios. All it takes is solving everyday problems more effectively.

First. A retail manager notices that some seasonal products are arriving late, while others are sitting in inventory for too long. Reorder decisions are based primarily on experience and aggregate historical data.
Next. With forecasts broken down by store, channel, and time period, the team can better distinguish between structural demand and temporary spikes. The tangible benefit isn’t just selling more—it’s reducing waste, avoiding stockouts, and protecting margins during critical moments.
Before. A finance team prepares cash flow and risk estimates using manual updates, which often lag behind actual changes.
Next. Forecasting allows you to anticipate recurring trends, short-term pressures, and increased volatility. This helps with working capital planning and control. For those working in treasury and planning, gaining a deeper understanding of how to useAI-powered cash flow forecasting for SMEs can be a very useful step.
In operational finance, a good forecast does not eliminate uncertainty. It makes it manageable.
Note: This content is provided for informational purposes only and does not constitute financial or compliance advice. Decisions regarding risk, credit, and investments always require professional assessments tailored to the specific context.
First. Production, procurement, and logistics operate with limited visibility. Each department sees only its own numbers and discovers variances too late.
Next. Demand forecasting better aligns procurement, production, and distribution. The result is a more orderly workflow: fewer emergencies, fewer schedule changes, and better use of resources.
Once forecasting is integrated into business processes, it is no longer limited to analysis. It becomes a mechanism for coordination across different functions.
For many small and medium-sized businesses, the real challenge isn't understanding the value of forecasting. It's finding the time and expertise to do it well on an ongoing basis. This is where it makes sense to use a platform designed to reduce manual work.
ELECTE, an AI-powered data analytics platform for SMEs, connects various data sources, pre-processes the information, and helps transform fragmented historical data into a more organized analytical process. In practice, many tasks that normally require separate steps are consolidated into a single workflow.
This changes the way we work in several ways:
The real benefit is organizational. An SME often doesn’t have a dedicated data science team, but still needs to make decisions regarding inventory, cash flow, marketing campaigns, risk, and operational capacity. A platform like ELECTE bridges the gap between business needs and actionable analytics.
Another key strength is accessibility. People working in operations, finance, or retail don't want to manage complex pipelines every week. They want a clear, up-to-date, and actionable view. This is where automation comes into play.
For those considering specialized solutions, it’s worth exploring the upcoming AI forecasting solutions available within the ELECTE ecosystem.
Looking ahead, the industry is also moving toward foundational models for time series. A forecast reported by PricePedia indicates that, starting in 2024, these models will be pre-trained on billions of time points drawn from thousands of historical time series and will be able to generate predictions in zero-shot mode with performance comparable to or superior to the best traditional econometric approaches, according to PricePedia’s analysis of foundational models.
Time series forecasting isn't a magic formula. It's a method for gaining a better understanding of your business over time. When you choose a model based on real data, validate it properly, and monitor its performance, forecasts become a practical decision-making tool.
For an SME, the biggest benefit is simple: fewer knee-jerk reactions, more planning. Better inventory management, more reliable budgets, and resources allocated with greater clarity. That’s how data stops being just a timeline and starts guiding the way.
If you want to move from theory to action, try ELECTE, the AI-powered data analytics platform designed to make forecasting and advanced insights accessible even without a dedicated technical team. Light up the future with AI.

.svg)


.svg)
.svg)