

Duplicate data in Excel isn’t just an annoyance. It’s a hidden cost that, row by row, undermines the reliability of your analyses and, as a result, the soundness of your business decisions. Whether you’re managing a customer database, a product inventory, or a financial report, you know that even a single incorrect data point can lead to wasted budget and unreliable forecasts.
Eliminating these redundancies isn’t just an option—it’s a crucial step for any SME that wants to grow based on concrete data. Yet the manual approach—arm yourself with patience and comb through thousands of lines—is slow, frustrating, and prone to errors.
In this guide, we’ll show you how to turn a messy spreadsheet into a reliable data source. We’ll explore the most effective methods for finding duplicates in Excel, starting with built-in tools and moving on to automated solutions that will ensure accuracy and save you precious hours. You’ll learn how to choose the right tool for every situation, ensuring that your decisions are always based on a solid foundation.
Think for a moment about all-too-common scenarios. An email marketing campaign that bombards the same customer with multiple messages because of inaccurate contact information. Or a sales report with inflated figures because some orders were entered two or three times. These aren’t abstract scenarios; they’re the direct consequences of duplicate records lurking in your spreadsheets.
For SMEs that rely on Excel as the backbone of their data analysis, ignoring this issue means building their strategies on a house of cards. Every single duplicate that goes undetected can result in:

Many people try to tackle the challenge of finding duplicates in Excel using manual methods, but this approach has more drawbacks than benefits. The problem is incredibly widespread: research on the Italian IT market shows that approximately 72% of SMEs with databases containing more than 100,000 records report a significant number of duplicates.
Relying on techniques such as conditional formatting and then proceeding with manual removal is no guarantee of success. On the contrary, this method can result in an error rate estimated to be between 15% and 22% during the cleanup process. You can get a clearer idea of why by reading more about how to view duplicates in Excel.
A clean dataset is not an end goal, but the starting point for any meaningful analysis. Transforming data cleaning from a reactive and costly task into a structured process is a decisive competitive advantage.
Before diving into complex formulas or scripts, it’s essential to master the tools Excel provides right from the start. These are built-in functions that are perfect for quick fixes and managing small datasets. They’re your first line of defense when you need to find duplicates in Excel and act fast.
Think of a common scenario: you’ve just imported a customer database and want to immediately clean up entries that are clearly identical. Or, you need to upload a product list to an e-commerce site, where duplicate product codes could throw your inventory into disarray. In these cases, there’s no need to overcomplicate things. Excel’s built-in tools are designed to provide an immediate solution.
The Remove Duplicates tool is the most straightforward way to eliminate entire rows containing identical values. You’ll find it on the Data tab, and while it’s incredibly powerful, it should be used with caution. Its real strength lies in its ability to define what constitutes a “duplicate” based on one or more columns of your choice.
Let's look at a practical example. Imagine a list of contacts with columns for "First Name," "Last Name," and "Email."
The dialog box lets you choose exactly which columns to use for the check, just as shown here.
As the image shows, it’s surprisingly simple: once you’ve selected the data range, all you have to do is check the boxes next to the columns that must match for a row to be considered a duplicate.
What if you don’t want to delete anything—at least not right away? What if you need to review the data manually before making any decisions? That’s where Conditional Formatting comes in. This method doesn’t delete any data; it simply highlights the cells that contain duplicate values.
It’s the perfect approach for exploratory data analysis. Imagine you need to check whether there are any invoices with duplicate numbers in an accounting ledger. With just a few clicks, you can highlight all the cells containing duplicate invoice numbers, allowing you to investigate each case individually without risking the accidental deletion of important data.
Conditional Formatting transforms the search for duplicates from a "blind" process into a visual, controlled analysis. It gives you the ability to see the problem before you solve it.
This approach is a valuable tool during the data quality control phase. If you frequently work with data from external sources, such as a PDF file, we recommend that you also learn how to properly convert data from PDF to Excel to minimize errors from the start.
Both tools are excellent starting points, but they have their limitations. "Remove Duplicates" is an irreversible, almost brutal process. "Conditional Formatting," on the other hand, can bloat and slow down large files. When the going gets tough and the data gets more complex, it's time to move on to more advanced techniques.
When Excel’s basic tools aren’t enough anymore, it’s time to bring out the heavy artillery. If you find yourself dealing with duplicates involving complex logic, or if you need to automate the cleanup of reports you receive every week, formulas and Power Query aren’t just options—they’re the solution.
This marks the shift from a manual, error-prone approach to a structured, reliable, and reusable system. Going beyond simple highlighting or removal gives you surgical precision—which is essential when working with large volumes of data or constantly updating data streams.
Formulas give you the power to decide, with absolute precision, what constitutes a duplicate. The most tried-and-true method is to create a helper column and use the COUNTIF function. This technique not only finds duplicates but also tells you how many times they appear.
Imagine you have a list of orders and want to find any duplicate transaction IDs. You could add a "Count" column and enter a very simple formula: =COUNTIF(A$2:A$100, A2).
This formula counts how many times the value in cell A2 appears in the entire list. If you drag it down, you'll get a clear result for each individual row:
At that point, simply apply a filter to this column to show only values greater than 1. That's it: you've just isolated all the duplicates, ready to be analyzed or removed.
If you're working with the latest versions of Excel (Microsoft 365 and later), dynamic array functions like UNIQUE and FILTER make the process even faster. With a single formula, you can extract a clean list of unique values into a new area of the worksheet, without even needing temporary columns.
Formulas transform duplicate detection from a static task into a dynamic analysis. They give you full control to define, count, and filter duplicates according to your own rules—not Excel’s.
But the real game-changer for anyone who works with data on a regular basis is Power Query. This tool, which is built into Excel under the "Get & Transform" tab, is much more than just a tool for finding duplicates. It’s a full-fledged automation engine that records every step of the data cleanup process and makes it repeatable with a single click.
The process is surprisingly intuitive. First, you load your data into the Power Query editor. Once there, you select the columns that, together, define a duplicate record, and use the "Remove Rows" > "Remove Duplicates" function.
This infographic provides a clear overview of the decision-making process for choosing the method that best suits your needs.
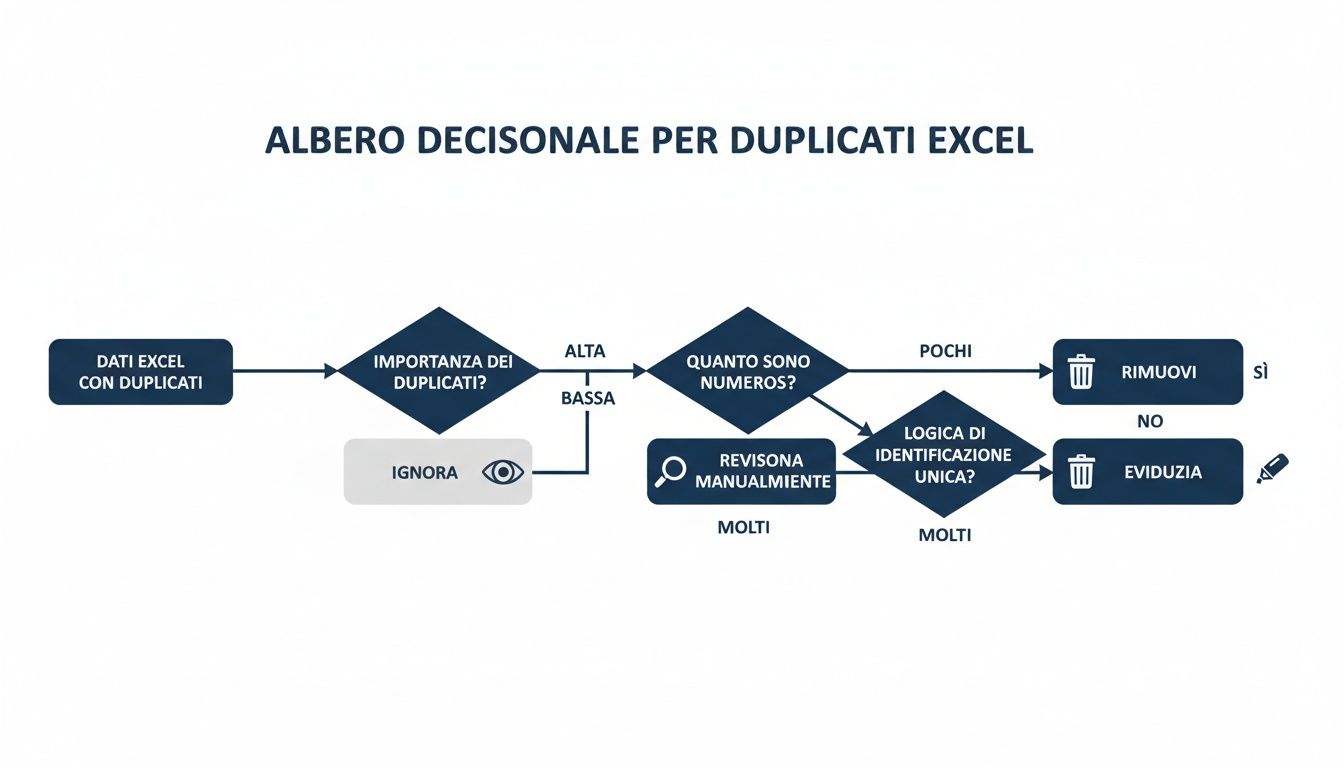
As you can see, the approach varies depending on whether you just need to identify duplicates or permanently remove them. And for recurring tasks, Power Query is almost always the best choice.
The true magic of Power Query becomes apparent over time. Once you’ve set up the query, all you need to do is update the data source (for example, by replacing last month’s file with the new one) and click “Refresh.” Excel will automatically repeat all the steps you’ve defined, including removing duplicates, and return a clean dataset in just a few seconds.
This is an essential approach if you regularly work with CSV files or other types of periodic reports. If you’d like to learn more about how to optimize these workflows, our essential guide to working with CSV files in Excel is a great place to start.
When standard tools are no longer enough, it’s time to take it to the next level. For those who deal with massive amounts of data on a daily basis and are looking for total flexibility, Visual Basic for Applications (VBA) macros represent the cutting edge of automation in Excel.
It’s not a one-size-fits-all solution, mind you. But if your goal is to turn complex, repetitive tasks into a process that starts with a single click, VBA can really make a difference in your workday.
The idea is to go beyond the limitations of Remove Duplicates or Power Query by implementing logic tailored to your specific needs. Imagine not only having to find duplicates, but also analyzing them based on multiple criteria, moving them to an archive sheet, sending an email notification, or highlighting them according to rules that change from time to time. This is the kind of automation that VBA makes possible.
To get started, the first thing you need to do is enable the "Developer" tab on the Excel ribbon, which is hidden by default. You only need to do this once: go to File > Options > Customize the Ribbon and check the "Developer" box. That's it. You now have access to the Visual Basic editor, where you'll write or paste your code.
Think of a macro as a recipe you give to Excel. Instead of manually clicking buttons and menus, you write instructions that replicate those actions—and much more—automatically and instantly.
Let's look at a concrete example. Suppose we want to find duplicate rows based not on one, but on two columns: "First Name" (column A) and "Last Name" (column B). The goal is to highlight all occurrences in yellow, not just those that follow the first one.
Here is a VBA script, complete with comments, that does exactly that.
Sub HighlightMultiColumnDuplicates()Dim dict As ObjectDim lastRow As LongDim i As LongDim key As String' Find the last row containing data in the active sheetlastRow = ActiveSheet.Cells(Rows.Count, 1).End(xlUp).Row' Create a "dictionary" object to store unique combinationsSet dict = CreateObject("Scripting.Dictionary")' Clears any previous background colorsActiveSheet.Range("A2:B" & lastRow).Interior.ColorIndex = xlNone' Scans each row, starting from the secondFor i = 2 To lastRow' Creates a unique "key" by combining First Name and Last Namekey = Trim(ActiveSheet.Cells(i, 1).Value) & "|" & Trim(ActiveSheet.Cells(i, 2).Value)If dict.exists(key) Then' If the key already exists, this is a duplicate row. I color...ActiveSheet.Rows(i).Interior.Color = vbYellow' ...and I also color the first occurrence I had saved in the dictionary.ActiveSheet.Rows(dict(key)).Interior.Color = vbYellowElse' If the key is new, I add it to the dictionary along with its row numberdict.Add key, iEnd IfNext i' Free the memory used by the dictionarySet dict = NothingEnd SubVBA gives you complete control. You’re no longer limited by built-in functions; instead, you can build your own logic to find duplicates in Excel and handle them exactly as your workflow requires.
To use this code, simply open the VBA editor (using the shortcut ALT + F11), insert a new module from the Insert menu, and paste the script. You can then run the macro directly from the Developer tab.
With just a few changes, this same script could move duplicates to another sheet instead of highlighting them, or perhaps delete them and keep only the first occurrence. The flexibility is unmatched, but it requires a learning curve and code maintenance that more modern, integrated solutions do not.
Let’s face it: for many SMEs, Excel was their first love in the world of data. It’s versatile, familiar—a true Swiss Army knife. But there comes a time when that Swiss Army knife is no longer enough to build a cathedral. Insisting on using it when data complexity explodes is no longer a solution, but the root of the problem itself.
The signs that it’s time for a change are frustrating and unmistakable. Files that take forever to open, only to freeze or, worse, become corrupted. The immense effort required to compile data from various sources: CRM systems, business management software, and APIs. And then there’s the version chaos, with dozens of “final” and “definitive” copies that make it impossible to determine which is the official version.

ELECTE, an AI-powered data analytics platform, does more than just find duplicates in Excel. It tackles data quality at its root, with a depth that Excel cannot match. An analysis revealed that 64% of SMEs have suffered negative consequences due to duplicate data. But there is good news: companies that have automated these processes have seen data reliability jumpto 89% and have cut the time wasted on manual tasks by 73 %.
Going beyond Excel means unlocking smarter features:
Investing in a dedicated platform isn’t a cost—it’s a strategic move. It means stopping patching things up and starting to build a robust, scalable, and future-proof analytics system.
AI-driven automation, such as the technology behind ELECTE, drastically reduces human error and frees up valuable time. Suddenly, your team no longer has to struggle with unmanageable spreadsheets and can finally focus on what really matters: strategic analysis, interpreting insights, and making decisions that drive growth.
When data cleaning becomes a daily hurdle, it’s a clear sign that Excel has reached the limits of its potential as a tool for large-scale analysis. Switching to business intelligence software isn’t just a matter of efficiency—it’s essential for scaling your company’s analytical capabilities and staying competitive. You can learn more about the benefits by reading our article on the best business intelligence software for SMEs.
Managing duplicate data in Excel is essential to ensuring the reliability of your analyses. Here are the key points to keep in mind:
You’ve seen how to tackle the issue of duplicates in Excel, from quick fixes to advanced automation techniques. Each method has its advantages, but the ultimate goal is always the same: to transform your raw data into a reliable resource that drives smart business decisions. Don’t let dirty data hold you back.
Are you ready to say goodbye to manual data cleaning and unlock the true potential of your analytics? With ELECTE, you can automate duplicate management, integrate all your data sources, and gain reliable insights in just a few clicks.
Find out how ELECTE transform your data—start your free trial →

.svg)


.svg)
.svg)