
In the morning, you check the price list, margins, and order backlog, and then the question every sales or finance manager knows all too well comes up: What happens if I raise the price, keep everything the same, or change the promotion? The right answer doesn’t come from instinct alone, because every decision regarding pricing, inventory, or forecasting is already an experiment in the future. That’s exactly what a what-if analysis tool is for: turning uncertainty into a clear simulation so you can see the consequences before taking action.
For an SME, the point isn’t to have more data than anyone else. The point is to have a simple method for testing hypotheses, comparing scenarios, and understanding which variables truly drive the final result. Microsoft Excel has made this approach familiar for years, with built-in tools such as What-If Analysis, Goal Seek, and Data Tables , as explained by Microsoft. IBM describes it as a strategic planning technique that starts with a baseline and builds scenarios based on different assumptions. If you want to shift from reacting to anticipating, here’s a practical guide, free of unnecessary jargon.

A sales manager decides whether to raise prices. A buyer wonders whether to order more inventory before the seasonal peak. A CFO needs to determine whether the forecast can withstand a delay in payments. In all three cases, the decision is never made in isolation, because every decision affects margins, cash flow, and operational timelines.
Italian SMEs often excel at responsiveness, but responsiveness alone isn’t enough when costs change or demand shifts rapidly. This is where the what-if analysis tool changes the way you think, because it forces you to make your assumptions explicit rather than relying solely on your gut feeling at the moment. It’s a step that’s simple only on the surface, but very powerful in practice.
IBM describes what-if analysis as a strategic planning technique that modifies the inputs in formulas to model different scenarios, and recommends starting with a baseline and building multiple scenarios based on different assumptions. This approach works well for small and medium-sized businesses because it makes comparisons concrete. You no longer ask, “What do I think will happen?” Instead, you ask, “What happens if this variable changes, and how much will it cost me to wait?”
Rule of thumb: If a decision can affect price, quantity, timing, or risk, it warrants at least one alternative scenario.
Many companies already have the right numbers in Excel, their ERP system, or their CRM. The problem is that those numbers remain isolated in separate spreadsheets, without a framework that shows possible future scenarios. A good scenario analysis method does just that: it links historical data to operational consequences.
If you’re still working with manual spreadsheets today, a practical guide to spreadsheet automation might also be helpful, because the real leap forward isn’t the spreadsheet itself—it’s the ability to make it work with fewer repetitive tasks. The result is a process that’s easier to understand, faster, and less dependent on the memory of the person updating the file.
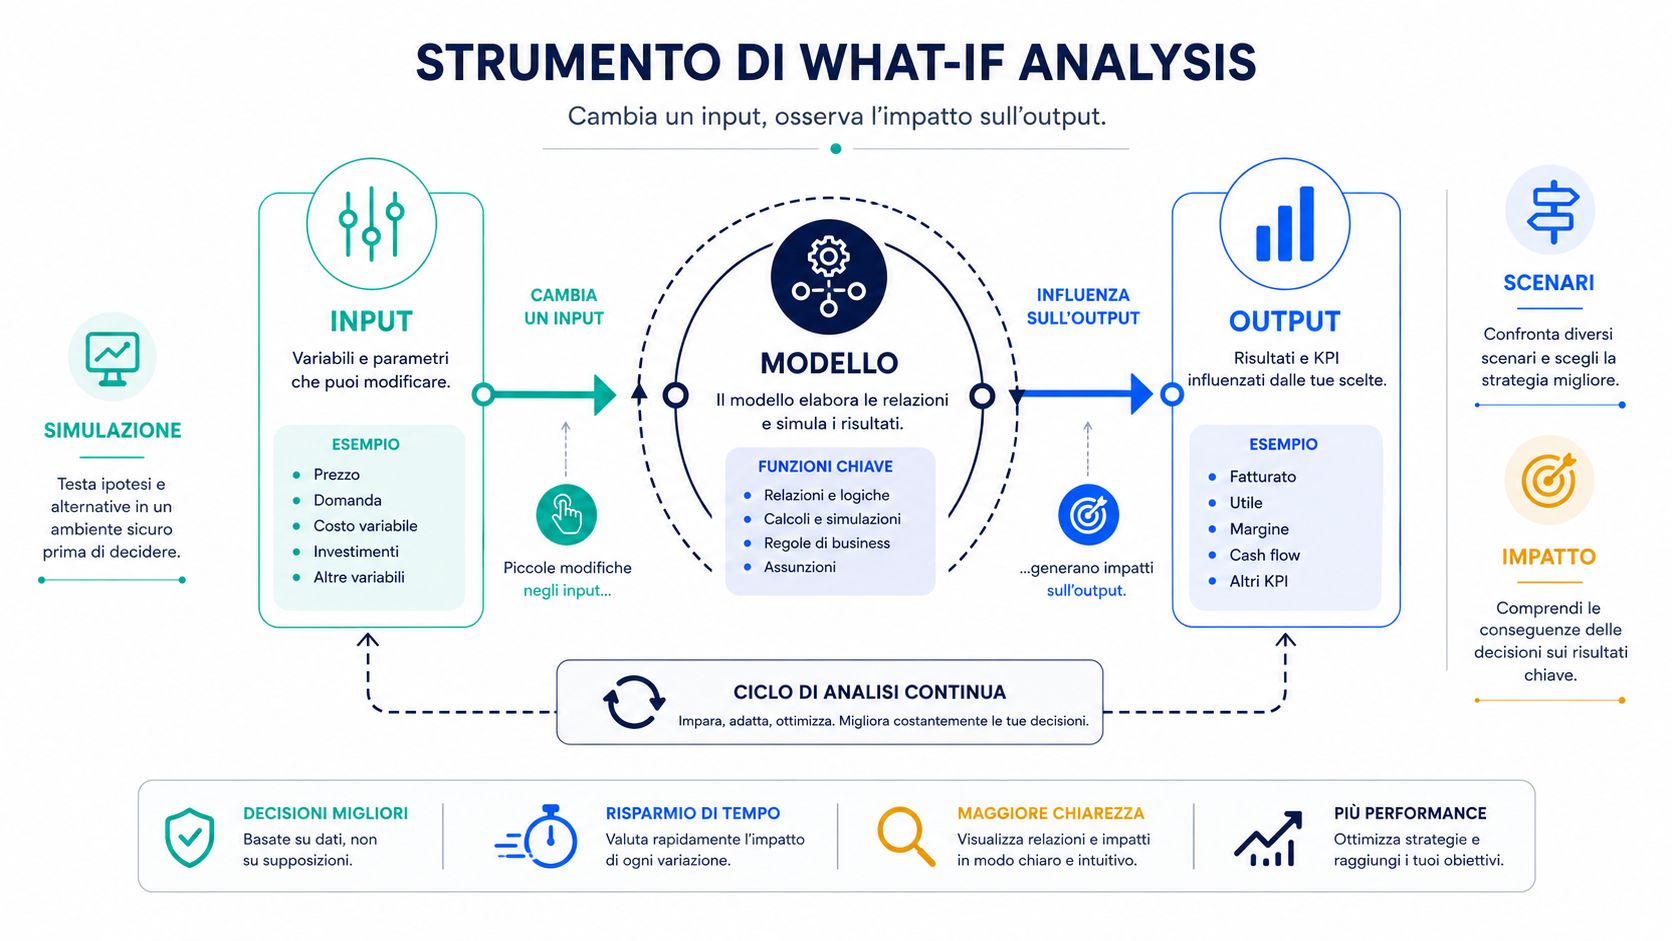
A "what-if" analysis tool is an environment that takes a model, changes one or more inputs, and shows how the outputs change. You don't need to think about it in technical terms to understand it. If you change the price, the system recalculates the margin; if you change the delivery times, it recalculates inventory coverage; if you change the interest rate, it recalculates the effects on the portfolio.
The mechanism consists of four very simple components.
This framework is more like a flight simulator than a static report. A pilot doesn’t actually try out every possible flight path in the real world; instead, he simulates the alternatives before choosing the safest or most efficient one. By the same token, you don’t need to “guess” the future—you need to see how the outcome changes when you pull a specific lever.
A forecast answers the question, “What will happen if I don’t change anything?” A “what-if” scenario answers the question, “What happens if I change something?”
SMEs often confuse the two concepts. A forecast extends the present; it starts with trends and attempts to estimate what will happen next. A “what-if” simulation, on the other hand, intentionally alters a scenario to measure the effect.
Microsoft explains that the What-If Scenario tool analyzes patterns in existing data and allows you to assess the effect of changes in one column on the value of another column, with variations that can be set as a specific value or as a percentage increase or decrease. This is the common foundation of any robust tool, from Excel to an AI platform. If you understand this concept, you’ll recognize the logic even when the interface changes.
A sales manager opens Excel to see how the margin changes if the price changes. Another manager, in finance, wants to determine what level of revenue is needed to cover a fixed cost. In both cases, the question is the same: the model changes one input and observes how the result changes.
Microsoft describes What-If Analysis as the process of changing values in cells to see how formula results change, and highlights three built-in tools: Scenarios, Goal Seek, and Data Tables. This foundation is important because it illustrates a simple point: scenario analysis didn’t originate with AI—it originated with everyday work in spreadsheets.
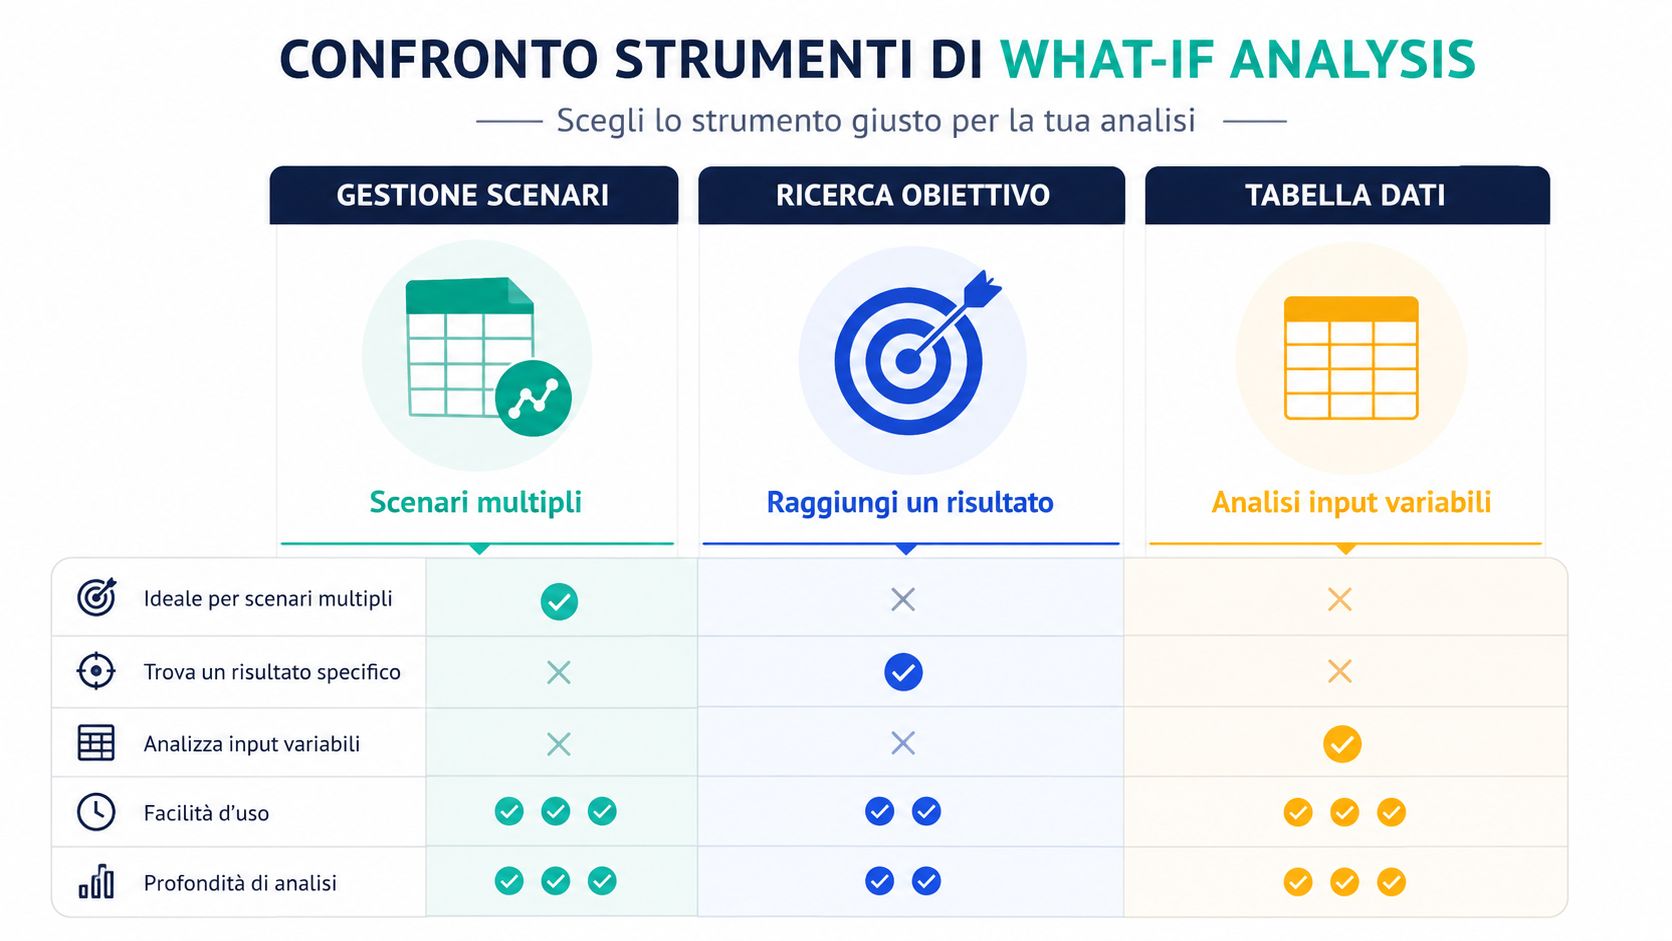
Scenarios are useful when you want to save multiple sets of inputs and compare the results. This is the right choice if you’re evaluating different plans—for example, a conservative, moderate, and aggressive approach. In a retail store, this might mean comparing a mild promotion, a moderate discount campaign, and a more aggressive price cut, without having to rebuild the model from scratch each time.
Goal-based analysis works in reverse. Start with the result you want to achieve and have the spreadsheet calculate the input value needed to get there. For an SME entrepreneur, this is useful when the end goal is clear—such as the minimum margin to maintain or the revenue needed to cover an expense—and you need to understand which price, volume, or conversion rate will make that goal possible.
Data tables are used to see how a model changes when one or two inputs vary. They are particularly useful when you want to quickly observe the effect of one lever at a time, or of two levers together, without having to build separate scenarios for each combination.
An independent technical guide to Excel explains that Goal Seek is used to find the input value needed to achieve a desired result, while Data Tables allow you to examine how changing one or two inputs affects a financial model, and Scenario Manager saves multiple sets of inputs so you can compare their outcomes (Corporate Finance Institute). In practice, these are three different ways of asking the same question, but with varying levels of control and detail.
For a small e-commerce business, the logic is immediately apparent. If the price rises and shipping costs increase, the model shows how the margin shifts. If the average customer reacts worse than expected, the more conservative scenario becomes more credible than the optimistic one. The ELECTE forecasting solution takes this logic beyond the spreadsheet, as it helps you monitor the impact of variables in real time instead of having to recalculate everything manually.
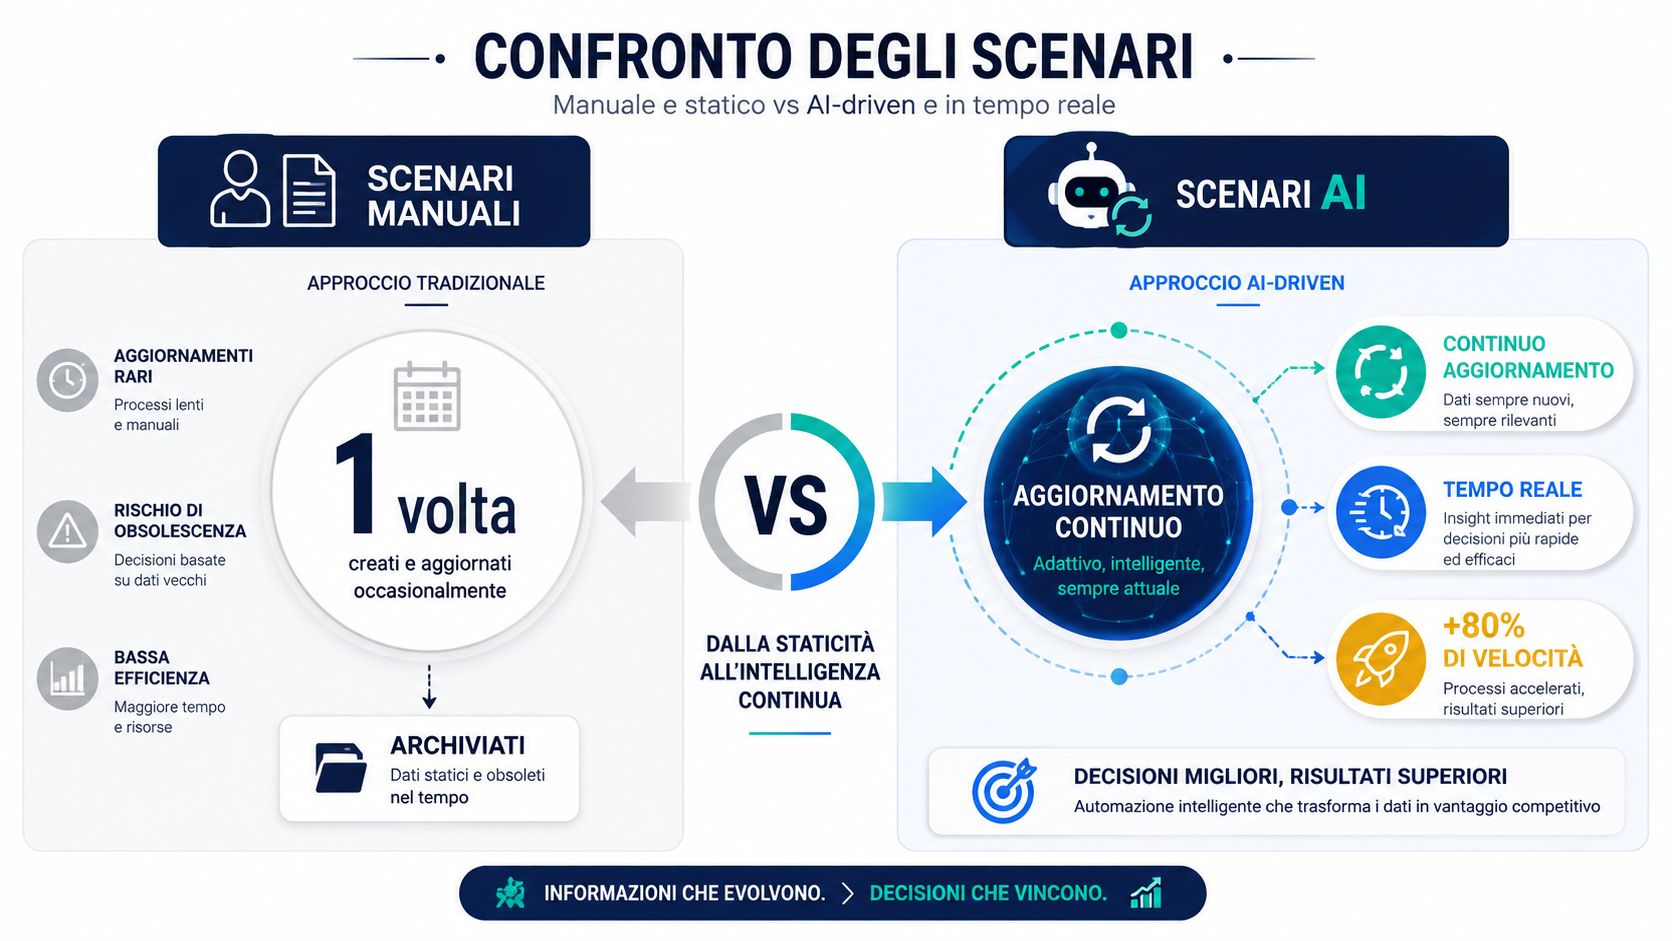
These tools are still manual. Every time the data changes, someone has to update cells, formulas, and comparisons. It works well for a few cases, but with frequent data flows, it becomes slow and unreliable.
Excel’s strength lies in the clarity of its mechanics. For many SMEs, however, its limitations become apparent when the number of variables increases and data is constantly being entered. This is where an AI platform like ELECTE can take that same logic to the next level, automatically updating scenarios and linking the spreadsheet to continuous scenario analysis—without requiring you to rebuild the model every time.
An SME immediately understands the value of a what-if analysis tool when it links it to a concrete decision: what happens if the price changes, if inventory moves more slowly, or if the cost of capital rises. In Excel, the basic logic remains as described by Microsoft—that is, measuring how a change in an input affects an outcome. Here, however, context is what matters most, because the model becomes useful only when it speaks the language of business.
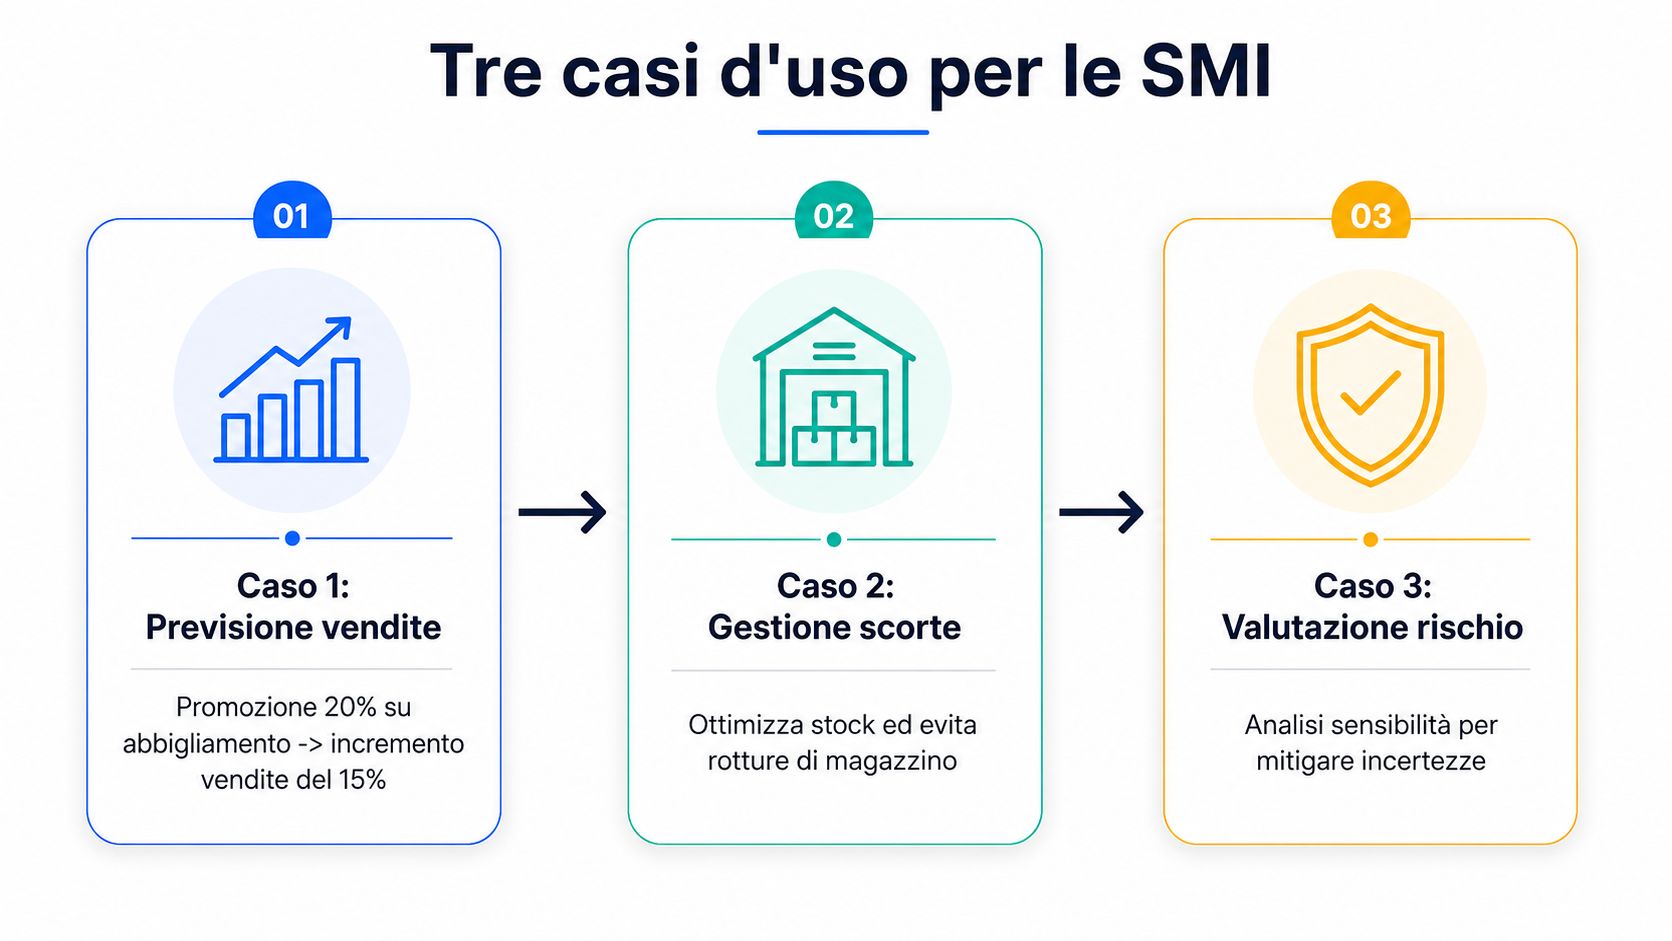
In retail, a clothing store can consider three very straightforward scenarios. If it runs an aggressive promotion, it lowers prices to boost sales volume. If it maintains a stable pricing policy, it protects its margin and observes the market’s reaction. If it raises prices, it protects its margin but may slow down inventory turnover. The point isn’t to choose the “right” number in the abstract; it’s to understand which lever actually changes the outcome and which, on the other hand, merely shifts the problem from one line item to another.
In the warehouse, an electronics retailer can apply the same logic to supplier lead times. If a reorder arrives late, the risk isn’t just about product availability—it’s also about cash tied up in inventory that sits idle. Here, comparing a conservative scenario with a realistic one helps identify where operational strain arises, much like a dashboard that shows in advance whether you’ll run out of fuel before reaching your destination.
In finance, a small service company can simulate the effect of an increase in interest rates on its customer portfolio and distinguish between the mildest and most severe scenarios. This makes discussions with management much more concrete. Rather than talking about risk in general terms, the company shows where it impacts the income statement and which areas require attention before others.
The same logic applies to those who still work with manual spreadsheets. Every update requires reworking cells, formulas, and comparisons, and the work drags on just when a quick response is needed. An AI solution like ELECTE’s forecasting solution can read the latest data and recalculate scenarios without having to redo everything by hand, so the comparison between best-case, worst-case, and most-likely scenarios stays up to date instead of getting stuck in a forgotten file.
Choosing a what-if analysis tool doesn’t mean going for the software with the most features. It means understanding how much time you currently spend updating scenarios, how much control you want to maintain over the model, and how much you need to rely on technical staff. For an SME, the right choice is often the one that reduces friction and makes the comparison immediately clear.
| Criterion | Excel Manual | AI platform, such as ELECTE |
|---|---|---|
| Ease of use | Good for simple cases, but requires practice with the formulas | More guided, with workflows designed for non-technical users |
| Integrations | Often manual, involving repeated exports and updates | Smoother integration with data sources and internal processes |
| Automation | Limited; the scenarios must be updated manually | Greater continuity, with scenarios that are recalculated based on new data |
| Transparency | Very high if you know how to read the file | It's true if the model is explained well, but it needs to be verified on a case-by-case basis |
| Scalability | It starts off well, but then slows down as the models get more complex | Best suited when data volumes are growing and continuous analysis is needed |
For me, the most important factor is this: how often you have to redo the work. If you open the file every week and correct data, formulas, and scenarios, the real cost isn’t the software—it’s the operational time that adds up. The decision should be based on that cost, not on the list price.
An AI platform like ELECTE—an AI-powered data analytics platform for SMEs—can be a useful solution when you want to automate reports, identify trends, and turn data into insights with fewer manual steps. If you’re evaluating different solutions, the guide at ELECTE on AI costs can also help, because the issue isn’t just whether to buy or build—it’s about understanding how much complexity you want to manage in-house.
Always ask whether the tool updates the scenarios on its own, whether it integrates with your actual data, and whether it explains why the results change. If the answer is vague, you risk buying a tool that looks good but isn’t very useful. For an SME, the clarity of the model is almost as important as speed.
A traditional spreadsheet produces one-time scenarios. You build them, display them, and save them. Then a week goes by, new data comes in, and you have to start all over again. The value of automation isn’t just about going faster; it’s about maintaining continuity between one decision and the next.
An AI agent that monitors incoming data changes this very workflow. It detects anomalies, updates the model, and regenerates scenarios without you having to reopen the file and correct everything manually. The repetitive work shifts from the team’s desk to an always-on process that runs while you make decisions.
For an SME, this has three clear effects. Reporting requires less operational time, because you don’t have to recalculate the same comparisons every time. Trends emerge sooner, because the model doesn’t wait for a manual update. Decisions are made more quickly, because the comparison between scenarios is always up to date.
The human role doesn't disappear. It changes: less of an operator, more of a decision-maker.
The legitimate question is simple: Do we still need someone to interpret the results? Yes, of course. AI doesn’t replace managerial judgment, but it eliminates much of the routine work that slows down decision-making. For a small team, this means making better use of the time of those leading sales, finance, or operations.
What-If analysis doesn’t eliminate risk; it makes it visible and manageable. This is its true value for an SME, because it transforms the future from a vague hypothesis into a set of clear alternatives. If you start with a single decision and a single variable, you build confidence without overcomplicating things.
ELECTE helps you transform scattered data into clear scenarios, with automated reports, clear trends, and forecasts that update without repetitive work. If you want to move your what-if analysis tool away from manual spreadsheets and into a continuous decision-making workflow, visit ELECTE and see how you can apply it to your business data.

.svg)


.svg)
.svg)