Databox Alternatives for SMBs: Top 10 Picks for 2026
Comparing the 10 best Databox alternatives for SMBs, with pricing, pros and cons, ideal use cases, and a top pick for AI-powered, no-analyst analytics.

Are you searching for Databox alternatives because KPI dashboards alone don't explain what's changing, or because the bill looks different once more people, clients, and data sources get added? That's the right question to ask before you compare feature lists. A dashboard can show a falling margin, a rising ad cost, or a cash dip. It can't always tell you why it moved, what happens next, or who should act first.
This guide compares 10 Databox alternatives on pricing, free tiers, ideal use cases, and honest limitations. Every option gets judged on three selection questions that matter in practice. First, how fast can you connect data and trust the first report? Second, who can use it without training, an analyst or the manager who owns the number? Third, what will licensing cost as usage grows, not just in month one?
1. ELECTE
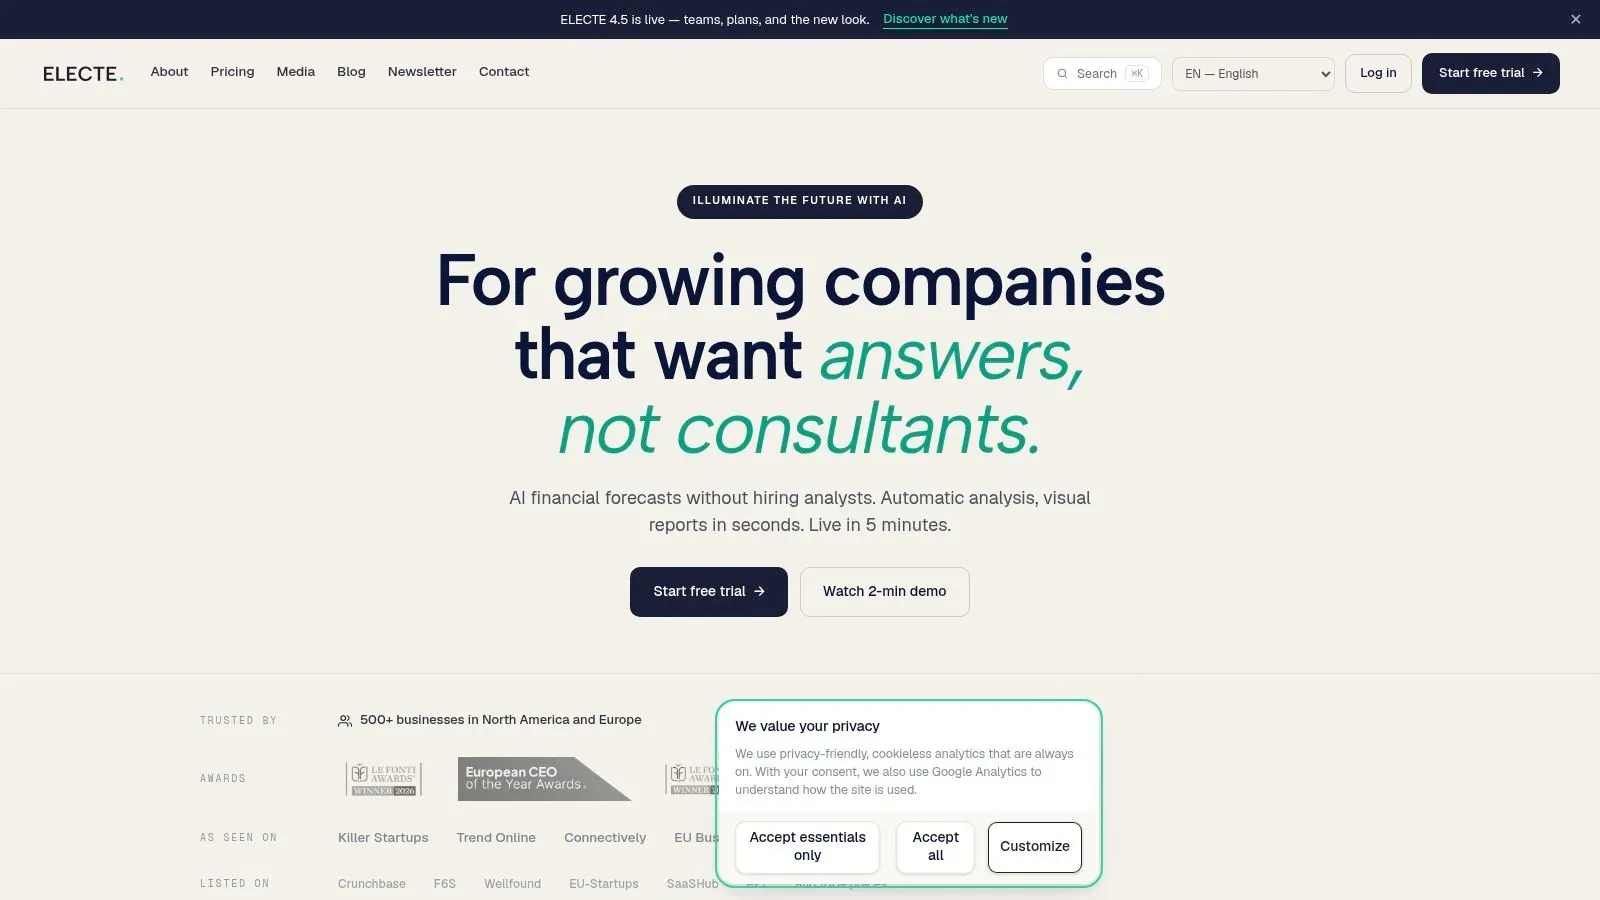
ELECTE is an AI-powered data analytics platform for SMEs that want forecasts and recurring reports without hiring an in-house data team. You connect accounting tools such as QuickBooks and Xero, pick from 75+ integrations, or upload an Excel file, and the dashboard centralizes accounting, banking, and spreadsheet data kept current without repeated exports. It is positioned as a replacement for spreadsheets, manual reporting, consultants, and BI tools that need specialist setup.
On the three selection questions, connection speed is its strongest answer. Linking accounts and data sources takes 5 minutes, with no integration project or technical setup required. The Microsoft Teams integration pulls two years of history on first sync, supports multi-entity and multi-currency setups, and keeps read-only access so the platform never writes to the source. The dashboard projects the full balance sheet forward, and visual views cover forecasts, cash flow, and trends you can export or share with a team in one click.
Where It Goes Beyond KPI Tracking
An autonomous AI Agent monitors business data continuously, flags anomalies, and surfaces trends, working like a dedicated analyst rather than a chatbot. That answers the "who can use it" question directly: managers get data analysis without an analyst on staff, and can pull numbers without asking anyone to build a report. Use cases include automated reporting, board packs and monthly close, cash, payroll and demand forecasting, and dashboards and KPIs.
- Pros: Automated forecasts, cash-flow predictions, and recurring reports cut manual work. API access pulls data and forecasts into your own systems, and an MCP Server connects the data to AI tools.
- Trust signals: Customer data hosted in Germany, GDPR compliance, two-factor authentication, and user permissions with access levels.
- Cons: Enterprise pricing is custom, and forecast quality still depends on complete, clean source data feeding the models.
On licensing as usage grows, the main variable to watch is data history: Starter includes 90 days, while Business and Enterprise include unlimited history. Current plans and rates are on the ELECTE website. For a non-technical SME, I recommend starting here.
2. Microsoft Power BI
Power BI suits teams that have outgrown KPI tiles and want proper data modeling. It turns data from business systems, spreadsheets, and databases into interactive reports, and it's the natural step up if you already live in Excel, Microsoft 365, Azure, or Fabric. Connection speed is fast for Microsoft sources, slower when you're cleaning messy operational data before anyone can model it.
The skill question is where Power BI bites. Viewers find published reports easy enough, but someone has to build the semantic model, write DAX measures, and manage refreshes. If you don't have that person, reports stall or metrics drift between files.
Practical rule: Budget for the model owner, not just the licenses. A cheap seat doesn't help if nobody maintains the measures behind the dashboard.
- Pros: A free account lets you create reports, modeling depth goes far beyond Databox-style monitoring, and integration with Microsoft's ecosystem is tight.
- Cons: Publishing and sharing generally require paid licensing, DAX takes time to learn, and licensing gets complicated when you distribute reports widely across departments or external users.
Pricing lists Microsoft Power BI Pro at $14 per user per month and Premium Per User at $24 per user per month, billed yearly. Per-user maths looks kind at five users and less kind at fifty viewers, so model your actual audience before committing. If Tableau is also on your list, compare Power BI and Tableau before you trial either one.
3. Tableau
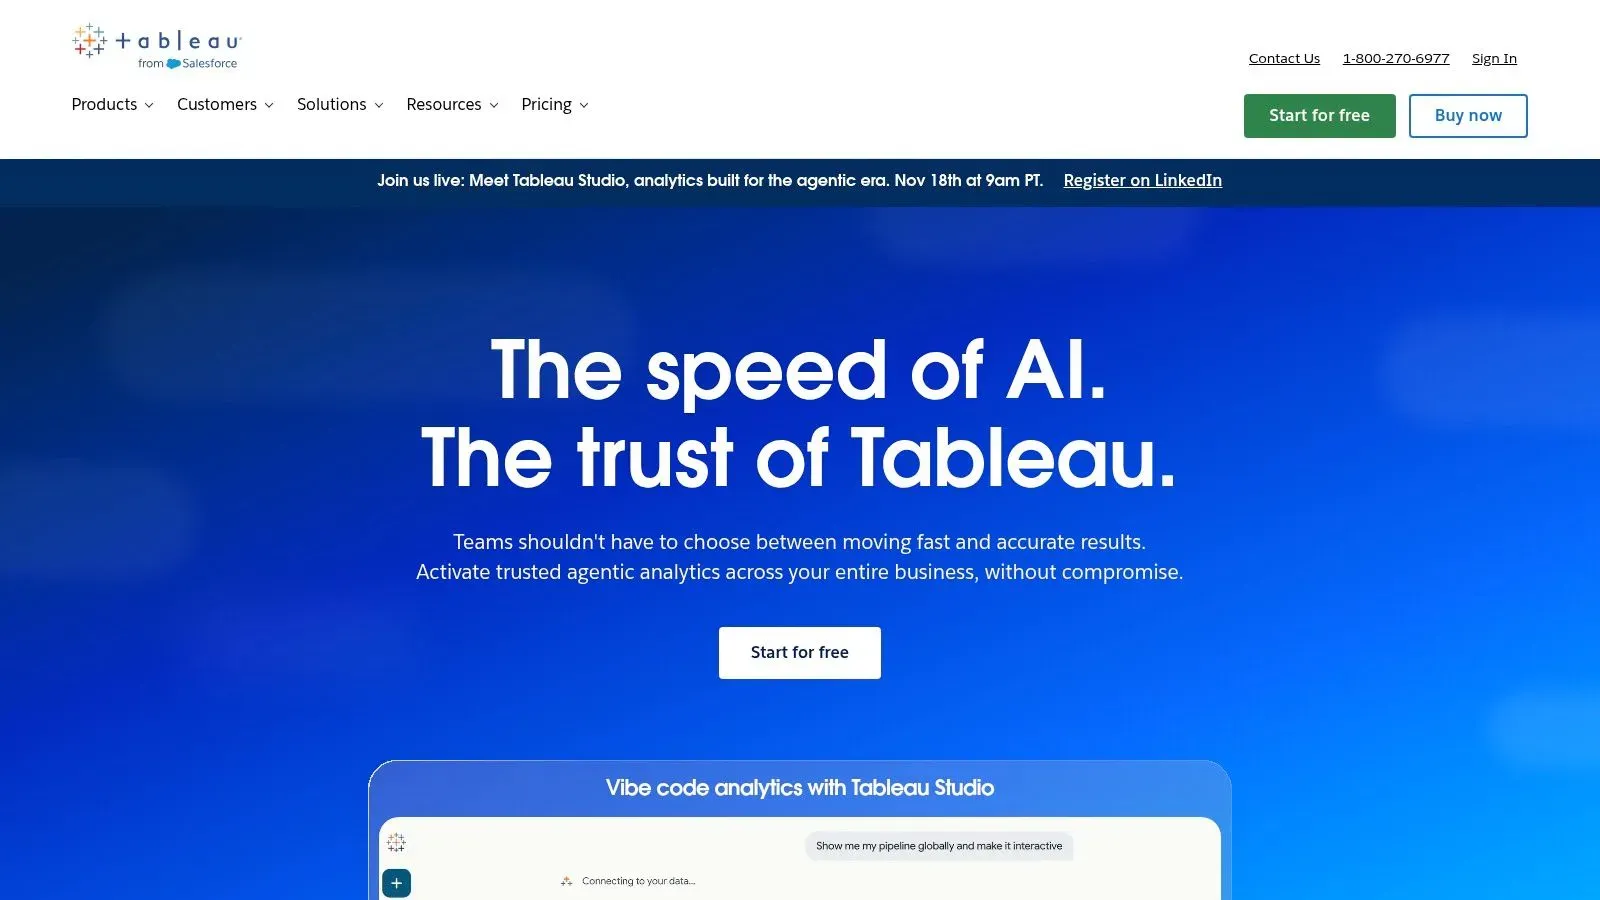
Choose Tableau when exploration matters more than speed to a fixed KPI board. Analysts use it to investigate data visually, build custom dashboards, and answer follow-up questions that a prebuilt Databox tile can't handle. Executives consume the finished views, while creators do the heavy lifting on calculations and layout.
That division of labour is the honest trade-off. Tableau rewards teams building a real analytics practice, and it frustrates small teams that just want Tuesday's sales by region without a project. Browser-based authoring and collaboration help, and Tableau Pulse pushes metrics and insights to users instead of waiting for them to open a dashboard.
Cost and Learning Curve in Plain Terms
- Pros: Visual analysis and dashboard customization are excellent, multiple license types match creators, explorers, and viewers to different roles, and cloud deployment keeps infrastructure off your plate.
- Cons: It's more involved to learn and administer than a simple dashboard tool, choosing editions and roles takes planning, and per-user licensing adds up as the audience grows.
A free trial is available, and Tableau Cloud Standard starts at $15 per user per month with Enterprise at $35 per user per month, billed annually. Run the numbers at your expected viewer count in year two, not your pilot group. If nobody on the team wants to own workbook design, pick a lighter tool.
4. Zoho Analytics
Zoho Analytics fits SMEs that want a complete self-service workspace without enterprise BI overhead. It combines data integration, preparation, reporting, and analytics in one product, and it makes most sense if you already use Zoho apps. You connect business applications, databases, files, and cloud sources, blend the data, then build drag-and-drop reports.
Non-technical users can assemble dashboards from prepared tables, but someone still needs to configure sources and joins the first time. That's a reasonable trade for the breadth on offer, which includes forecasting, trend analysis, anomaly detection, and AI-assisted analysis depending on your plan.
Adoption evidence supports that middle path. The OECD 2025 D4SME policy highlights found 39% of surveyed SMEs used at least one AI application, up from 26% in 2024, yet many still lack specialist teams. Tools that automate preparation while keeping reporting simple match how those firms work.
- Pros: Paid plans include unlimited reports and dashboards, public pricing makes evaluation easy, and the feature set covers blending, reporting, and analysis.
- Cons: User and row limits apply by plan, advanced AI isn't on every tier, and initial configuration takes longer than connecting a KPI-only tool.
The free plan on Zoho Analytics supports two users, 10,000 rows, and five workspaces, while paid plans start at $24 per month billed annually for two users and 0.5 million rows, with a 15-day trial. Watch row growth if you sync transaction-level data.
5. Google Data Studio
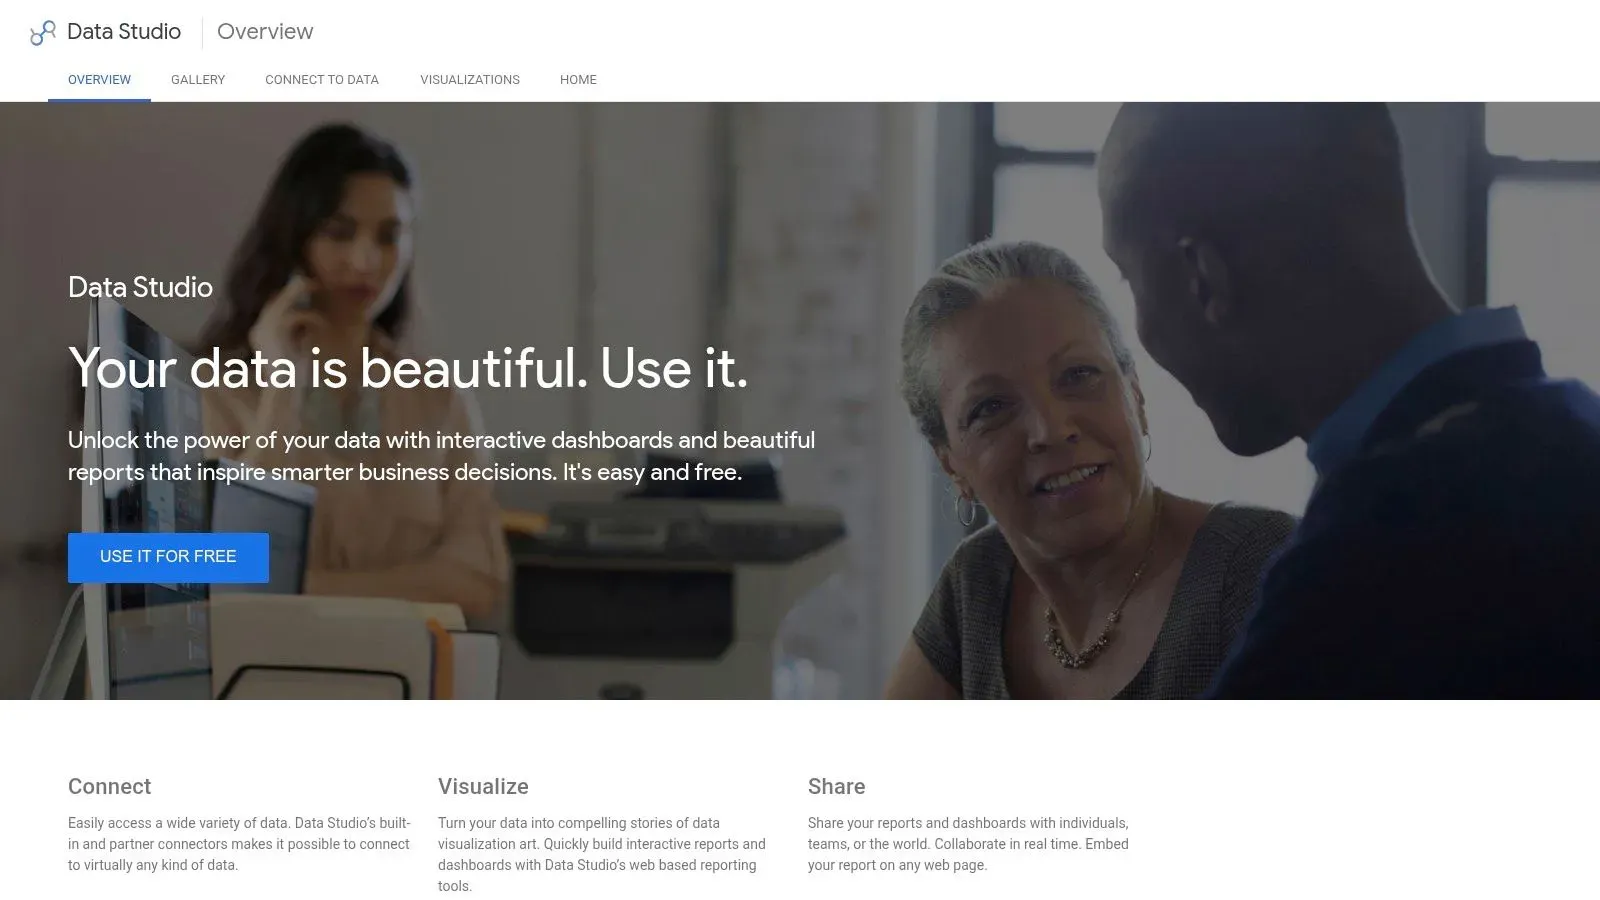
Say your reporting need is simple. A marketing manager wants Google Ads, Analytics, and Sheets data in one shareable page, updated without screenshots. Google Data Studio, previously known as Looker Studio, does that job at no cost and asks almost nothing from your IT team.
The drag-and-drop editor, interactive charts, and filters are easy for non-technical users to pick up. Sharing and embedding work the way Google users expect, so clients and managers open the reports. Where it stops helping is analysis. Blending several sources into a trusted dataset gets cumbersome, and the tool won't monitor your metrics, explain an anomaly, or forecast next quarter for you.
A free dashboard that nobody trusts is still expensive. The cost shows up in manual checks, duplicate spreadsheets, and arguments about whose number is right.
- Pros: The standard edition is free, Google-centric marketing dashboards come together quickly, and you don't need a BI development project to share polished reports.
- Cons: It's primarily reporting and visualization rather than autonomous analytics, complex blending strains the tool, and enterprise management requires the Pro edition.
The standard edition of Google Data Studio is free, while Data Studio Pro adds team and enterprise management capabilities with pricing not listed in the product overview. Treat it as your free baseline. Any paid alternative should beat it on preparation, automation, or insight, not just prettier charts.
6. Metabase
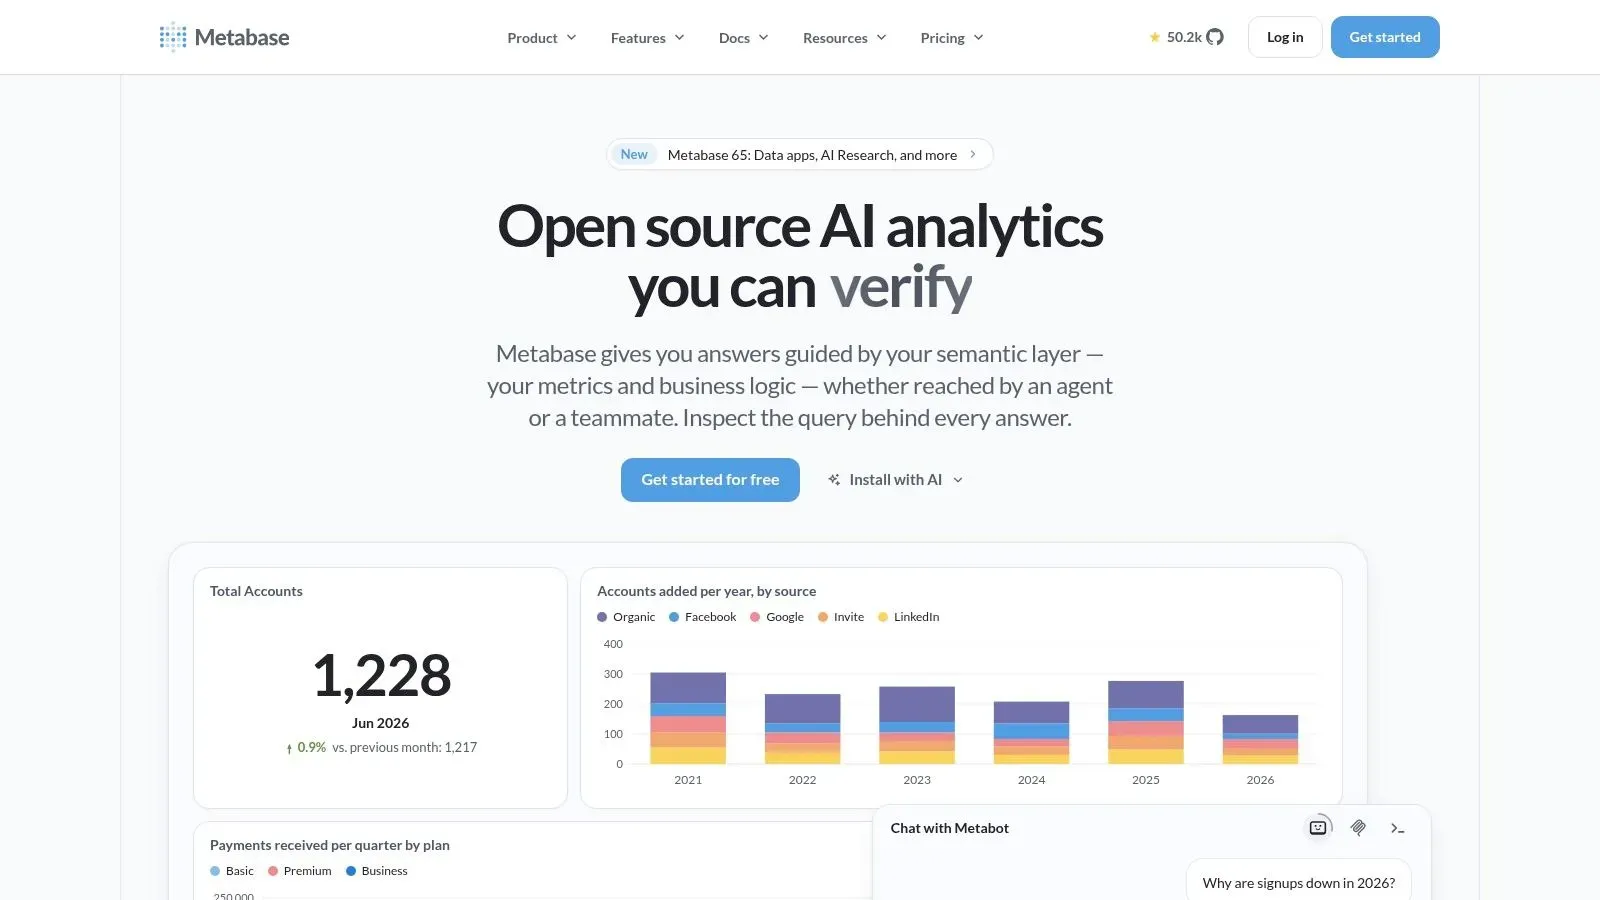
Metabase works when your data already sits in a database and your team wants to ask its own questions. Non-technical users build questions with a visual query builder, analysts drop into the SQL editor, and both share results as dashboards. That bridge between no-code exploration and SQL is its strongest selling point.
Setup speed depends entirely on data readiness. Point it at a clean Postgres or warehouse schema and you're exploring within the hour. Point it at scattered SaaS exports and you'll stall, because Metabase expects organized database tables rather than offering broad app connections like a KPI dashboard tool. For wider context on that self-service model, see the best analytics platforms for SMEs.
- Pros: The open-source edition is free with unlimited users, managed cloud removes hosting work, and AI-assisted questions and SQL generation help depending on setup and plan.
- Cons: Self-hosting makes you responsible for infrastructure, backups, and upgrades, and paid plans charge by user so costs climb as logins spread beyond the data team.
The BARC BI & Analytics Survey 25 methodology, drawn from 1,136 users, judges tools on actual business-user creation and ease of use, which is the right test for Metabase in your trial. Pricing lists Metabase Cloud Starter at $100 per month for five users and Pro from $575 per month.
7. Geckoboard
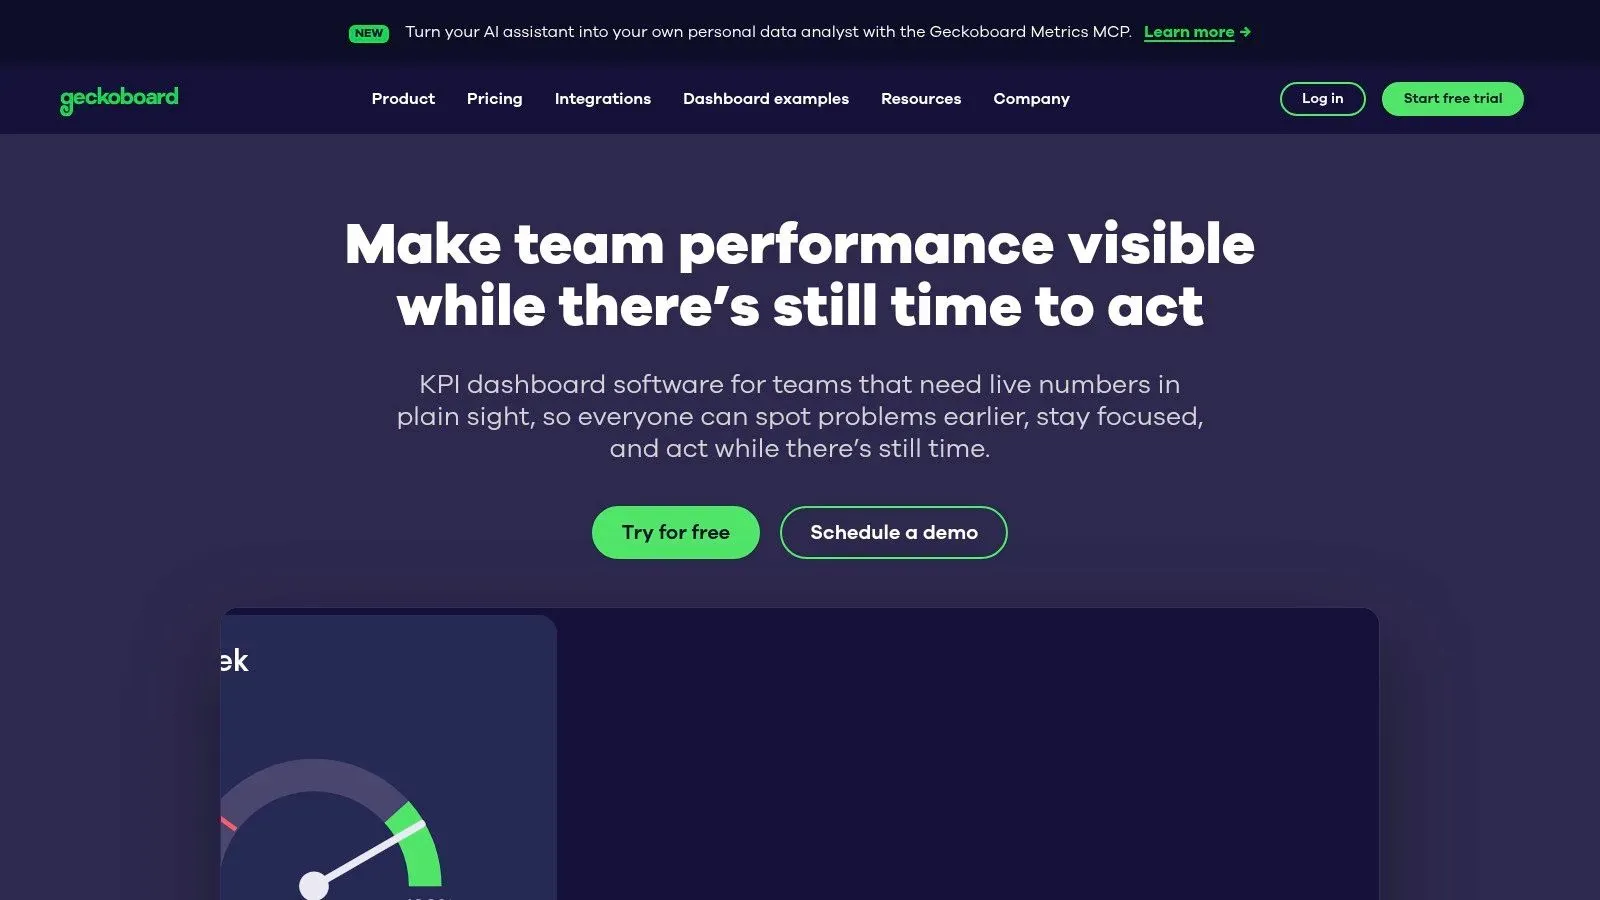
Geckoboard is the closest like-for-like swap if you love Databox's live wallboard idea and just want it cleaner. It builds clear, automatically refreshing KPI dashboards for shared screens and team visibility, with TV display management and dashboard rotation built in. Nobody needs training to read it, which is the point.
Editing is the constraint. The entry plan narrows who can build and how much they can build, so a growing team hits the ceiling faster than expected. Snapshots to Slack, Microsoft Teams, or email keep remote staff in the loop, and higher tiers add alerts, drilldowns, and source-data investigation for people who need to chase a number. If scheduled delivery matters to you, compare reporting tools with scheduling and alerts.
- Pros: It's purpose-built for at-a-glance operational visibility, unlimited viewers are included across listed plans, and setup against common business tools is quick.
- Cons: It isn't suited to deep analytics, complex preparation, or statistical modeling, so analytical questions quickly outgrow it.
Essentials on Geckoboard starts at $79 per month with one editor and two dashboards, while Performance starts at $319 per month, billed annually, with a free trial available. That jump between tiers is the decision. If you need Performance features in month two, you're really buying the $319 plan, so trial with your real dashboard count.
8. Klipfolio PowerMetrics
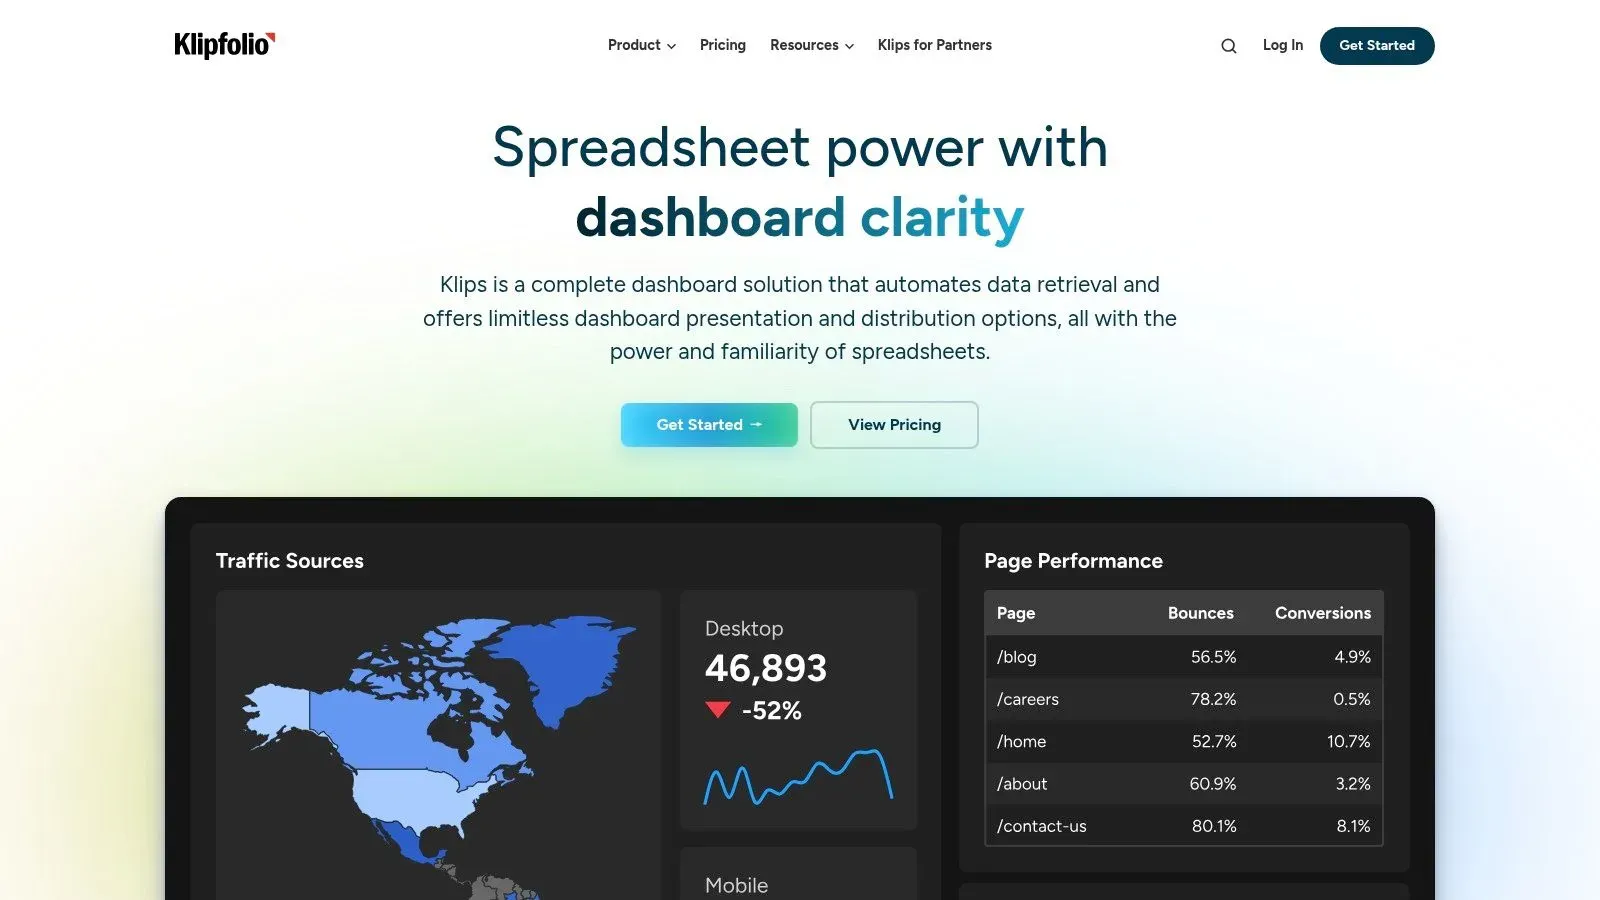
Ask how quickly a team can get governed metrics live, and Klipfolio PowerMetrics answers differently than a dashboard-first tool. You define metrics once, connect services and APIs, join data where needed, then share dashboards with internal teams or clients. Agencies repeating the same KPI pack across accounts will recognize the appeal, and the template gallery plus PDF reports speed up client delivery.
The “who can run it” answer splits by role. Viewers and clients get clean outputs, while the people building joins and maintaining metric definitions need some data comfort. If nobody owns that layer, the same strength becomes setup debt.
Licensing is where growth bites. Dashboard counts and refresh frequency define the tiers, so a pilot that feels roomy can turn tight once every department wants its own board refreshing hourly. Higher tiers add published links, scheduled reports, SSO, and faster refreshes. Unlimited users in listed business plans keeps audience growth predictable, but dashboards and refresh cadence still meter real usage.
A CostBench Databox alternatives comparison lists tools from $11.25 to $44.90 per user monthly up to $500 to $5,000 monthly for warehouse-oriented analytics, which shows how misleading simple price rankings get. Add connector maintenance and metric rebuilding time before calling any option cheap. Listed plans on Klipfolio run from $120 per month for Base, refreshing every four hours, to $600 per month for Team+, billed annually.
- Pros: Built-in client reporting suits agencies, and shared metric definitions keep repeated KPI work consistent.
- Cons: Dashboard limits apply by plan, and the emerging AI analyst is not yet generally available.
9. Domo
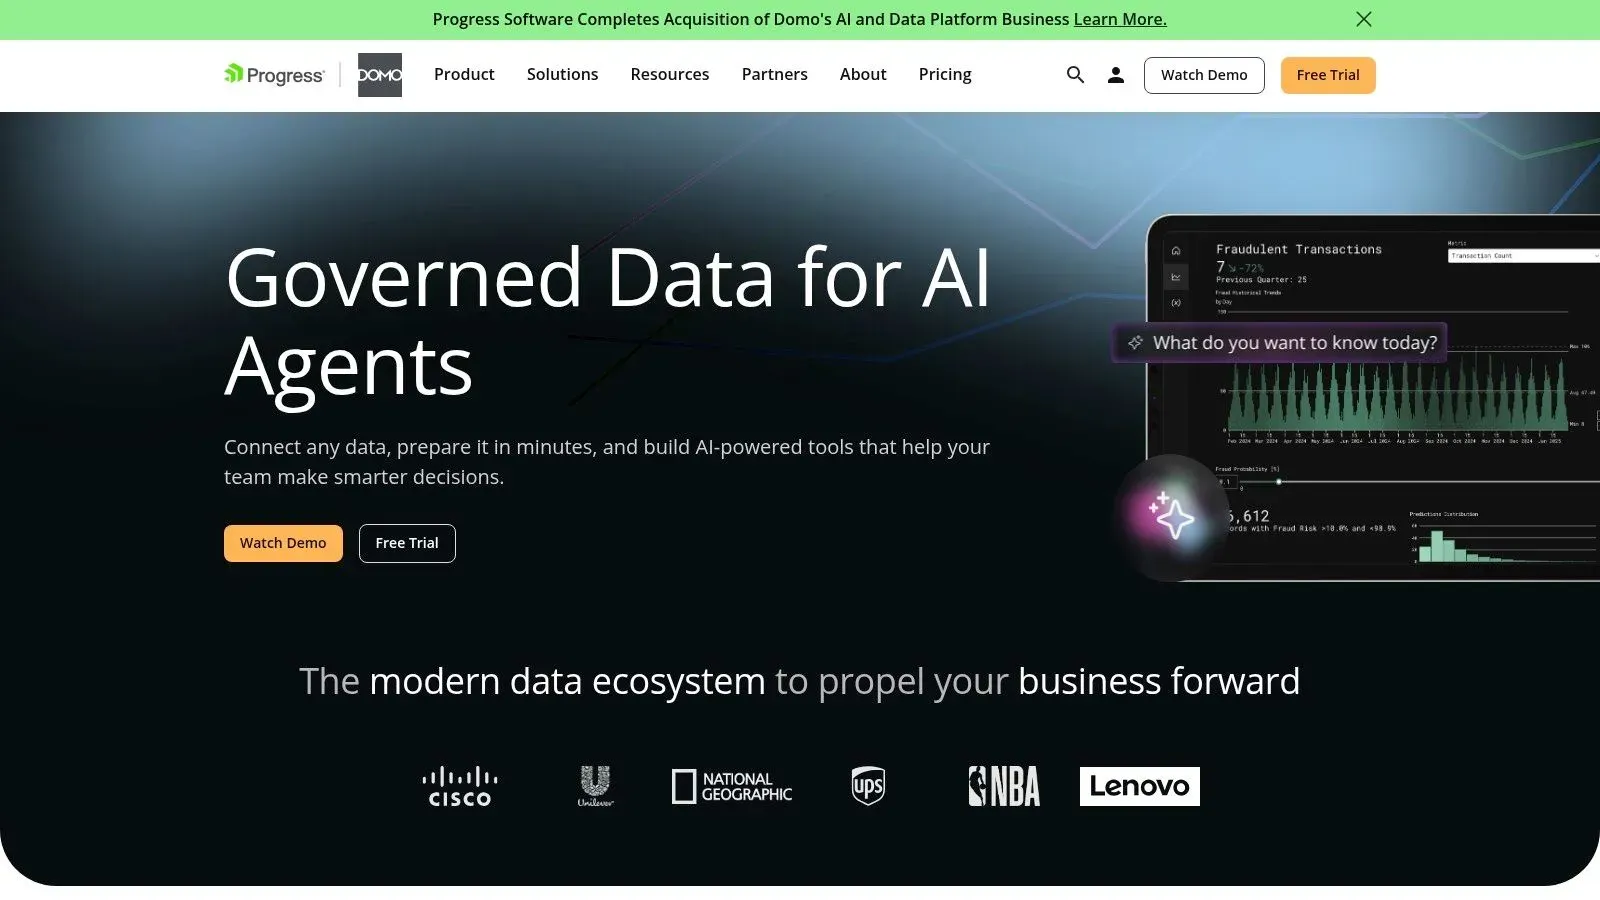
Domo is a full cloud data platform, not a dashboard add-on. Integration, preparation, dashboards, workflows, and AI and machine-learning capabilities sit in one system, which suits organizations consolidating several tools at once. For a small team tracking a dozen KPIs, that's more platform than the job requires, and you'll pay for capacity you never touch.
The consumption model changes how you evaluate it. Credits get consumed by storage, data updates, workflows, and some advanced features, so costs follow activity rather than headcount. That can favour wide viewing audiences, but only if you estimate refresh volumes accurately during the trial instead of discovering consumption patterns on the first invoice.
Governance deserves the same scrutiny as features. A Whatagraph Databox alternatives roundup reflects how most comparisons organize tools around dashboards and integrations, with little evidence on alert precision, lineage, or human review. Ask Domo, and every vendor here, how an automated insight gets explained, approved, and audited before it drives spending.
- Pros: The pricing model advertises unlimited users, one platform covers preparation through operational workflows, and onboarding support comes with trial access.
- Cons: Custom, credit-based pricing makes direct comparison with fixed-price tools harder, and small businesses may not use enough of the platform to justify it.
Domo offers a 30-day free trial, with ongoing pricing custom and based on credit consumption.
10. Google Looker
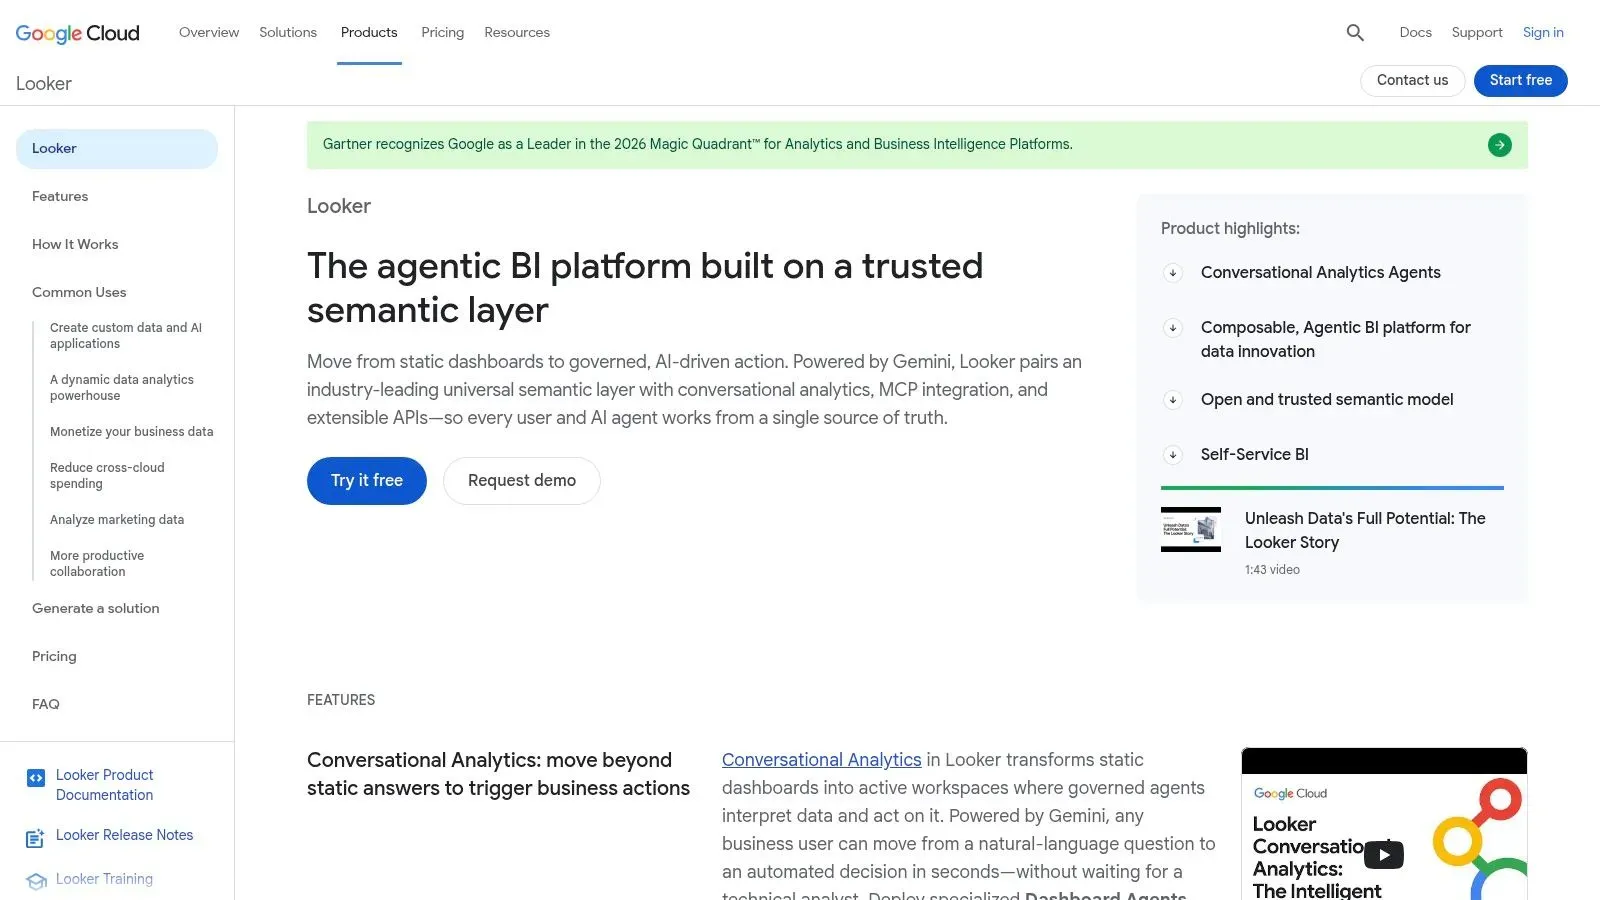
Don't confuse Looker with the free Data Studio tool listed earlier. Looker is Google Cloud's governed BI platform, built around LookML, a modeling layer where you define metrics once and every dashboard reuses them. Finance, sales, and operations stop arguing about whose revenue definition is correct because the logic lives in one place.
That governance has a price in people, not just licenses. Someone technical has to build and maintain the models, manage permissions, and administer the platform. Business users then explore safely on top of governed definitions, with scheduling, alerting, APIs, and embedded analytics available for operational use cases.
Regulated teams should weigh that control seriously. The European Commission AI Act implementation timeline puts Article 50 transparency requirements into application on 2 August 2026, with high-risk obligations covering log recording, data governance, and human oversight. Audit trails and explainability belong on your evaluation scorecard now, not after procurement.
- Pros: Standardized metric definitions across departments, strong governance and permissions, and in-database analytics through Google Cloud integration.
- Cons: It requires real investment in modeling and administration, and quote-based pricing with platform and user components suits larger organizations better than small teams.
Pricing for Google Looker is custom and annual. I recommend it when metric consistency across many teams is your core problem, and not when you need dashboards by Friday.
Databox Alternatives at a Glance
Entry price is only one axis. Scan the table for the licensing model, the free entry point, and the workload each platform handles best.
Platform | Starting price | Free plan or trial | Best for |
|---|---|---|---|
ELECTE (Recommended) | Transparent tiered pricing; see website | 7-day trial | AI-powered financial forecasting and automated reporting |
Microsoft Power BI | $14/user/month | Free account | Flexible BI and reporting, especially in the Microsoft ecosystem |
Tableau | $15/user/month | Free trial | Custom visual analytics and interactive dashboards |
Zoho Analytics | $24/month | Free plan and 15-day trial | Self-service analytics for small and midsize businesses |
Google Data Studio | Free | Free standard edition | Google-centric reporting and shareable dashboards |
Metabase | $100/month for cloud; free self-hosted edition | Free open-source edition | Database exploration for teams using visual queries or SQL |
Geckoboard | $79/month | Free trial | Live KPI dashboards for teams and shared screens |
Klipfolio PowerMetrics | $120/month | No free trial listed | Defining and sharing business metrics with predictable user access |
Domo | Custom pricing | 30-day free trial | Cloud data integration, dashboards, and analytics in one platform |
Google Looker | Custom pricing | No free trial listed | Governed BI and consistent metrics across teams |
Per-user pricing on tools like Power BI and Tableau grows with every added viewer, while flat monthly plans cap that expansion and custom quotes require a sales call before you can budget. ELECTE is the pick for non-technical teams: data sources connect in 5 minutes, and the platform runs the analysis without a dedicated analyst.
How to Choose Your Databox Alternative and Make the Switch
Match the tool to the three questions, in order. For setup speed, spreadsheet-and-accounting teams get live fastest with ELECTE or Geckoboard, Google-centric marketers with Data Studio, and database-ready teams with Metabase. For the skill requirement, ask who maintains the metrics after launch: Power BI, Tableau, and Looker all need a named owner who understands modeling, while ELECTE, Zoho, and Klipfolio put more of that work on the platform. For cost at scale, multiply per-user pricing by your year-two audience, check dashboard and row caps on flat plans, and estimate credit consumption before signing anything usage-based.
Order matters because deployment is not adoption. A 2025 global survey of 235 professionals across 38 countries found 43% of organizations already running AI-powered analytics in production, yet only 8% of employees in most firms used advanced analytics tools. Judge each shortlisted tool by weekly active users outside the data team, time to first trusted insight, and whether generated alerts lead to documented actions in inventory, sales, or cash reviews.
Data readiness decides more migrations than features do. The Evanta CIO Leadership Perspective Survey reported that 76% of CIOs named enabling data-driven decisions their primary goal, while 54% cited data quality and availability as the main obstacle. So start your switch with an audit, not a purchase. List the metrics people check weekly, the sources behind them, and which Databox boards nobody has opened in a month. Rebuild only what survives that list.
Key Takeaways for a Clean Migration
- Audit first: Document each live metric, its owner, its source system, and its refresh need, then retire duplicate or vanity dashboards before you move anything.
- Test head to head: Run two shortlisted tools on the same dataset and the same five reports, and time how long a non-technical manager needs to answer a real question unaided.
- Validate sharing early: Test permissions, scheduled delivery, and viewer costs with your real audience, because licensing surprises usually appear at rollout, not in the demo.
- Check the exit: Confirm you can export data, metric definitions, and reports, so today's alternative doesn't become tomorrow's lock-in problem.
Broader momentum favours acting now rather than waiting for a perfect stack. The OECD SME AI adoption report shows AI use in businesses with at least 10 employees rose from 5.6% to 14% between 2020 and 2024, so competitors are building these habits already. Start with one narrow, high-value use case, prove it in a recurring meeting, then expand. You can also compare analytics tools side by side to sanity-check your shortlist.
For SMEs and non-technical teams, my recommendation stands. ELECTE, an AI-powered data analytics platform, produces one-click reports, visual forecasts, and cash-flow views, and its autonomous AI Agent monitors your data and prepares recurring analysis without an analyst on staff. It connects in five minutes: link QuickBooks, Xero, and your other data sources, or upload an Excel file, with no integration project required. Run the five reports from your audit on your real numbers, and you will know within one working session whether it answers your three questions better than the dashboard you are leaving.
Ready to move past static KPI tiles and put forecasts, automated reports, and an AI Agent on your actual numbers? Connect QuickBooks, Xero, or a spreadsheet to ELECTE in five minutes, run your five audit reports, and see your first cash-flow forecast and board-ready report today.
Comments
No comments yet — start the conversation.