5 Examples of Conceptual Models for Business Analytics
Explore 5 examples of conceptual models for business analytics, from ER diagrams to star schemas, and see how to apply each one.

Your retail manager asks why the same promotion works in one region and fails in another. Sales reports show revenue, discounts, and units sold, but nobody can explain whether the difference comes from customer behavior, product availability, or how stores ran the offer. You could add another dashboard, but it would still leave the relationships unclear.
The problem is rarely the dashboard alone. It's the missing blueprint behind the data: what each record represents, which factors might affect results, and what evidence would justify changing your approach. A conceptual model makes those assumptions explicit before you automate reporting or act on an AI-generated recommendation.
These five examples of conceptual models give you different ways to build that blueprint. They cover data relationships, program outcomes, business strategy, analytical structure, and technology adoption. Each answers a distinct business question, starts with a manageable sketch, and has a clear limitation. You don't need to become a database architect or researcher to use them. You need a decision worth improving and a willingness to test the assumptions behind it.
1. Entity-Relationship Models Clarify the Data Behind Business Analytics
Business question: Which customers buy which products, and can you trust the connections between those records?
An entity-relationship model, usually shortened to ER model, maps the things your organization tracks, their attributes, and their relationships. The MariaDB conceptual-design guide explains this separation between business concepts and database implementation, including optional, mandatory, and different relationship cardinalities.
For an online retailer, start with Customer, Order, Order Line, and Product. A customer places orders; an order contains order lines; each order line refers to a product. Keeping Order Line separate carries real weight here, because customers buy different products and quantities in a single order. Collapse those lines into the order record and you lose the detail a basket analysis runs on.

Start With Relationships, Not Imported Tables
Write the relationships in plain English before drawing boxes. Ask someone in sales or operations to challenge them, especially where cancellations, guest checkout, returns, or shared accounts complicate the picture. Guest checkout alone forces a real choice about whether an order can exist without an identified customer.
- Define identity: Specify what uniquely identifies each customer, order, and product. Confirm that identifiers remain unique when you combine systems.
- Mark participation: Decide whether an order can exist without an identified customer and whether every order must contain an order line.
- Test a complete journey: Trace a purchase through payment, shipment, cancellation, and refund. Missing relationships surface fastest here.
Then translate those plain-English statements into a diagram your analysts and developers can review together. Fixing a wrong box on a whiteboard is cheap. Fixing the same mistake inside a shipped report is expensive.
Where it breaks down: An ER model describes structure. It records that a customer bought a product, while the question of whether an email caused that purchase needs causal analysis the diagram cannot supply.
Practical rule: Before trusting a joined report, check whether the join duplicates the event you're measuring. Summing order totals across order lines counts the same order once per line, a quiet way to inflate revenue.
The same approach works for a clinic connecting Patient, Appointment, and Provider, or a subscription company connecting Account, Subscription, and Invoice. For personal or clinical information, keep unnecessary identifiers out of analytical extracts and restrict access by role.
2. Logic Models Connect Program Spending to Measurable Outcomes
A loyalty campaign can generate plenty of activity without improving customer retention. Your marketing team sends offers, customers open messages, and managers celebrate engagement. None of that establishes whether the campaign changed purchasing behavior.
A logic model separates inputs, activities, outputs, outcomes, and impact. Its business question is straightforward: How should this investment produce a useful change, and what would show that the chain isn't working?
For a retailer, the working model might look like this:
- Inputs: Transaction history, marketing budget, staff time, and usable customer permissions.
- Activities: Select eligible customers, prepare relevant offers, and send targeted messages.
- Outputs: Delivered offers and customers reached.
- Outcomes: Repeat purchases and contribution margin after discounts.
- Impact: More valuable, durable customer relationships.
Build Backward From the Change You Want
Start with the intended outcome, then identify the behavior that must change before it can happen. Only then decide which activities deserve funding.
For each stage, record a metric, its definition, its data source, and the assumption connecting it to the next stage. This measurement layer is what turns an attractive diagram into an operating tool. The SBA Office of Advocacy's analysis of AI use in firms found that small firms using AI averaged about two use cases, a useful reminder to build a coherent decision process rather than collect disconnected applications.
Where it breaks down: The arrows can make an untested explanation look proven. Customers who redeem an offer may already be more loyal, and seasonal demand may explain an apparent improvement.
An output tells you that the team did something. An outcome tells you whether something changed.
Set a baseline before launch and, where feasible, compare eligible customers assigned to receive the offer with a suitable comparison group. Monitor margin and returns alongside repeat purchases so discounts don't disguise unprofitable behavior.
In public health, the same structure connects community workshops to screening participation and eventual health outcomes. In finance, it connects reminder activity to payment behavior and receivables performance. Those are evaluation frameworks, not substitutes for clinical judgment, financial advice, or compliance review.
3. Business Model Canvases Make Strategy Assumptions Visible
Business question: Can this offer create value for customers while covering the costs of delivering it?
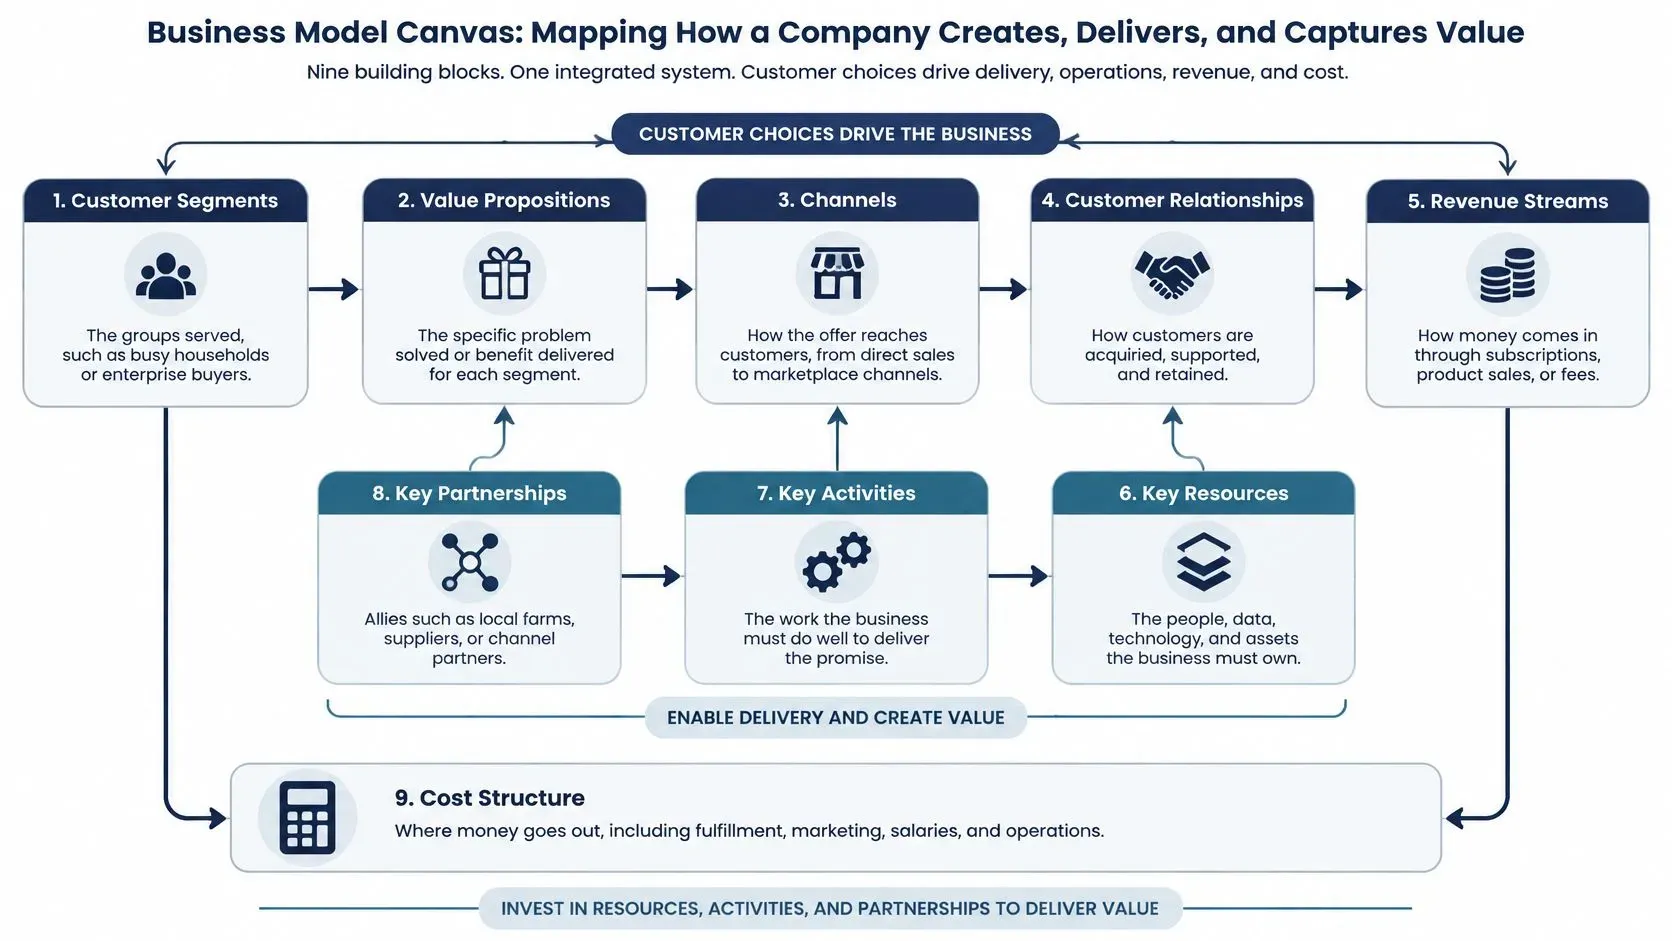
The Business Model Canvas, associated with Alexander Osterwalder and Yves Pigneur, places the main components of a business on a shared page. Those components are customer segments, value propositions, channels, customer relationships, revenue streams, key resources, key activities, key partnerships, and cost structure.
Unlike an ER model, it doesn't describe how records connect. It helps your leadership team examine how customer demand, operations, and economics fit together.
Turn Each Block Into a Testable Assumption
Say a meal-kit company targets busy households with time-saving recipes. Its canvas connects that promise to ordering channels, recurring payments, ingredient suppliers, recipe development, packing, delivery, and customer support.
The first build step is to complete customer segments and value propositions together. A broad label such as households isn't enough. Specify who buys, what problem they want solved, and why your offer might beat their current alternative.
Then attach evidence to the assumptions that could change your decision:
- Customer demand: Interview likely buyers and examine purchasing behavior, not just expressions of interest.
- Channel economics: Include commissions, fulfillment, returns, and support when assessing marketplace revenue.
- Delivery capacity: Check whether suppliers and operations can support the promise during demand peaks.
- Revenue quality: Separate recurring demand from purchases sustained by discounts.
Where it breaks down: Teams can mistake a completed canvas for a validated business. A neatly filled page doesn't establish willingness to pay, viable acquisition costs, or reliable delivery.
For a B2B subscription company comparing freemium with direct sales, build separate canvases. Freemium changes onboarding, support, conversion, and infrastructure requirements; direct sales changes staffing, buying cycles, and customer relationships.
Review the blocks when operating evidence contradicts an assumption. Keep the canvas concise, but maintain supporting calculations outside it. These examples of conceptual models work best when the diagram starts a test rather than ends a discussion.
4. Star Schemas Organize Retail Sales and Promotion Analysis
A grocery manager needs to compare promotion performance across stores, products, and trading periods. The operational database contains the ingredients, but analysts repeatedly rebuild joins and disagree about what counts as sales.
A star schema organizes analysis around a central fact table, containing measurable events, and surrounding dimension tables, containing their descriptive context. Date, Store, Product, Customer, and Promotion are typical dimensions.
Strictly speaking, a star schema is usually a logical dimensional design, not just a conceptual model. Its conceptual sketch is still useful because it forces agreement on the event being measured before anyone builds the reporting structure.

Define the Grain Before Choosing Measures
Business question: How do sales, discounts, and margin vary by product, store, promotion, and time?
The first build step is to write the grain, meaning exactly what each fact record represents. For retail sales, a transaction line is often useful because it preserves product-level quantity, price, and discount detail.
Ralph Kimball and Margy Ross are closely associated with dimensional modeling. The practical lesson for your team is to keep measures consistent with the grain, rather than placing every available metric into the same table.
- Keep events separate: Sales, inventory snapshots, and website sessions represent different events and need appropriate fact tables.
- Share dimensions: Use consistent product, store, and date definitions when comparing sales with inventory.
- Preserve context: Retain the relevant selling price, discount, and product classification for historical analysis.
- Reconcile totals: Compare modeled revenue with the source system, including returns and cancellations.
Where it breaks down: Mixing grains produces plausible but incorrect totals. Joining store-level inventory directly to transaction lines, for example, can repeat stock quantities.
Design warning: A sales model can describe promotion performance without proving that the promotion caused the result.
For retail promotion optimization strategies, compare margin, availability, and customer behavior, not revenue alone. An e-commerce conversion model also needs session or visit information; sales transactions can't tell you how many visitors left without buying.
5. Technology Acceptance Models Diagnose Analytics Adoption Barriers
Your reporting platform works, the dashboards load, and managers still export spreadsheets. Before scheduling more training, find out whether they doubt the system's value or struggle to use it.
The Technology Acceptance Model, or TAM, associated with Fred Davis, centers on perceived usefulness and perceived ease of use. These beliefs help explain users' intentions to adopt a system, but they don't guarantee sustained use or business value.
Business question: What would make employees choose this analytics workflow over their current approach?

Observe a Real Task Alongside the Survey
Start with a short survey and a task observation. Ask employees whether the system helps them perform their job and where they struggle, then watch them prepare a sales summary, investigate a stock issue, or review an alert.
For a manufacturer, a reporting demonstration should show how a manager gets from source information to an actionable production discussion. For a retailer, pilot forecasting with store managers and collect feedback on explanations, overrides, and missing context.
Distinguish the barriers before acting:
- Low usefulness: Demonstrate a relevant decision, improve the information provided, or remove reports nobody needs.
- Low ease of use: Simplify navigation, provide role-specific guidance, and resolve access problems.
- Low trust: Explain definitions, expose missing information, and show how employees can challenge an output.
The OECD report on empowering SMEs in the age of AI reports that 56.6% of surveyed SMEs used AI only for isolated tasks. That distinction matters: occasional experimentation isn't the same as an embedded operating process.
Where it breaks down: TAM alone doesn't account for every constraint. Employees may like a system but lack permission to act, while mandatory usage can make adoption figures look healthy despite poor outcomes.
Use the ELECTE analysis for European SMEs to frame adoption discussions, then track completed tasks, corrections, and continued use. For financial risk workflows, retain human review, decision ownership, audit records, and appropriate access controls; an automated alert isn't authorization to take consequential action.
How the Five Conceptual Models Compare at a Glance
Item | Originator and Year | Core Components | Best For | Typical Business Use |
|---|---|---|---|---|
Entity-Relationship (ER) Model | Peter Chen, 1976 | Entities, attributes, relationships, primary keys | Designing and communicating data structures | Planning databases for customer, order, and product analytics |
Logic Model | Popularized by the W.K. Kellogg Foundation, 2004 | Inputs, activities, outputs, outcomes, impact, indicators | Linking resources and activities to measurable results | Evaluating initiatives and tracking program performance |
Business Model Canvas | Alexander Osterwalder and Yves Pigneur, 2010 | Nine blocks covering customers, value, operations, and finances | Mapping or testing how a business creates and captures value | Comparing business models, pricing, and channels |
Star Schema | Ralph Kimball and Margy Ross; popularized in 1996 | Central fact table and surrounding dimension tables | Fast, accessible analysis of business data | Analyzing sales by product, store, date, and promotion |
Technology Acceptance Model | Fred Davis, 1989 | Perceived usefulness, perceived ease of use, attitude, intention | Understanding and improving technology adoption | Planning adoption, training, and rollout of analytics tools |
Turn Five Models Into a Sharper Analytics Plan
The best examples of conceptual models answer different questions rather than compete for the same job. An ER model clarifies data structure. A logic model connects resources and activities to outcomes, while a Business Model Canvas makes strategic assumptions visible.
A star schema gives analysts a consistent structure for sales comparisons. TAM helps you diagnose whether employees see enough value, usability, and trust to adopt the resulting workflow. Choosing the right model reduces avoidable disagreement before it reaches your reports.
Key Takeaways
- Choose a decision first: Write the question in plain language, such as whether to repeat a regional promotion.
- Sketch only relevant relationships: Include the entities, outcomes, or beliefs needed to answer that question.
- Attach evidence: Define metrics, identify source systems, and record assumptions that remain untested.
- Set a challenge point: Decide what evidence would make you revise the model or reject its explanation.
- Assign responsibility: Name who maintains definitions, reviews exceptions, and approves consequential actions.
You can combine models without turning the project into a documentation exercise. A retailer might use an ER sketch to clarify source records, a star schema to organize analysis, and a logic model to evaluate the campaign. Add TAM when the challenge shifts from producing insights to getting managers to use them.
For revenue leaders, this approach also sharpens conversations about data priorities for chief revenue officers: begin with the commercial decision, then establish which evidence supports it. More reporting won't resolve an undefined customer, inconsistent margin calculation, or untested growth assumption.
This week, sketch a model around a business question your team keeps revisiting. Review it with someone who understands the operation, trace the available evidence, and identify the assumption most likely to change your decision. That's a practical foundation for faster, more confident analytics.
ELECTE, an AI-powered data analytics platform for SMEs, connects business data with forecasting, automated reports, and actionable insights. Bring your model and a specific business question to a demo so you can explore how that structure translates into a reporting workflow. Visit ELECTE to see how the platform works and request a personalized demo.
Comments
No comments yet — start the conversation.