Qlik Sense vs Power BI: A Practical 2026 Comparison Guide
Qlik Sense vs Power BI compared across features, pricing, AI, and scalability. See which platform fits your team and how ELECTE differs from both in 2026.

You're likely in the middle of a familiar BI headache. Finance wants one version of revenue, operations wants fresher dashboards, and leadership wants the answer yesterday. On paper, Qlik Sense vs Power BI looks like a feature race. In practice, it's a decision about how your team works, how much maintenance you can absorb, and whether your data stack is already built around Microsoft.
For most SMEs, the biggest mistake is buying the platform that looks easiest in a demo. The demo never shows the rebuild behind a semantic model, the script work behind governed exploration, or the licensing surprise that shows up when more people need to author, certify, and share. Microsoft's preview and later usage figures show why Power BI became the default choice for many organisations, while Qlik's associative model still matters when analysts need to move freely across data. The right answer depends less on visuals and more on operating model, refresh pressure, and governance burden.
Decision factor | Qlik Sense | Power BI |
|---|---|---|
Best fit | Exploratory analysis across connected and disconnected data | Governed reporting inside Microsoft environments |
Model style | Associative engine and script-driven loading | Semantic model with explicit relationships and measures |
Operational burden | More flexible, but can demand stronger modeling discipline | Easier to standardise, but licensing and refresh limits matter |
Hiring and training | Smaller specialist pool | Larger mainstream skill pool |
Hidden risk | Governance can become a separate surface in mixed environments | Sharing, certification, and capacity rules can raise the real cost |
The Real Decision Behind Choosing an Analytics Platform
The decision this week is probably not “Which dashboard looks nicer?” It's “Which platform will my team maintain without creating a second job for itself?” That's the question SMEs should ask first, because the prettiest BI stack often becomes the most expensive one once refreshes break, permissions sprawl, and models drift.
A serious comparison starts with your existing environment. If your company already runs on Microsoft 365, Azure, Entra ID, Purview, and Fabric, Power BI inherits a lot of plumbing you've already paid for. If your sources are scattered and your analysts need to explore beyond fixed paths, Qlik Sense gives them a more open discovery model, but you'll need stronger governance habits to keep the numbers stable.
Practical rule: choose the platform that matches your current operating model, not the one that promises to change it.
That's also why a third option matters. Some SMEs don't have the people to maintain either a heavy semantic-model programme or a specialist associative-engine practice. In those cases, an AI-driven platform like ELECTE can make more sense because the goal isn't to build a BI department, it's to get trustworthy insights without one.
The rest of this comparison uses a simple filter, current adoption scale, engine behaviour, documented limits, governance mechanics, and the actual cost of staying on either platform. If a tool only looks cheaper at the start, it's not cheaper. If it needs a dedicated owner before the dashboard is even useful, that's not a light lift for a small team.
Market Position and Analyst Availability in 2026
Power BI's market position was built early and aggressively. Microsoft said more than 500,000 unique users across 45,000 companies and 185 countries participated in Power BI's six-month preview before its commercial launch, and later reported over 375,000 organizations and about 30 million monthly active users by 2025 in a recap of the product's growth Microsoft's preview milestone and later growth recap. That matters because scale isn't just a vanity metric. It affects who you can hire, what your users already know, and how quickly you can embed analytics into existing workflows.
What that means for SME hiring
Qlik has a solid base too, with more than 30,000 customers worldwide in the broader analytics and data-integration footprint cited in vendor and industry summaries vendor and industry summary. But the labor market is still tilted toward Microsoft. More people know Power BI, more people can support it, and more consultants can step in when your internal owner is busy or leaves.
That doesn't make Qlik weak. It makes Qlik more selective. Its heritage from QlikView and its associative approach attract teams that need deeper exploration, but SMEs without dedicated analysts often need the broader hiring pool more than they need the cleverest engine.
Why distribution changes the decision
A BI platform is partly a software choice and partly a staffing choice. If you expect one analyst to support dashboards, permissions, definitions, and refreshes, you want the ecosystem with the easiest training path and the widest bench. If your users are experienced analysts who enjoy digging through data relationships, Qlik's narrower base is less of a problem.
For a practical contrast on platform positioning, see read ELECTE compare Power BI Tableau. The lesson is simple, adoption breadth becomes part of the product. That's why Power BI often wins before a feature checklist even starts.
Feature Comparison Across Visualization, Modeling, and AI
The most important difference is not chart types. It's how each platform expects you to think about data. Qlik Sense uses the Qlik Associative Engine, which lets users explore linked and seemingly unrelated data without forcing every question through a predefined path Qlik Associative Engine overview. Power BI centers on governed semantic models, relationships, measures, and report visuals, which is stronger when the company wants one trusted definition everywhere.
Capability snapshot
Capability | Qlik Sense | Power BI |
|---|---|---|
Visualization | Flexible exploration around associations | Strong governed reporting and widely familiar visuals |
Data modeling | Associative engine and script-led shaping | Semantic model with relationships and measures |
Data prep | Built-in loading and transformation workflow | Power Query, M, and model-centric shaping |
AI support | Insight Advisor, AutoML, guided exploration | Copilot, smart narratives, and Azure ML integration |
For a broader framing on dashboards and visual design, the data visualization and analytics guide is a useful external reference. But the key issue for SMEs is less “Which has more AI?” and more “Which AI reduces analyst hours?”
Qlik's AI story is attractive when users want guided exploration and predictive help inside the same environment. Power BI's AI story fits teams already living in Microsoft tools, especially when they want natural-language interaction layered onto a model that finance and operations can agree on. The danger on both sides is the same, AI is useful only when the underlying model is disciplined.
Bottom line: Qlik helps analysts discover. Power BI helps organisations standardise.
If you're comparing dashboard design specifically, turn raw data into insights is the right mindset, whichever platform you pick. The platform that shortens time to first trusted insight usually beats the one with the flashier demo.
Performance, Scalability, and Operational Limits
Treat benchmarks as workload tests, not marketing claims. In a BARC benchmark that used repeatable cloud tests, a 10-million-row dataset, and tasks such as dashboard opening, filtering, refreshing, and adding concurrent users, Qlik Cloud Analytics reportedly delivered approximately three times faster response times and about three times higher measured user productivity BARC benchmark. For analysts who live inside exploratory dashboards all day, that is a real advantage.
Power BI has hard ceilings you need to plan around. Microsoft planning guidance notes a 1 GB limit for Power BI Pro workspaces and 100 GB for Premium Per User, and it also caps scheduled refreshes at 8 per day for Pro and 48 per day for Premium Per User Microsoft planning guidance. Those limits shape how often finance, inventory, and risk teams can rely on fresh numbers.
SMEs feel this first. If your data changes often, frequent refreshes and larger models push you toward the platform that matches your operating rhythm, not the one with the nicer demo. Power BI can still be the right call, but only if the model design and refresh pattern stay inside those limits. Qlik's interaction speed helps on heavy exploration, yet it does nothing for weak governance or a messy data model.
A good benchmark lens also depends on the team you are serving. The performance metrics for AR teams example shows why context matters, because a fast system that is hard to maintain still becomes an operations problem. For SMEs, the better choice is the one that keeps performance, administration, and licensing under control without forcing extra headcount.
Security, Governance, and Distribution Mechanics
Power BI governance gets messy fast if you assume licensing is only a viewer problem. Microsoft states that users without Pro or Premium Per User licenses can author from shared semantic models only when those models sit on Premium or Fabric F64-or-higher capacity, and those users can store reports only in My workspace and cannot share them. The same guidance also covers copying reports between workspaces, copying reports from an app, and promoting or certifying semantic models, all of which require Pro or Premium Per User licenses Microsoft workspace guidance.
Why this matters in real teams
In a retail team, the store manager may view reports without friction while the analyst who maintains them still needs a paid seat and the right workspace setup. In financial services, that split creates problems if your governance model treats viewing, editing, and certification as the same job. They are separate tasks, and Power BI charges for that separation.
Qlik takes a different route. Its section access and attribute-based controls fit mixed environments where you do not want every access rule tied to a Microsoft tenant. That flexibility helps, but it also adds another governance layer that someone has to maintain, test, and audit.
If no one owns the model, both platforms turn into security projects instead of analytics platforms.
Power BI is easier to administer when your identity stack already runs on Microsoft, because the permissions model fits the rest of the stack. Qlik is more adaptable in mixed environments, but the admin burden does not vanish; it shifts to a different part of the team.
Use Cases by Industry and Team Role
A retail or e-commerce team usually feels the difference first in how it explores product, store, and campaign data. If inventory, promotions, and customer behavior all live in disconnected systems, Qlik's associative exploration can uncover relationships faster. If the company already runs on Microsoft 365 and wants store teams to consume governed dashboards inside familiar tools, Power BI is usually the lower-friction route.
Where each role tends to land
Financial services teams care about auditability, controlled definitions, and traceable governance. That makes Power BI attractive when a single measure has to mean the same thing across risk, compliance, and forecasting reports. Qlik can still work there, but only if the team is disciplined about model ownership and access controls.
Operations and supply-chain leads usually care less about visual polish than about response time and refresh confidence. If dashboard interactions are heavy and the analysis is exploratory, Qlik has a real case. If the workflow is more standardized, Power BI's governance and broader user base may be the safer long-term choice.
The hidden cost is migration effort. Rebuilding semantic models, rewriting data pipelines, and retraining users are real costs, and most comparisons treat them as footnotes. They're not footnotes. They're the bill.
For a practical framing of platform selection and build-versus-buy thinking, AI tool decision framework for CMOs is a useful parallel read. The same logic applies here. A small team should not buy complexity it can't own.
Pricing, Total Cost of Ownership, and Migration Effort
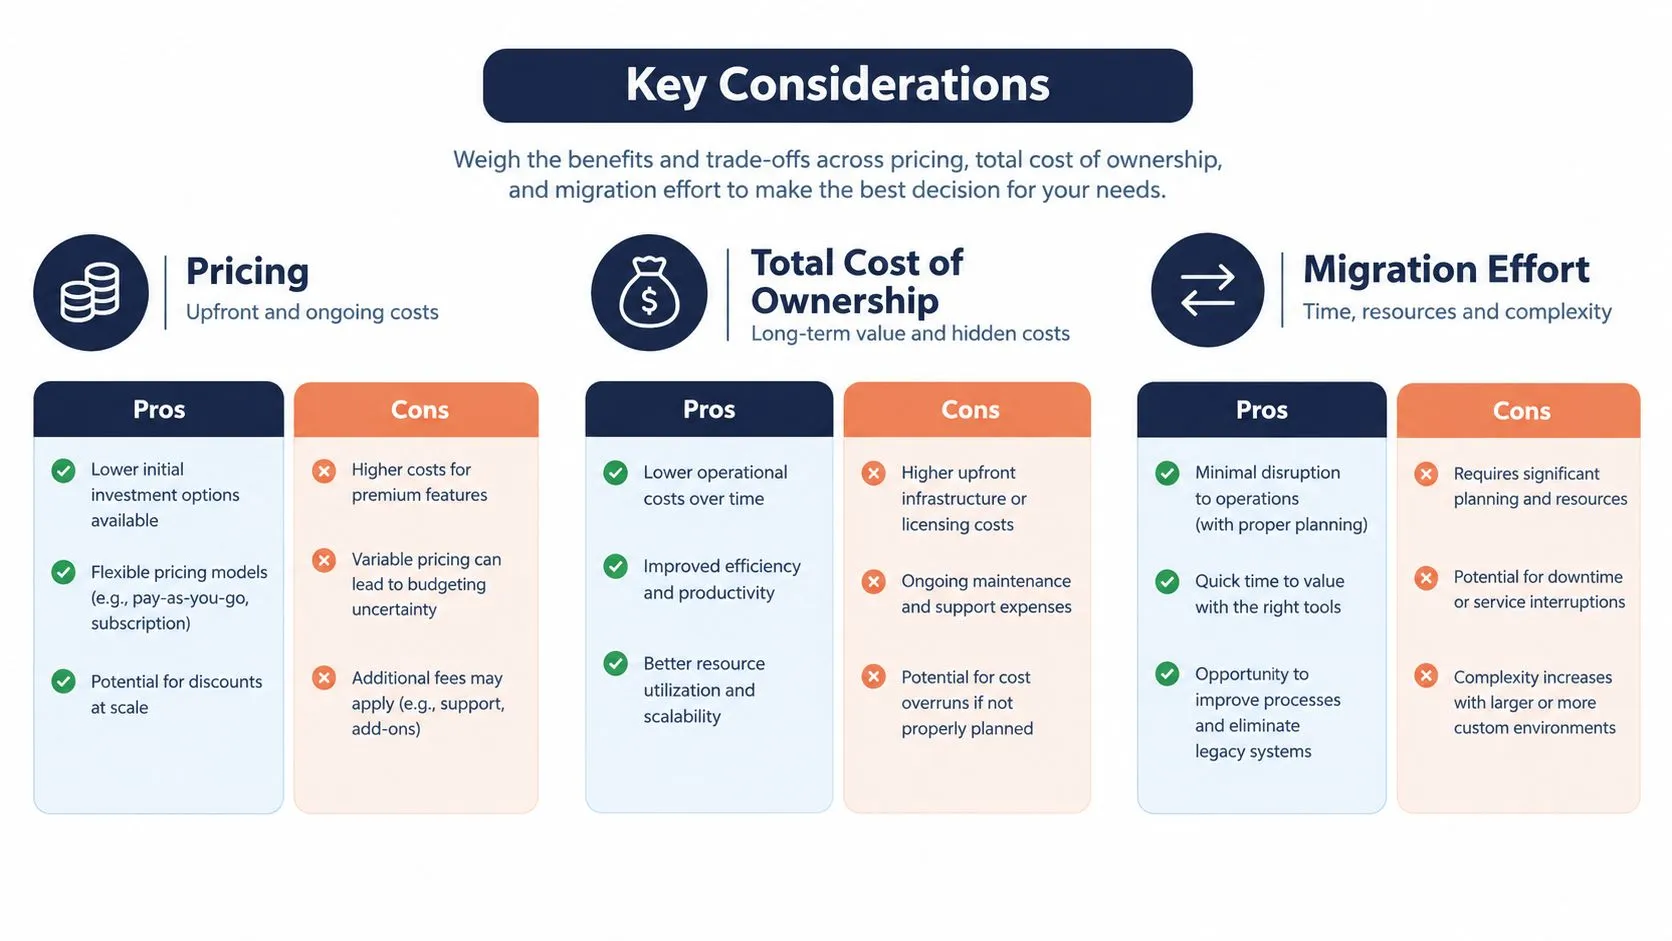
A lot of buying decisions get made badly at this stage. Power BI's entry price looks attractive because the first seat is cheap, but the bill rises when more people need to author, certify, or collaborate across workspaces. Qlik's tiered structure can be more predictable for a defined user base, but it asks you to accept capacity planning and subscription commitments up front.
The real cost is broader than licenses
You also need to price the migration itself. Moving from Qlik to Power BI or the other way around usually means semantic model rebuilds, ETL or load-script rewrites, report redesign, and retraining. Teams that skip those line items end up arguing about the budget halfway through the project.
Hidden maintenance costs matter too. Refresh failures, semantic model drift, and governance overhead don't show up in a demo, but they show up in the monthly operating load. That's why a one-year view is too short and a three-year view is more honest.
If you're comparing legacy migration paths, migrate legacy BI to AI is the kind of transition many SMEs end up needing when the old platform asks for more upkeep than insight. The lesson is simple, don't buy a platform you can't staff.
Best practice: compare total cost of ownership, not just subscription price.
A Decision Framework and Where ELECTE Fits
The decision gets easy once you score it against five questions. First, is your company already standardized on Microsoft 365 and Azure? If yes, Power BI starts with a structural advantage because identity, governance, and collaboration can be inherited instead of rebuilt. Second, how often does your data refresh, and how close are you to model-size or refresh-frequency limits? If the answer is “often,” you need to think about operational maintenance before you think about visuals.
Third, how skilled is the team that will own this stack? A platform that needs a specialist to keep it healthy is a bad fit for an SME without a dedicated data team. Fourth, do analysts need to explore freely across disconnected sources, or do executives need one controlled definition of every metric? That question usually separates Qlik from Power BI in practice.
When I'd recommend each path
Choose Power BI when your business is already Microsoft-centered, your priority is governed reporting, and you need a large hiring pool. Choose Qlik Sense when users need associative exploration and your team can support the associated governance and scripting work. Choose a third path when the business wants insights without building an analytics function around them.
That's where ELECTE, an AI-powered data analytics platform for SMEs, fits. It's designed for teams that want automated reports, anomaly detection, and one-click insights without carrying the same maintenance burden as a traditional BI stack. The point isn't to replace every analytics platform. It's to give SMEs a cleaner way to act on data when the internal team is too small for a heavy implementation.
A few direct answers usually settle the rest of the search intent. Is Power BI enough for an SME without a data team? Often yes, if the Microsoft estate is already in place and the reporting model is simple. When does Qlik Sense win? When the business asks exploratory questions across messy, disconnected data and has people who can own the model properly. Is migration realistic? Yes, but only as a remodelling project, not a simple lift-and-shift. How is ELECTE different? It's built to reduce the manual work that makes both BI platforms hard for smaller teams to sustain.
Ready to move from comparison to action? See how ELECTE helps SMEs turn raw data into reliable insights without the overhead of a traditional BI programme. Visit ELECTE to see how the platform fits your reporting, forecasting, and decision-making needs.
Comments
No comments yet — start the conversation.