Business Intelligence for Small Business: A 2026 Guide
Unlock data-driven growth with business intelligence for small business. This guide covers affordable tools and strategies to help SMEs compete in 2026.

Only 8.8% of U.S. small businesses reported using AI in the production of goods or services in 2025, although that figure had risen from 6.3% six months earlier. At the same time, a separate 2026 SMB report found that 69% of respondents already used at least one form of automation, while 42% said they couldn't survive without their digital tools. These findings, reported by Business.com's coverage of SMB AI adoption, highlight the key challenge for growing companies: the question isn't whether analytics matters, but how to implement it with limited staff, budget, and technical expertise.
Business intelligence for small business turns information from sales systems, accounting platforms, customer databases, and operations tools into usable guidance. Modern AI-powered platforms can go further by forecasting demand, identifying unusual activity, and producing reports without requiring an in-house analyst.
This guide explains how to build that capability step by step. You'll learn where BI creates measurable value, which workflows deserve attention first, how to connect fragmented data, which KPIs matter, and how to choose a platform that supports decision-making instead of adding another complicated system.
Measuring ROI from Business Intelligence for Small Business
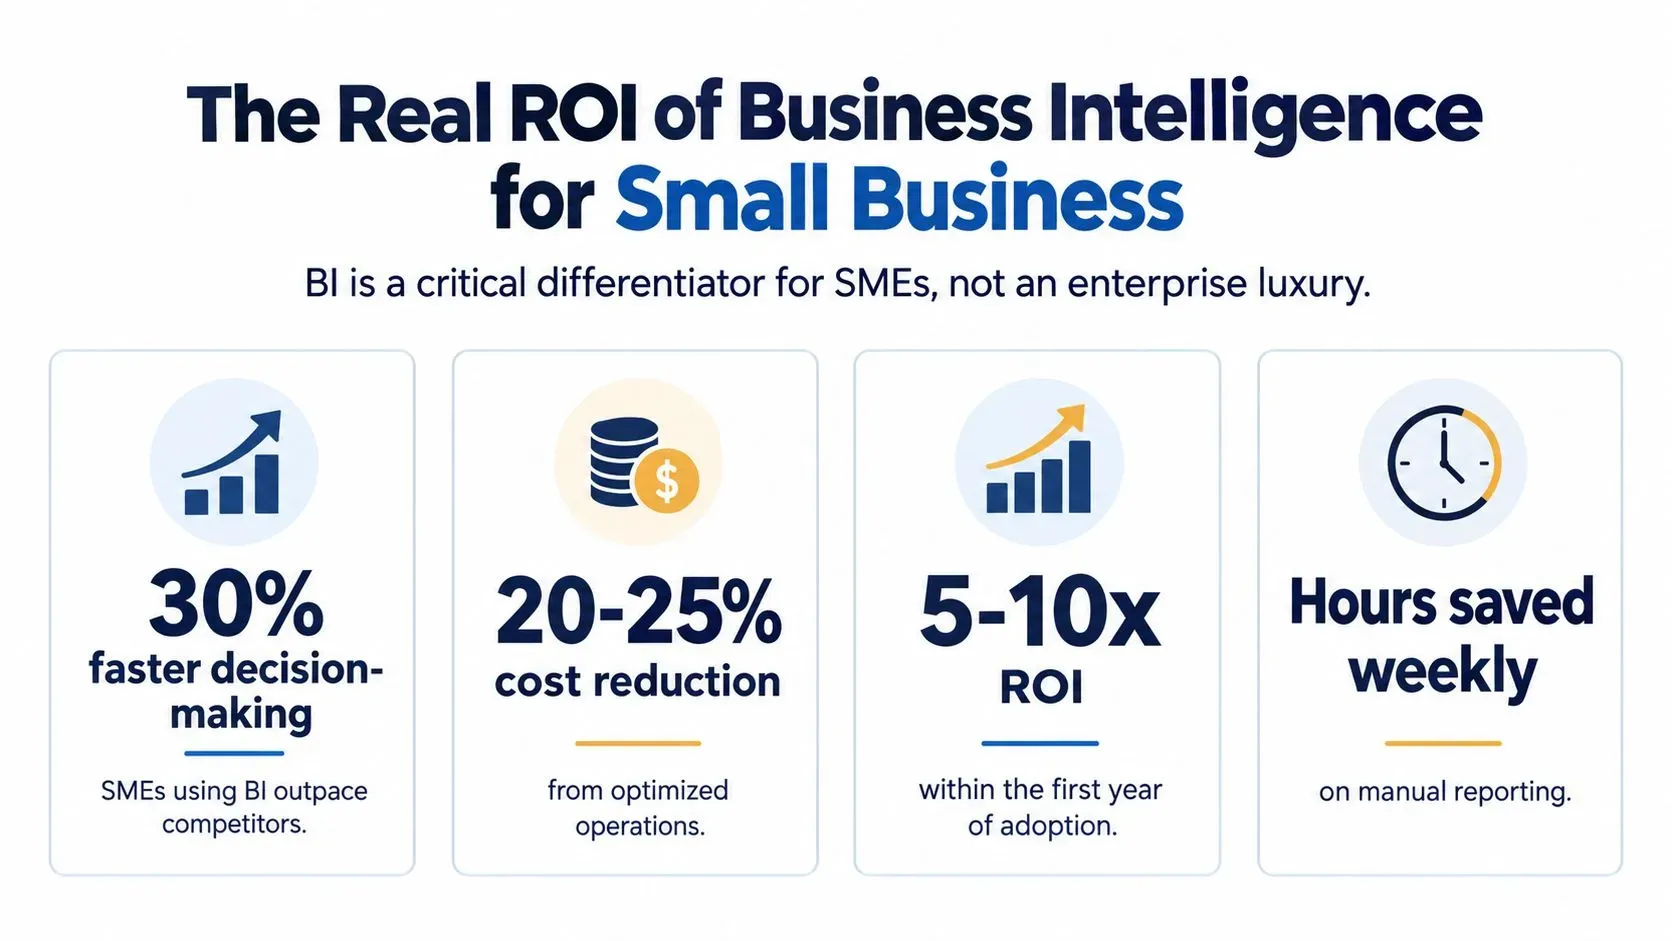
58% of best-in-class SMBs provided access to key information in real time or near real time, compared with 21% of industry-average SMBs and 5% of laggards, according to GTIA's SMB AI adoption report. The figures point to a practical advantage: a business can respond while a problem is still manageable, rather than review it after the opportunity has passed.
For an SME, business intelligence works like a control panel. It brings sales, stock, cash flow, and customer activity into view so a manager can adjust an offer, investigate a revenue drop, or reorder a product at the right moment. A report that arrives after month-end may explain what happened, but a timely view can support the decision that changes the outcome.
What the performance gap shows
The same report found that best-in-class SMBs achieved a 56% ROI on BI projects, compared with 37% for industry-average SMBs and 28% for laggards. These results do not guarantee an identical return for every company. They show that BI produces more value when reliable information is part of daily work, rather than an occasional reporting exercise.
Practical rule: A dashboard matters only when someone knows what action to take after viewing it.
Implementation discipline also separates useful BI from unused software. 50% of best-in-class organizations had an enterprise-wide BI deployment procedure, compared with 19% of industry-average SMBs and 17% of laggards, as noted in the GTIA report. A repeatable procedure gives each metric a shared definition, assigns an owner, and prevents departments from using different versions of revenue, margin, or customer value.
Turning BI into a business capability
The strongest business intelligence for small business programs connect information to a recurring decision:
- A retailer links sales and stock data to replenishment decisions.
- A service company connects jobs, labor, and invoices to margin analysis.
- A finance team combines payment history and cash balances to improve forecasting.
- A sales manager compares pipeline activity with actual revenue collection.
Measuring small business AI benefits and costs therefore requires more than counting reports. Track whether employees answer important questions faster, identify exceptions earlier, and spend less time preparing information manually. Those improvements show whether BI is reducing operational delay.
Start with one question tied to revenue, cost, cash, or risk. Define the data needed to answer it, the person responsible for acting, and the result you will review. With that structure, a small team can automate repeatable decisions without building an enterprise-sized analytics department.
How AI Is Transforming Small Business Analytics
Traditional BI explains what happened. AI-powered analytics helps a small business decide what needs attention now and what may happen next. The difference is practical: a dashboard waits for someone to inspect it, while an AI-supported workflow can watch for meaningful changes and bring them forward.
As noted in the introduction, AI adoption remains low but is growing. The more important shift for SMEs is from producing reports to supporting decisions. A five-person team, for example, can configure an AI agent to review sales orders, overdue invoices, and cash-flow data overnight. By morning, the team receives one summary of exceptions, such as a sudden sales decline, a delayed payment, or an unusual transaction. Staff still decide what to do, but they no longer begin by searching through separate systems.
From reports to action
Earlier BI processes often required someone to export data, refresh a report, inspect charts, and explain the result. AI can automate parts of that chain:
- Ingest information from connected business systems.
- Clean and organize records so measures follow consistent definitions.
- Detect anomalies such as an unexpected sales decline or unusual transaction pattern.
- Update forecasts when new information changes the outlook.
- Generate an insight that describes what changed and where to investigate.
The result resembles a night-shift operations assistant. It does not replace the manager, approve every action, or understand every customer relationship. It filters routine activity and presents the few items that deserve attention. That distinction lets a small team gain decision support usually associated with larger organizations, without hiring a full analytics department.
Keep human judgment in the workflow
Automation should handle repetitive observation and preparation. People should review decisions involving customers, credit, pricing, compliance, or major resource commitments.
A practical division of responsibility is:
- Automate: scheduled data refreshes, recurring reports, trend detection, threshold alerts, and first-pass summaries.
- Human review: unusual forecasts, high-risk transactions, pricing changes, customer-impacting actions, and decisions based on incomplete data.
- Document: metric definitions, alert thresholds, data owners, and the action expected after each alert.
The goal is to transform data with AI without creating an opaque system that nobody trusts. Team members should be able to see which data informed an insight, understand its reasoning in plain language, and judge whether the recommendation fits the business context.
For an SME, the platform performs repetitive monitoring while employees provide context, judgment, and accountability. That combination turns limited staff capacity into a repeatable decision process.
Key Use Cases for Sales, Inventory, Finance, and Risk
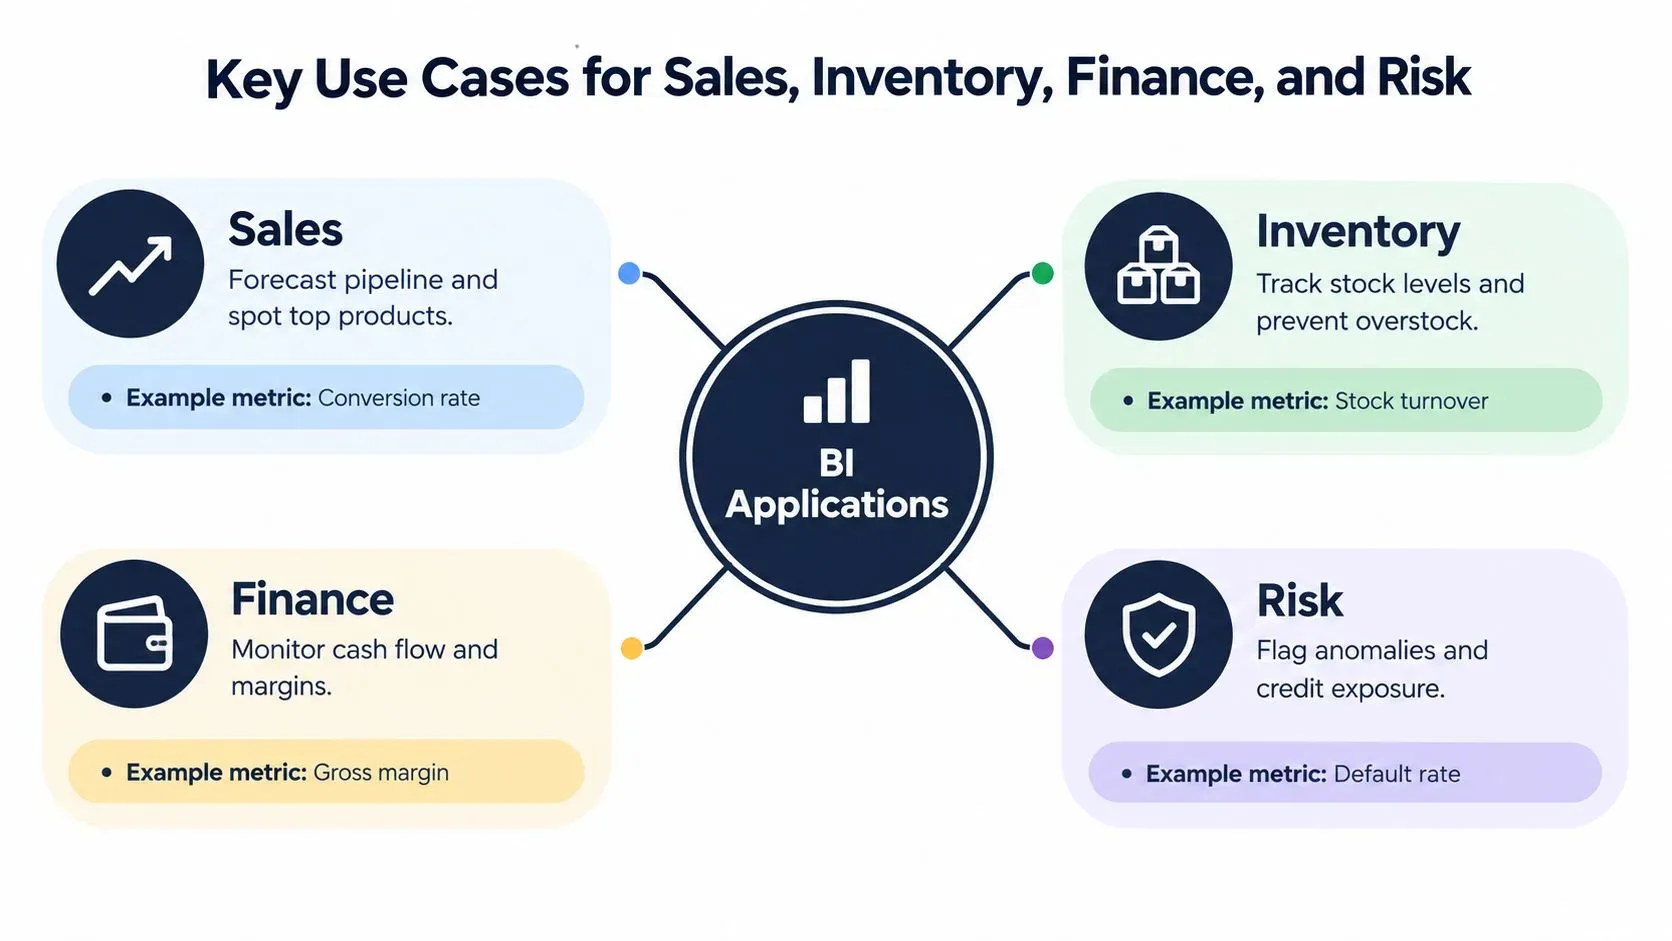
The best starting point depends on where your business loses time, margin, or visibility. Sales, inventory, finance, and risk teams all use BI, but each function asks a different question.
A retail manager may ask, “What should we reorder?” A finance lead may ask, “Will cash cover upcoming obligations?” A sales manager may ask, “Which opportunities are likely to convert?” A risk team may ask, “Which activity falls outside the normal pattern?”
Match the workflow to the decision
Function | Decision to support | Useful analytics |
|---|---|---|
Sales | Where should the team focus? | Pipeline trends, conversion patterns, product performance |
Inventory | What should we buy, hold, or promote? | Stock movement, demand signals, replenishment risk |
Finance | How strong is the financial position? | Cash flow, margin movement, receivables |
Risk | What requires investigation? | Anomaly detection, exposure monitoring, unusual activity |
Retail evidence illustrates why data integration matters. A Forrester/AWS SMB report found that retail SMB decision-makers used customer feedback most often, at 68%, and customer analytics next, at 62%, according to the Forrester and AWS SMB analytics report. Customer comments, browsing behavior, purchases, returns, and support interactions become more useful when a BI system analyzes them alongside operational data.
Four practical starting points
Sales teams need prioritization. A BI system can compare pipeline stages, product demand, customer segments, and actual revenue. Instead of asking representatives to treat every opportunity equally, managers can focus attention where the available evidence indicates stronger potential or a growing risk of delay.
Inventory teams need forward visibility. Historical sales alone can't explain every demand shift. Combine stock movement with promotions, customer feedback, returns, and product-level performance. An alert about slowing sales or unusually fast depletion gives the team time to adjust purchasing or promotion plans.
Finance teams need a shared operating picture. Connect accounting, billing, payments, and sales information so managers can review cash movement and margin without waiting for several separate reports. BI doesn't replace financial controls or professional advice, but it can make financial patterns easier to see.
Risk teams need exception management. Monitoring every transaction manually is inefficient. Anomaly detection can surface activity that differs from established patterns, while a human reviewer investigates the cause and determines the appropriate response.
Choose the use case where a faster answer would change a recurring decision. That's usually a better first project than building a broad dashboard that nobody uses.
Understanding Data Sources and Integration Requirements
A small company may look simple from the outside while operating across a surprisingly varied data environment. Aberdeen's SMB BI research reports an average of 15 unique data sources in even small businesses, and found that Best-in-Class companies were 2.5 times more likely than Laggards to automate report generation and delivery, according to the Aberdeen SMB BI research.
Your sources might include an accounting platform, CRM, point-of-sale system, ecommerce store, payment processor, support inbox, advertising account, spreadsheets, and operational database. The difficulty isn't collecting more information. It's making records consistent enough to compare.
Build the foundation in four steps
- Map each source. Record what the system contains, who owns it, how often it changes, and which business questions it can answer.
- Choose shared identifiers. Customer names, product codes, order numbers, and account IDs should follow consistent rules across systems.
- Define transformations. Decide how the platform handles missing values, duplicates, refunds, cancellations, tax, and currency.
- Set refresh expectations. A cash dashboard may need frequent updates, while a strategic report might use a scheduled refresh.
Parsing is part of this preparation. If your team needs a plain-language explanation of what parsing data means for business, that resource can clarify how raw records are interpreted and structured before analysis.
Modern platforms can reduce the technical burden through connectors and automated preprocessing, but they don't eliminate the need for governance. Someone still needs to approve definitions and investigate bad inputs.
Explore practical data integration use cases by starting with the two systems closest to your highest-value decision. A unified view of accounting and sales may be more useful than connecting every available source at once.
Essential KPIs and Metrics for Small Business Growth
A KPI is useful only when it helps someone decide what to do. A crowded dashboard can create the appearance of control while hiding the few measures that deserve attention.
A survey of 605 SMB professionals found that the leading BI and analytics needs included dashboards and reporting, basic operational metrics and KPIs, and predictive analytics. The survey also identified major obstacles, including access to multiple disparate data sources, setting up data models and formulas, and presenting results clearly, according to SmartData Collective's SMB analytics survey.
Choose KPIs by decision
Use a small set of measures for each operating question:
- Revenue health: Revenue trend, sales by product or service, pipeline movement, and conversion.
- Profitability: Gross margin, contribution by product line, operating cost movement, and discounts.
- Cash control: Invoices due, collection status, payment timing, and cash balance movement.
- Customer performance: Repeat purchases, retention patterns, support activity, and customer feedback.
- Operations: Order cycle time, fulfillment performance, stock movement, and service capacity.
- Risk: Exceptions, overdue accounts, unusual transactions, and exposure by customer or segment.
Make the numbers understandable
Every KPI needs a definition, owner, source, refresh frequency, and action threshold. “Revenue” should mean the same thing in the sales dashboard and finance report. If one team includes refunds and another excludes them, the disagreement is a data governance problem, not a performance problem.
Use visual hierarchy deliberately. Put the few measures tied to weekly decisions at the top, show direction and context rather than isolated values, and include a short explanation when a metric changes sharply.
A manager should be able to answer three questions quickly:
- What changed?
- Why might it have changed?
- What should we investigate or do next?
That is the difference between reporting and decision-ready analytics.
Implementing Business Intelligence, A Step-by-Step Roadmap
Implementation succeeds when you treat BI as an operating process rather than a one-time technology purchase. Start with a business question, connect only the data needed to answer it, and expand after the first workflow proves useful.
A 2020 TDWI survey found that 60% of SMBs used a web- or cloud-based data analytics system, while 9% still used an offline tool such as Microsoft Excel. The same survey reported that 67% spent at least $10,000 annually on people and technology to maintain analytics solutions, according to TDWI's SMB analytics survey. Those findings underline why maintenance, ownership, and usability belong in your implementation plan from the start.
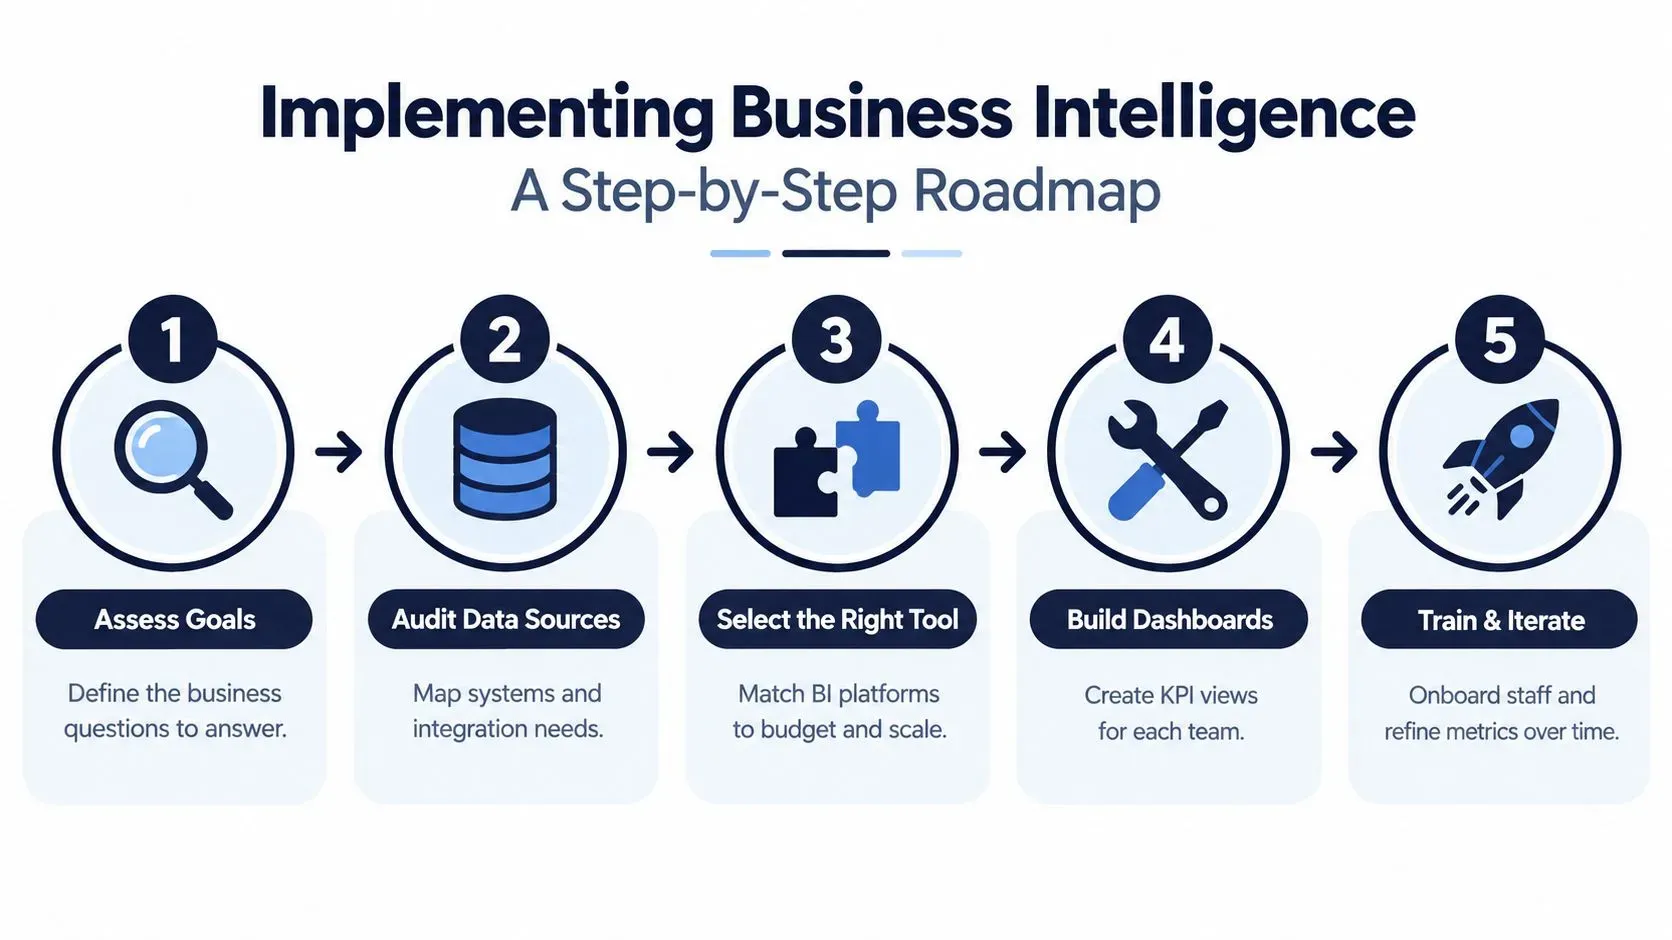
Follow the five-stage path
- Assess goals. Write the business questions that matter, such as which products generate the strongest margin or where cash is being delayed.
- Audit data sources. Identify the systems involved, data owners, gaps, duplicates, and refresh requirements.
- Select the right platform. Compare integration, usability, automation, security, reporting, and total ownership demands.
- Build focused dashboards. Create a leadership view or team dashboard around the first high-value decision.
- Train and iterate. Teach people how to interpret the metrics, review usage, correct definitions, and add the next workflow.
Keep ownership visible
Assign a business owner, even if BI isn't someone's full-time role. That person coordinates metric definitions, checks data quality, gathers feedback, and makes sure alerts lead to action.
Use a simple review rhythm. Discuss operational signals regularly, review financial trends on the appropriate financial cadence, and revisit the dashboard when the business changes. Don't add a new metric merely because the platform can display it.
Security and privacy also need attention. Limit access according to responsibilities, avoid exposing personal information unnecessarily, and confirm how your provider stores and processes business data. BI can support financial or compliance workflows, but it isn't a substitute for qualified financial, legal, or compliance advice.
Choosing the Right BI Platform for Your SME
The right platform fits your decisions, data, people, and budget. A long feature list won't help if your team can't connect its systems, understand the metrics, or trust the results.
Market evidence shows that SMEs represent a meaningful part of BI adoption. One market report estimates that SMEs represented 27.5% of BI market value, grew at an 11.8% CAGR, and that 68% of small businesses adopted cloud analytics for sales forecasting, financial reporting, and operational monitoring, according to Dataintelo's business intelligence market report. Treat these figures as market-report estimates, not as a guarantee for an individual company.
Evaluate the platform against real work
Selection question | Why it matters |
|---|---|
Can it connect your priority systems? | Manual exports create delays and version conflicts. |
Can non-technical users understand it? | Adoption depends on everyday usability. |
Does it automate monitoring and reporting? | Your team shouldn't inspect every metric manually. |
Can it forecast and detect anomalies? | Historical reporting alone may arrive too late. |
Are definitions and permissions manageable? | Shared metrics and appropriate access protect trust. |
Will the cost remain practical as usage grows? | Ownership includes setup, maintenance, connectors, and training. |
Look for a clear path from raw data to insight. A useful platform should help your team connect sources, preprocess information, create visual reports, monitor KPIs, generate forecasts, and investigate exceptions without requiring constant specialist support.
ELECTE, an AI-powered data analytics platform for SMEs, connects business data sources, preprocesses information, generates visual reports, supports forecasting, and uses an autonomous AI Agent to monitor data, identify anomalies, surface trends, and produce insights. Teams can use one-click reporting and explore business metrics without building every analysis manually.
Don't choose based on the promise of replacing human judgment. Choose a system that makes good judgment easier by presenting timely, understandable evidence. Review a platform with the people who'll use it, test it against one real workflow, and confirm how it handles data access, privacy, support, and ongoing changes.
Your first deployment should answer one important question reliably. Once the team trusts that workflow, expand into adjacent areas such as inventory, cash flow, sales forecasting, or risk monitoring.
ELECTE connects your business data, automates preprocessing, and turns complex information into visual reports, forecasts, and decision-ready insights for SME teams. Visit ELECTE to see how an AI-powered data analytics platform can help you move from manual reporting to continuous, practical decision support.
Comments
No comments yet — start the conversation.