AI Driven Insights: How Models Guide Decisions
AI driven insights turn raw business data into patterns, forecasts, and decisions. Learn the model path, when to refuse a result, and how to prove the value.

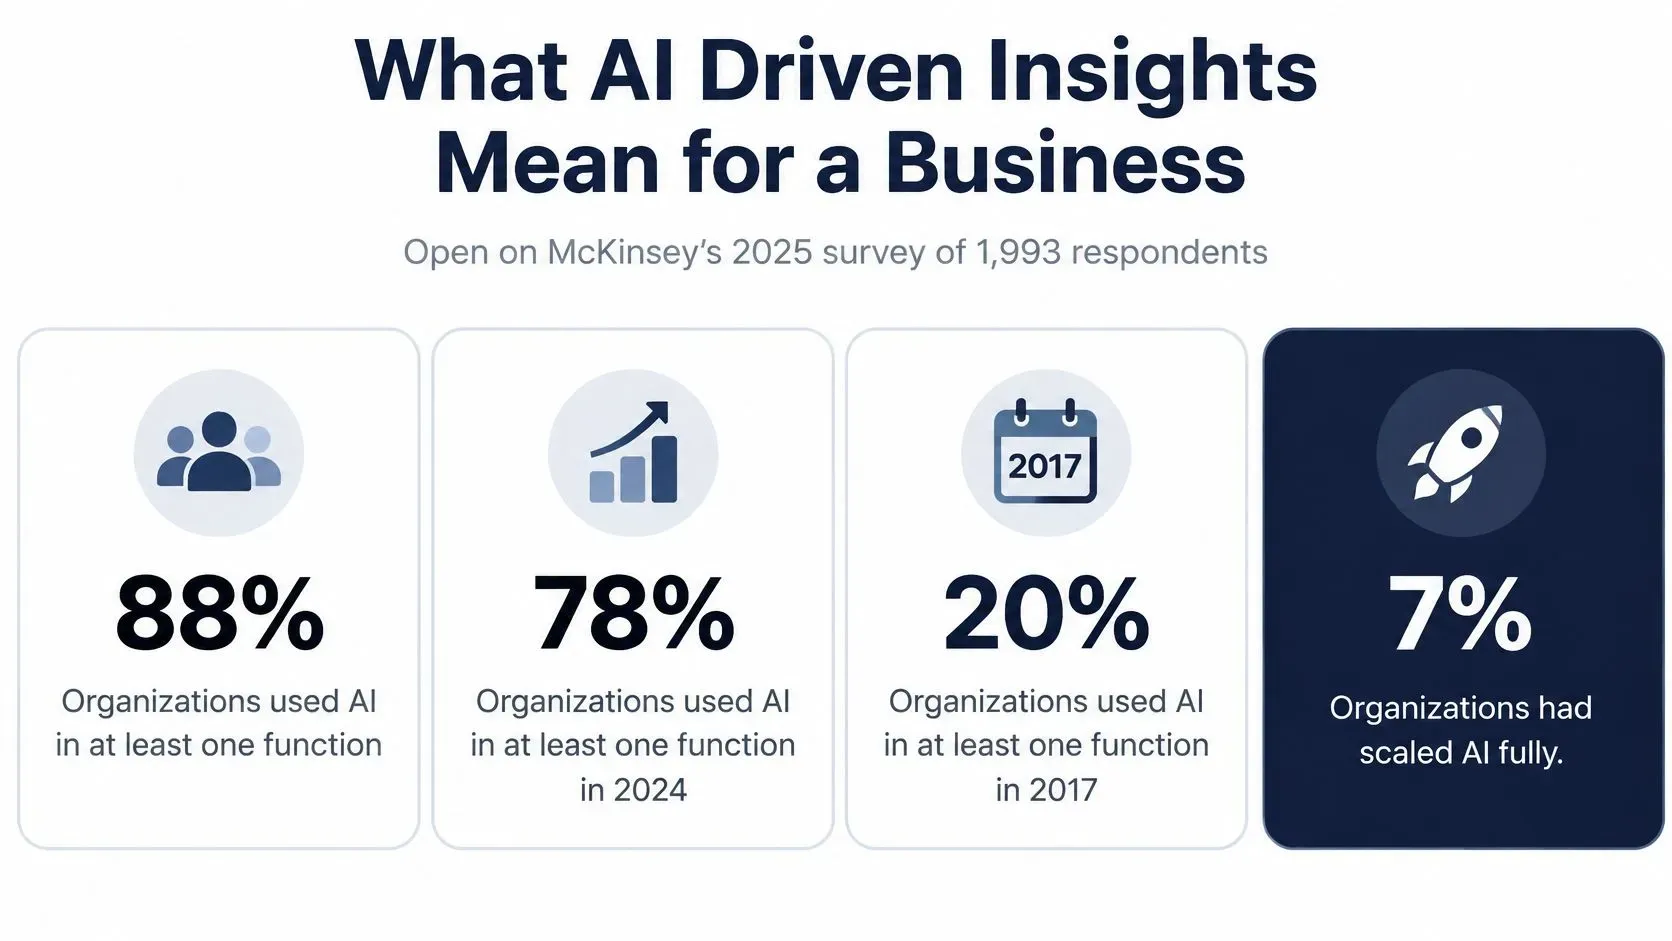
Only 7% of respondents said AI had been fully scaled across their organizations in McKinsey's 2025 global survey. That single number reframes AI driven insights. Trying a model is now common. Turning its output into a repeated decision, with evidence and an owner, is still rare.
Treat every insight as unsafe until you can point to its evidence, its owner, and a line that shows money, hours, or risk changed because someone acted on it.
What AI Driven Insights Mean for a Business
Say you're running a small retail chain. Monday morning brings a sales file, an inventory count, and a manager asking whether to reorder winter coats. A model that only draws a nicer chart hasn't helped you decide anything.
Adoption has raced ahead of integration. Regular generative-AI use reached 79% in 2025, and 39% of respondents reported some level of AI-related EBIT impact, but most of that group said AI accounted for less than 5% of organizational EBIT.
A working definition you can test
AI driven insights are recurring, model-produced readings of your business data. Each one names a pattern, a forecast, or a decision cue, and each one has a person who owns what happens next. It's not a chart someone rebuilds by hand at month end.
- A report describes: What sold last month, by store and category.
- A dashboard refreshes: The same metrics, updated as new transactions land.
- An insight directs: What's changed, what's likely next, and which decision that change may affect.
Think of a stockroom. The report is the inventory list taped to the door. The dashboard is the live board that updates when stock moves. The insight is the note that says winter coats in size M will stock out in about eleven days unless someone reorders this week.
That note works because it has a metric, a direction, and a deadline. It also implies a cost if you're wrong, either lost sales or cash tied up in coats nobody buys. For a small finance team, AI insights from Stewart Accounting Services offers a useful grounded view of where that value shows up in everyday accounting work rather than in demos.
Ownership test: If nobody owns the decision an output points to, it isn't an insight yet. It's just output.
You'll get more from one owned, weekly insight than from twenty alerts nobody reads. The sections ahead cover how models produce these outputs, where retail and finance teams use them, when you should refuse a result, and how you tie one insight to money you can verify.
Four Model Families in Plain Language
You don't need formulas to judge a model. You need to know what job each family does, and where it tends to mislead you.
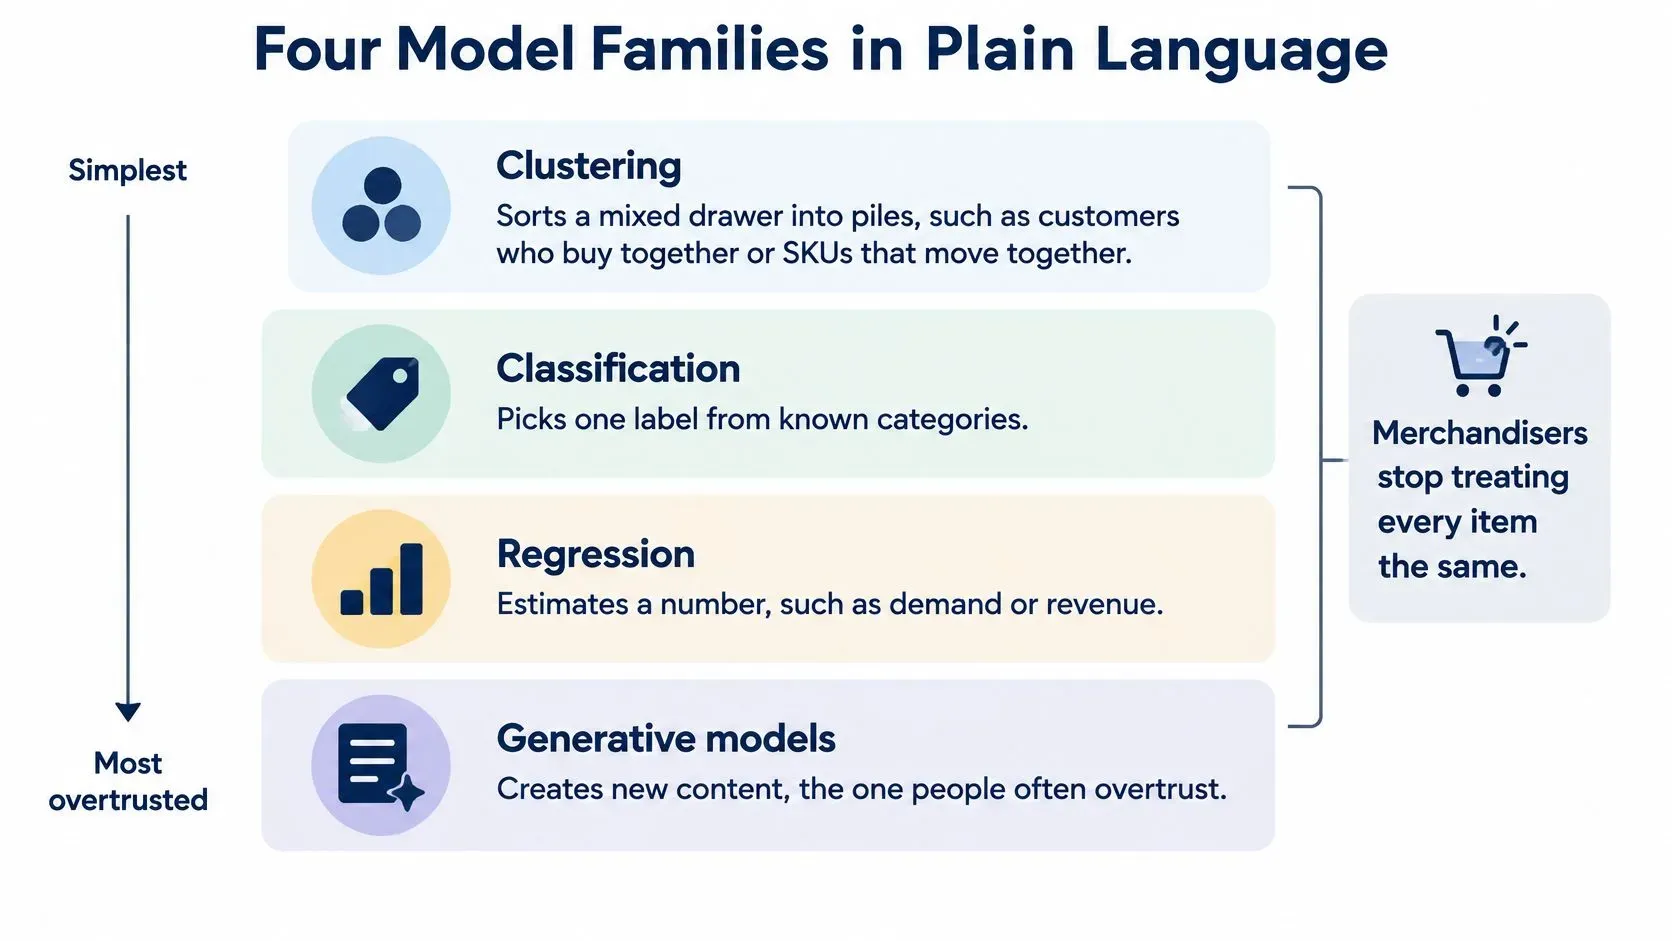
Clustering sorts the mixed drawer
Clustering groups similar things without you naming the groups first. It might find customers who buy together, or SKUs that rise and fall together across stores. A merchandiser can then stop treating every product as unique and start planning by group.
The trap is naming. A cluster is a statistical pile, not a real customer type, until someone who knows your buyers checks that the grouping makes sense and stays stable over time.
Classification works as a gate
Classification picks one label from known categories. Will this invoice be late or on time? Does this payment look routine, or unusual enough that a person should review it today?
Judge a gate by its errors in both directions. Letting a bad payment through costs money. Flagging every normal payment costs your team hours and trains people to ignore the gate entirely.
Regression and forecasting extend a line
Regression estimates a number, and time-series forecasting extends history while respecting trend, season, and shocks. That's how you look at cash eight weeks out, or likely demand during a promotion week. If you want the mechanics behind these families, how machine learning works walks through them step by step.
Take a hypothetical SKU that averages about 40 units a week, and say a known holiday usually lifts it to roughly 1.8 times that level. The useful insight isn't the algorithm name. It's the size of the lift and the reorder point that follows from it.
Anomaly detection is a smoke alarm
Anomaly detection compares live activity against a baseline and raises a flag when something breaks pattern. Like a smoke alarm, it's judged by false alarms and missed events, not by how advanced it sounds in a sales deck.
A more sophisticated model does not repair a vague question or a dirty history.
Generative models sit at the overtrusted end of this family tree. They're good at producing fluent summaries and drafts, which makes their errors harder to spot. A confident paragraph about your numbers is still only as sound as the numbers underneath it.
Before you accept any model's output, ask three questions.
- What changed: Which inputs moved, and over what window?
- How wrong has it been: What's the past error on comparable cases?
- What decision changes: What will you do differently if you believe it?
If the person showing you the result can't answer all three in plain words, you don't have an insight yet. You've got a demonstration.
How Models Turn Data into a Decision
The path from raw records to a decision you can defend has six steps. Skip one, and the steps after it get shaky.
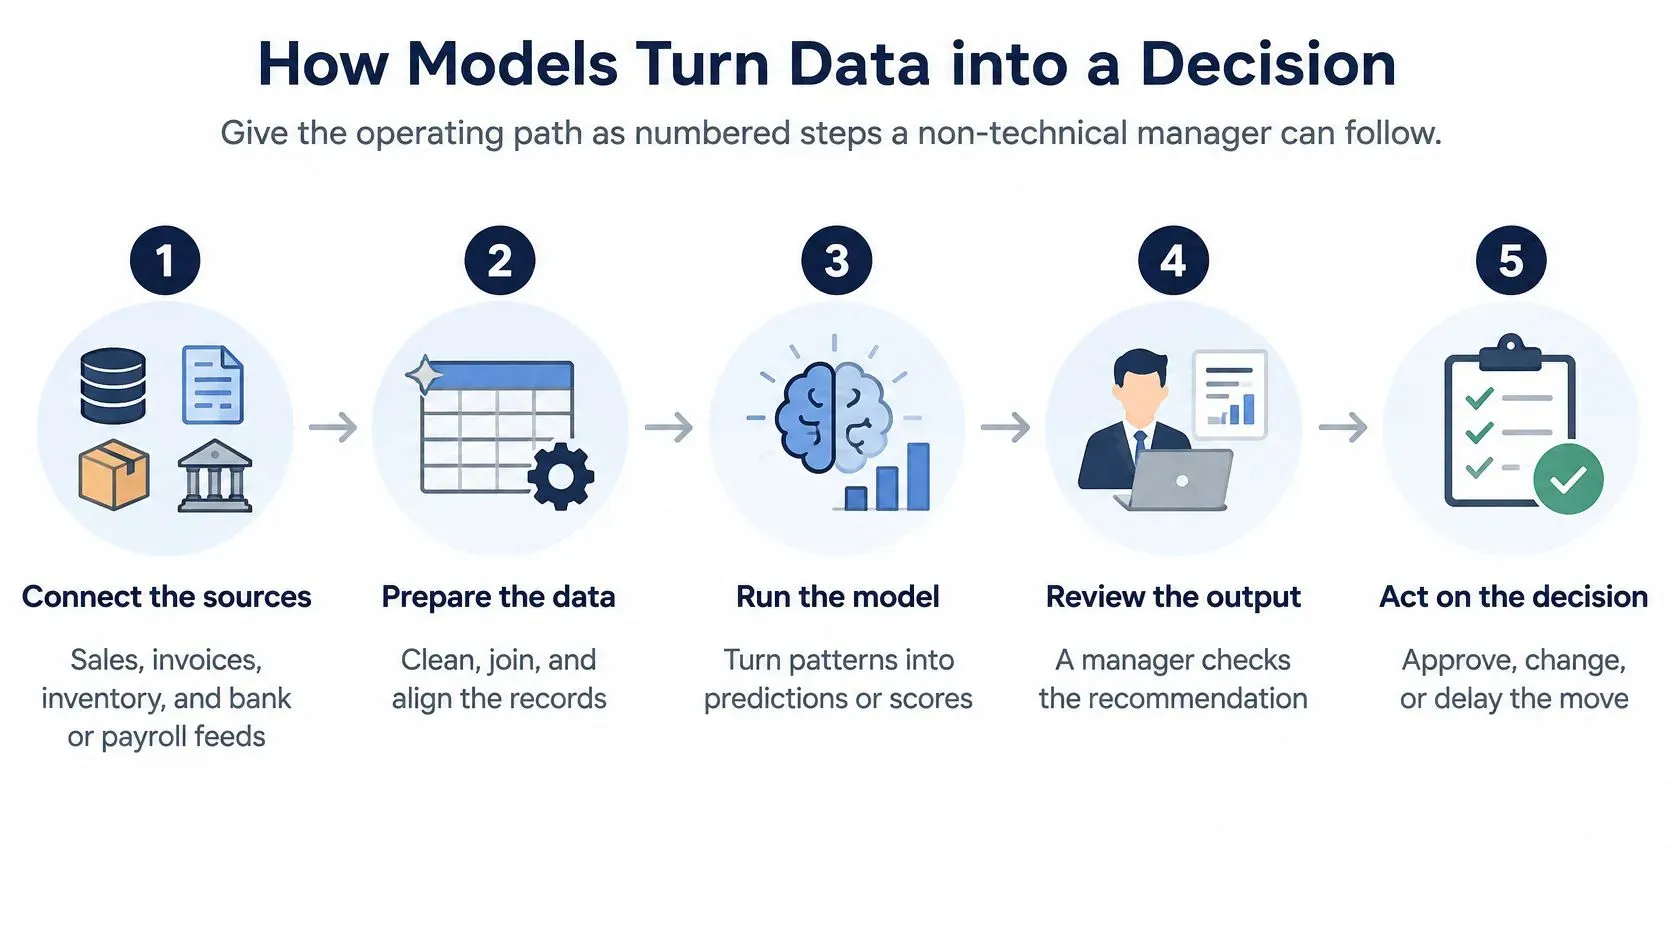
- Connect the sources that hold the decision. Start with sales, invoices, inventory, and bank or payroll feeds. If the data that settles the question lives somewhere else, connect that instead of adding feeds you won't use.
- Clean before any model runs. Fix types, dates, duplicates, and blanks, and record what you dropped. A model trained on duplicated transactions will confidently double-count your revenue.
- Name one question. Decide whether you're asking for a pattern, a forecast, an anomaly, or a ranked action. One question keeps the evidence and the owner clear.
- Run the model on a window you recognize. Businesses often work well with 12 to 24 months of weekly history, because that window holds at least one full seasonal cycle.
- Attach the evidence. Every output should carry its source tables, time window, assumptions, and a comparable prior period, so a second person can check it without rebuilding the work.
- Send it to a named owner with a deadline. An insight that lands in a shared inbox belongs to nobody, and it will be acted on by nobody.
Matching the output to the decision
Output | What the model looks for | Typical inputs | Decision it can support |
|---|---|---|---|
Recurring pattern | Groups and associations that repeat | Sales by product, channel, and week | Which items or customers to treat together |
Forecast | Trend, season, and recent shocks | 12 to 24 months of demand, cash, or payroll | Reorder quantity, hiring, or cash buffer |
Anomaly | A break from a validated baseline | Transactions, stock counts, payment velocity | Investigate fraud, a stock error, or a margin leak |
Recommendation | Ranked options under cost and capacity | Forecast plus price, cost, and stock limits | Promote, reorder, transfer, or hold |
Two edge cases catch teams repeatedly. A demand forecast that ignores seasonality will misread December retail and call a normal peak a breakthrough. An anomaly model trained only on last year's fraud patterns will watch for yesterday's scheme while a new one runs past it.
If you work in financial services, machine learning for financial services leaders gives useful context on how these same steps map onto risk and compliance workflows, where the evidence pack matters even more.
Apply one usability test before anything reaches a manager. Does the output name the metric, the direction, the time window, and the decision it's allowed to influence? If any of the four is missing, send it back to step three and sharpen the question.
Retail Finance and SME Decisions in Practice
Three short scenarios show what changes when an insight has an owner and a baseline to be judged against.

Promotions, inventory, and a payment flag
Retail promotions. A buyer compares promoted sales with what the same items usually sell in a similar week. The blanket discount looked strong, but most of the lift was seasonal demand that would've arrived anyway. Next time, she cuts the discount and keeps the margin. ELECTE's guide to what-if analysis shows how to test that counterfactual before the promotion runs, not after.
Inventory. Say a forecast flags a fast-moving hiking boot in size 42, roughly two weeks from a stockout, while size 46 sits heavy in the same store. The team transfers stock between locations instead of reordering blindly, and avoids a markdown on sizes they already own.
Financial services. A rise in payment velocity on one account triggers a same-day review by a named compliance owner. Monitoring support like this is not legal, AML, or investment advice, and it doesn't replace a qualified reviewer who signs off on the action.
Where SMEs actually stand
Adoption among smaller firms is rising, but it's far from universal. In the OECD's 2025 D4SME survey, 39% of surveyed SMEs used at least one AI application in core business activities or products, up from 26% in 2024, and generative AI was used by 26%, up from 18%.
The reported impact is mostly practical, not dramatic. In that same survey, 43% of respondents said AI had a moderate effect, such as reducing manual work or improving accuracy, while 18% reported a significant improvement in efficiency, productivity, or decision-making.
A separate pattern points the same way. Among SME generative-AI adopters in the OECD's late 2024 seven-country survey, 65% said it improved employee performance, compared with 35% for helping them scale operations, 29% for competing with larger companies, and 26% for increasing revenue.
Read those two sets of numbers together. For a small team, the earliest win is usually accuracy and hours returned to people who know your customers. A new revenue line, if it comes, tends to come later and through better decisions, not through the model itself.
Copy the structure behind the scenarios, not the scenarios themselves. Pick one metric, one owner, and one weekly review, and let that loop run before you add a second use case.
When to Stop, Verify, or Act on an Insight
When should you refuse to believe a result? Most guides skip that question. It's the one that protects your margins.
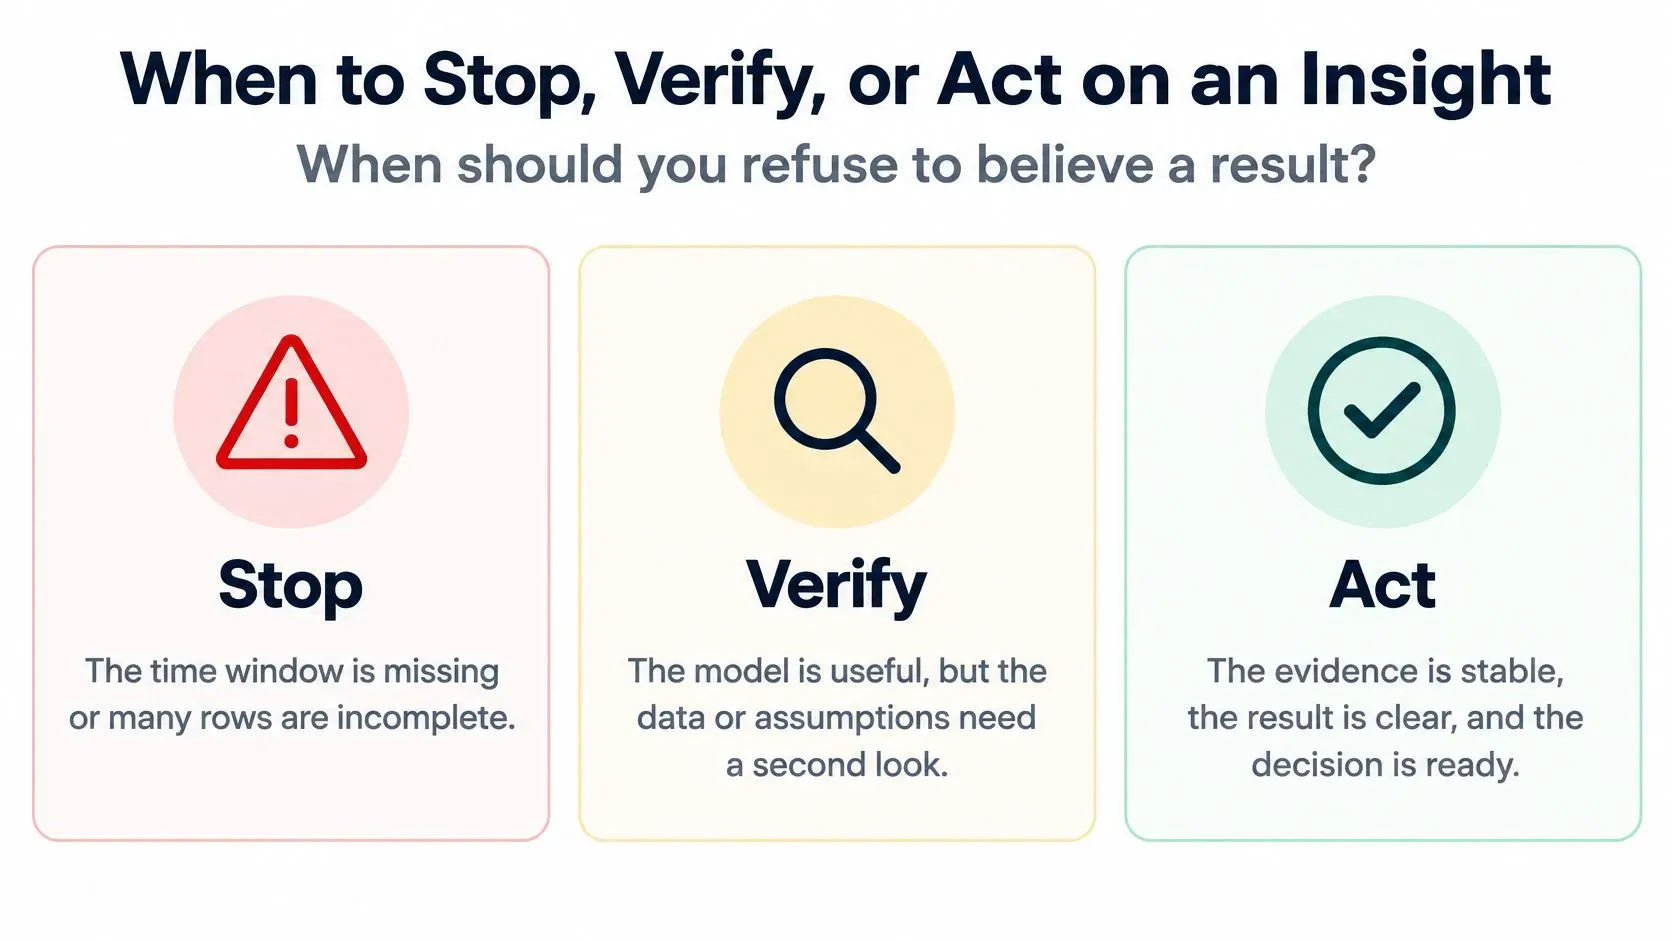
Three lanes for every output
Lane | Trigger | First action |
|---|---|---|
Stop | Missing time window, many blank rows, contradictory sources, or unlabeled promotion or season | Pause the insight and fix the data first |
Verify | Real signal with unclear cause, such as ads and sales rising together | Test against a comparable period or holdout group before acting |
Act | Evidence pack attached, past error acceptable for the downside, and a named owner | Act and log the decision as a ledger line |
The stop lane exists because unreliable inputs are common, not exceptional. In Informatica's 2025 survey of data leaders, 43% cited unreliable results, 45% cited uncertainty about responsible AI use, and 38% cited poor data quality as barriers to demonstrating business value.
The verify lane is where correlation gets mistaken for cause. Ad spend and sales rising together in December don't prove the ads caused the sales. Test against a comparable period, or hold out one store or region, before you scale the spend. The benefits of human-in-the-loop in AI analytics are clearest here, because a person who knows the season can spot what the model can't.
Explain confidence in words your team can act on. Show a forecast as a range rather than one heroic number, and keep alert volume within what a small team can reasonably review in a day. An alarm that fires constantly gets muted, and then it protects nothing.
Watch for drift, too. Data drift means your inputs have changed shape, and concept drift means the relationships behind them have changed, such as a new returns policy or a shifted fraud pattern. Either one can make a once-good model systematically wrong, so compare live results against a validated baseline and have a domain expert review high-impact alerts.
One privacy rule sits underneath all three lanes. Use only data your business has the right to process, and keep personal data out of shared alerts and screenshots.
Before anyone changes a price, an order, or a risk rating, run five checks. Source, window, contradiction, season or promotion, and named owner.
If a result fails any of the five, you already know its lane. Stop or verify. Don't act and hope.
An Insight to Action Ledger for Real Value
Producing insights is activity. Proving one changed money, hours, or risk is the harder job, and many haven't closed that gap yet.
In Deloitte's generative AI ROI survey, only 15% of surveyed organizations using generative AI reported significant, measurable ROI, while 38% expected to achieve it within one year. A separate finding in that work put the typical satisfactory AI payback period at two to four years, compared with a seven-to-12-month expectation for technology investments, and only 6% reported payback in under a year.
A ledger you can copy today
Insight | Decision taken | Owner | Result vs baseline |
|---|---|---|---|
Reorder alert on a fast-moving SKU | Reorder earlier at the forecast quantity, no emergency order | Store operations lead | Emergency freight and stockouts down over four weeks vs prior four, promo period excluded |
Payment velocity anomaly | Same-day manual review of flagged account | Compliance owner | Confirmed cases and review time vs prior month, with false alarms counted |
Each row forces four answers. What did the model say, what did a person do, who owns it, and what happened compared with a baseline period? If a row can't be filled in, the insight hasn't created value yet, whatever the dashboard shows.
Keep two kinds of measures apart. Leading indicators like forecast error, alert response time, and adoption tell you the system is being used. Outcomes like margin, cash, hours saved, and stockouts avoided tell you whether using it was worth it. Celebrating the first group while ignoring the second is how teams end up busy and no better off.
Work the retail row through. The reorder insight is judged on emergency freight and stockouts over four weeks against the prior four. If a promotion ran in only one of those periods, call it out in the row so it can't take the credit. Check seasonality the same way before you attribute any change to the model.
Retire insights on clear rules, not on feelings.
- No owner: Nobody is accountable, so the alert stops.
- No action in 30 days: The team has voted with its calendar.
- Measurement costs more than the loss prevented: The check itself is the waste.
A dashboard full of accurate insights can still have negative value if nobody acts on it. The ledger is how you find that out early, while fixing it is still cheap. None of this promises a payback period or a return. It gives you the evidence to see your own numbers clearly.
Key Takeaways for Your Next Insight
Five steps turn model output into decisions your team can trust and measure.
- Define it before you run it. Every insight needs an owner, a metric, a time window, and the decision it may change. Without an owner, it's output, not an insight.
- Clean and label first. Fix types, dates, duplicates, and blanks before any model runs, and record what you dropped so you can explain every result later.
- Use the three lanes. Apply stop, verify, or act before changing a price, an order, or a risk rating, and keep the five-point check within reach.
- Judge by the ledger. Compare each decision's result with a baseline period. Alert counts measure activity, not value.
- Start with one loop. Log a single recurring decision this month and review its ledger line before you add a second alert.
Each step is small on its own. Together, they're the difference between a model that ran and a business that decided better because it ran.
Run One Decision on a Weekly Cadence
Pick one recurring decision to run next. Cash four weeks out, a weekly reorder, or a promotion review all work, as long as the same question comes back on schedule.
Give it one owner and a fixed weekly slot. Each week, the loop produces one pattern or forecast with its evidence pack attached. Any signal that lands in the stop lane gets refused. Every acted-on result becomes a single line in the ledger, where money or risk either moved or it did not. That last part is what makes the cadence worth keeping: the insight earns its place only when a decision, an owner, and a number changed because it ran.
After four weeks, judge the loop on one outcome metric against the prior four. Alert count and report polish measure the wrong thing. Did stockouts fall, cash forecasting tighten, review time drop? If the ledger shows no change, the loop produced output, not value.
For measurement design, NIST guidance on monitoring AI systems recommends measuring accuracy, reliability, resilience, explainability, privacy, safety, and bias, and reassessing those controls regularly. The OECD's work on AI adoption by SMEs gives you adoption benchmarks to pace your own rollout against. Fabio Lauria's free whitepaper, "AI for European SMEs: The 2026 Playbook," published in February 2026, covers decision frameworks, ROI calculations, and implementation playbooks if you want a structured companion.
ELECTE, an AI-powered data analytics platform for SMEs, can run this loop from your connected data, with an average setup time of 5 minutes from connection to first insight. It saves customers 10+ hours per week by automating financial analysis, so your team spends its time deciding rather than assembling reports.
Two limits stay in plain view. Results depend on your data quality and on someone acting, so no return is guaranteed, and you should connect only data you have the right to use. Financial, risk, and compliance outputs still need a qualified human before they become a filing or a customer action.
Ready to run your first weekly decision loop? Visit ELECTE to connect your data, generate your first evidence-backed insight, and start logging decisions your team can measure.
Comments
No comments yet — start the conversation.