Data Quality Monitoring: Dimensions, KPIs and Alerts
Learn data quality monitoring KPIs for completeness, accuracy and timeliness, plus alerts that catch bad data before it hits reports.

Your reports can look polished while the numbers underneath them are late, duplicated, or missing. That's the problem data quality monitoring solves. It checks the data you rely on before a forecast, board pack, or replenishment order uses it. You'll learn which metrics to track, how to set thresholds that match the decision at risk, and how to build alerts a small team can act on.
Why Poor Data Quietly Drains the Budget
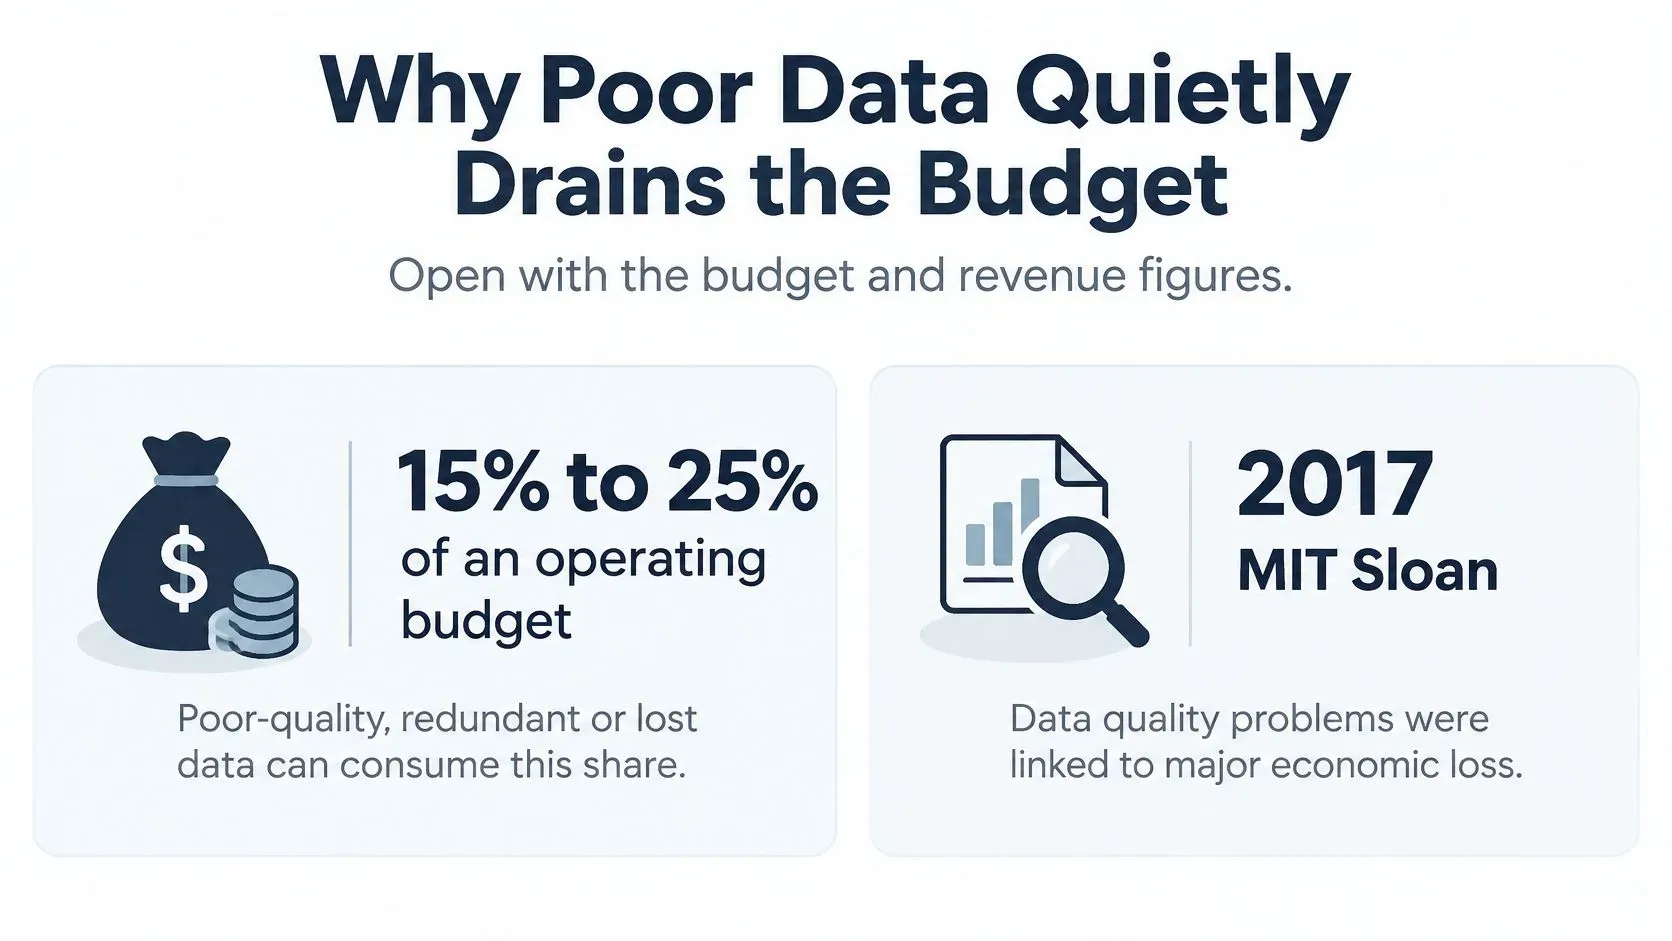
When customer names differ between invoicing and a CRM, someone has to find the mismatch and correct it. That work takes time away from analysis. Multiply it across sales, stock, and supplier files, and the hours spent reconciling records become visible on the timesheet.
Where the Money Goes
- Visible costs: Staff time spent on rework, manual reconciliation, failed transactions, and delayed reporting.
- Harder-to-trace costs: Decisions based on incorrect information, missed opportunities, compliance exposure, and reputational damage.
Data quality monitoring means recurring checks that catch invalid, incomplete, duplicated, inconsistent, or outdated data before it reaches operations or analytics. A one-time cleanup may help prepare a monthly report, but live feeds can carry the same bad record into multiple outputs before anyone spots it. That is why reliable forecasts start with clean data. Routines for keeping customer records consistent during close can also reduce manual correction.
For AI-driven analytics such as ELECTE, stale or incomplete inputs can affect generated insights. Checks on freshness, completeness, and consistency help keep those outputs grounded in the data available.
Six Dimensions and the Metrics to Watch
There's no single quality score you can trust. A feed can be perfectly on time and still full of duplicates. Track six dimensions separately, each with its own rate, so you can see exactly what's failing.
Dimension | What it measures | Metric | Alert when |
|---|---|---|---|
Completeness | Share of required values or expected records present | Populated required fields or received records / expected total | Null rate or missing records rise, or the expected feed is empty |
Validity | Conformity to syntax, type and allowed range | Valid records / total records | Invalid rate exceeds the agreed tolerance |
Accuracy | Closeness to the real-world value | Matched sample or reconciled amount / records checked | Sample error or reconciliation break exceeds tolerance |
Timeliness | Lag from the event to usable data | Minutes or hours from event time to ingestion or query; report p95 and p99 | p95 freshness misses the SLA or delay jumps versus baseline |
Uniqueness | One record per real entity or transaction | Duplicate keys / total keys | Duplicate rate spikes versus the historical baseline |
Consistency | Agreement of the same fact across systems | Mismatched records / records compared | Cross-system mismatch exceeds tolerance |
The Three You Can Measure on Day One
The NIST QDAR definitions for quality data define validity as conformity to expected syntax, type, and range, completeness as the proportion of potentially available information that is captured, and timeliness as the lag between a real-world event and its documentation or readiness for use. Those definitions translate directly into the formulas in the table.
Completeness needs an external denominator. Without an expected transaction count, asset inventory, or source-control total, an empty feed looks healthy because zero missing fields out of zero records reads as perfect. If you run a product catalogue, the same logic helps you improve catalog accuracy and completeness by comparing received SKUs against the list you expected.
Practical rule: If you can't name the expected total, you can't measure completeness. You're only measuring what's blank in what arrived.
Why Averages Hide the Problem
Timeliness is where averages mislead most. A mean delay of twenty minutes can hide a small group of records that arrived six hours late, and those late records are often the ones that change a stock or cash decision. Track p95 and p99 freshness instead. The p95 tells you the delay that 95 percent of records beat, so a worsening tail shows up immediately.
Accuracy works differently from validity, and confusing them is common. A sales amount can pass every format check and still belong to the wrong store. You only catch that by sampling records against a trusted source or reconciling totals, which is why practical examples of data validation pair format checks with cross-source comparisons.
Uniqueness and consistency are ratio checks too. Duplicate keys divided by total keys tells you whether the same transaction landed twice. Mismatched records divided by records compared tells you whether two systems agree on the same customer, price, or balance.
Baseline First, Then Alert
Run each metric for a few normal cycles before you set an alert. Then trigger on two conditions: an absolute breach of your agreed limit, and a sudden shift in volume, null rates, or category mix versus that baseline. A slow drift matters less than a Tuesday feed that suddenly carries half the usual rows.
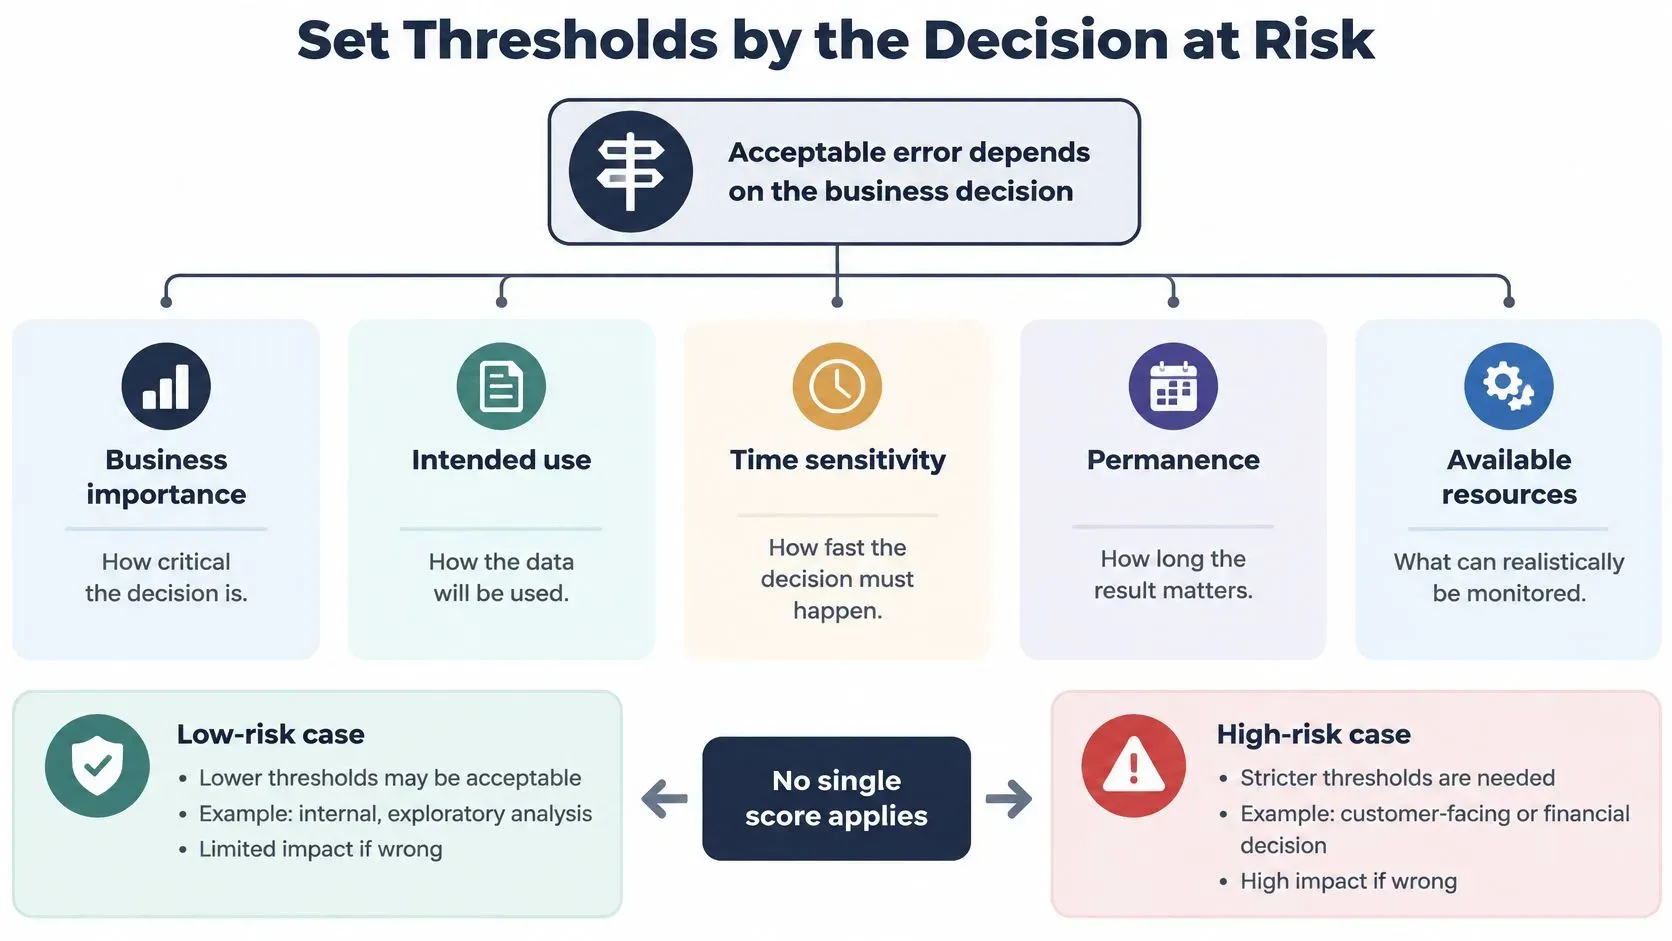
Set Thresholds by the Decision at Risk
A daily executive revenue report can tolerate a short ingestion delay. A fraud signal can't. If you apply one freshness target to both, you'll either over-engineer the report or under-protect the risk check. Thresholds belong to decisions, not datasets in the abstract.
The NIST information quality standards recommend setting acceptable error levels according to business importance, intended use, time sensitivity, permanence, and available resources. NIST also frames information quality through utility, integrity, and objectivity, which is a useful reminder that data only has to be good enough for the job it supports, and no worse.
Decision | Freshness need | Owner | Call a person when |
|---|---|---|---|
Daily executive revenue report | A short delay of a few hours can be acceptable | Finance analyst | The forecast or board pack would change |
Inventory replenishment | Near real time | Operations manager | Stockout risk or a promotion would misfire |
Cash position | Same day or intraday | Finance lead | Payment or payroll timing is at risk |
AML or fraud signal | Near real time | Compliance owner | Any material change in the risk score |
Regulatory or compliance report | Ready by the reporting cutoff | Compliance owner | A control fails before filing |
Format Checks Are Not Proof
Syntax, type, and range tests catch values that can't be right. They can't prove a plausible value is right. A correctly formatted amount can sit on the wrong store, the wrong customer, or a duplicated transaction. For decisions that move money, add business-rule checks (does this order exceed the customer's credit pattern) and reconciliation checks (does the total match the source system).
Route alerts by business impact, not by failure count. Fifty blank optional fields matter less than one missing bank feed.
What a Useful Alert Contains
- Dataset and failed rule: Which feed broke which check.
- Deviation from baseline: How far today's value sits from normal.
- Downstream impact: Which report, forecast, or model reads this data.
- Owning team: The named person who acts first.
Noisy alerts are the main cost for a small team. Every low-value warning consumes the attention a high-impact failure needs, and people start ignoring the channel altogether. Review alert volume monthly. Retire any rule that has never changed a decision, and tighten the ones that did.
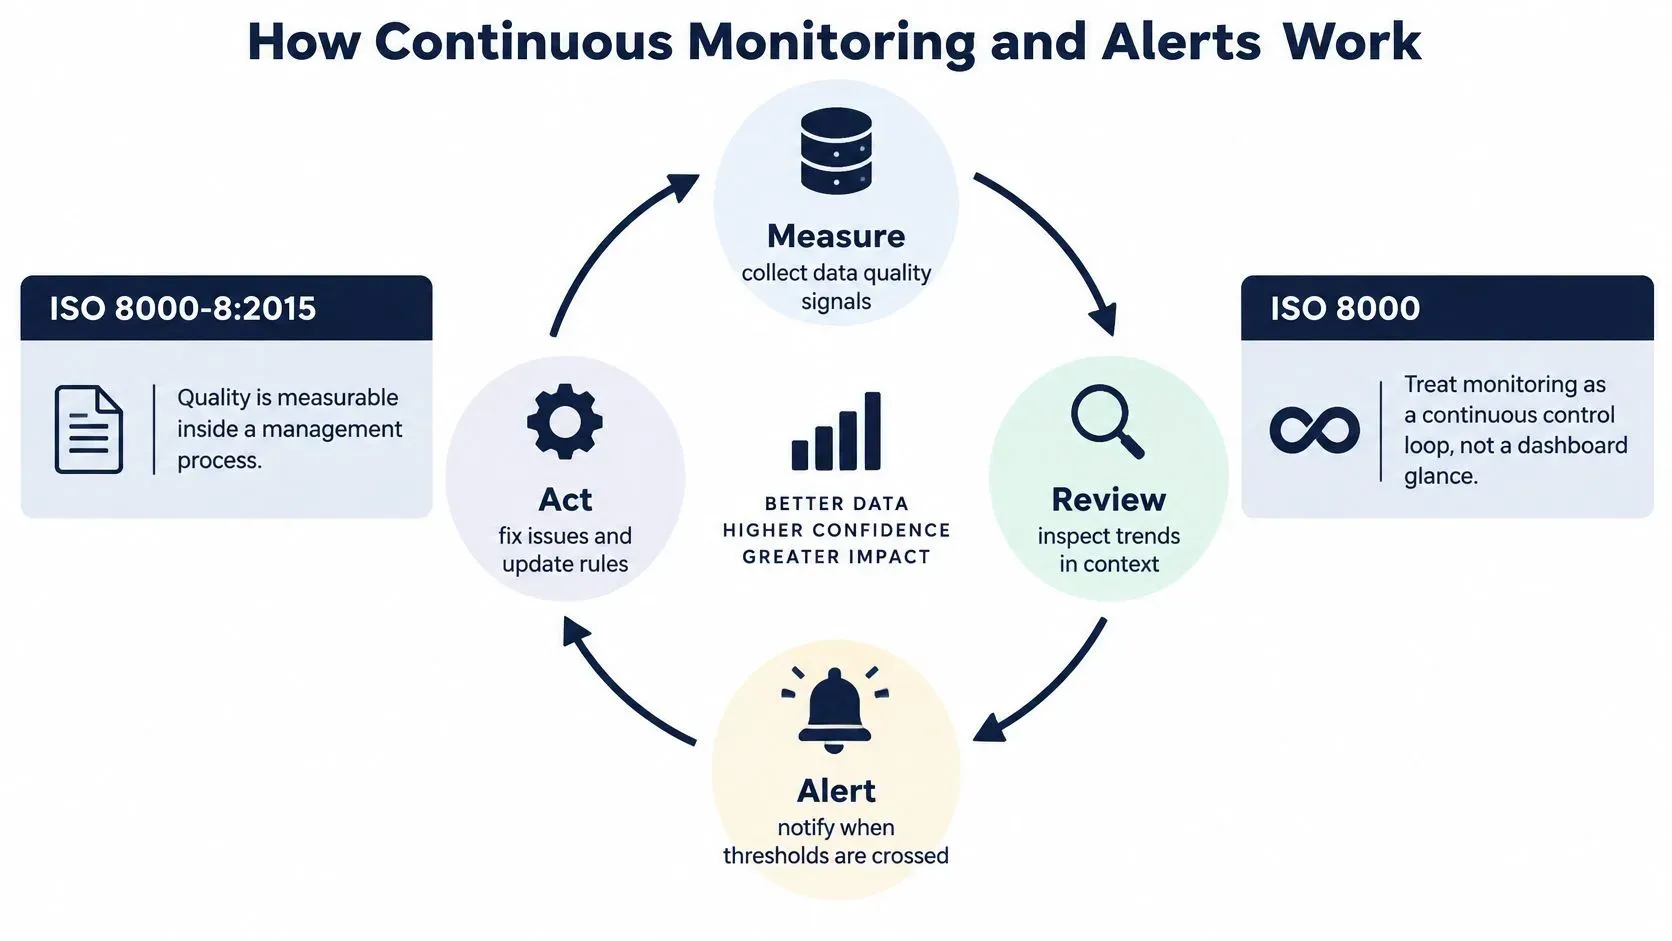
How Continuous Monitoring and Alerts Work
Monitoring works as a management loop, not a dashboard you glance at when something feels off. The ISO 8000-8 standard on data quality concepts treats quality as measurable inside a management process. ISO 8000-8:2015 sets foundational concepts for measuring quality, ISO/TS 8000-81:2021 describes profiling through structure analysis, column analysis, dataset statistics, and relationship analysis, and ISO 8000-100:2016 adds computer-checkable requirements for master data. In plain terms, you define what good looks like, measure against it on a schedule, and keep the evidence.
The Seven Step Routine
- Pick the decisions and name owners. List the reports and actions each dataset feeds, then assign one owner per dataset. Without an owner, alerts become everyone's problem and no one's job.
- Profile a baseline. Record row counts, null rates, value ranges, key uniqueness, and relationships between tables during a normal period. This baseline is what later runs get compared against.
- Write a small rule set. Cover validity, completeness, timeliness, uniqueness, and consistency, plus one reconciliation for accuracy. Give each rule a service level tied to its decision.
- Run rules on every load or on a schedule. Store each result with a timestamp. A stored history lets an auditor, or your future self, see exactly what failed and when.
- Compare against the baseline. Alert on threshold breaches and on sudden drift in volume, nulls, or category mix, since drift often appears before a hard breach. This is also where you detect unusual sales and refunds that pass format checks but break pattern.
- Route the alert with context. Send the dataset, rule, deviation, affected report or model, and owner in one message. Context is what turns a notification into an action.
- Fix or quarantine before use. Hold bad records out of the forecast or board pack, correct them at source where you can, and record the cause. Unrecorded causes repeat.
Two Edge Cases Worth Planning For
A schema change in a source system can break a relationship between tables overnight. Your profiling step catches it only if relationship checks run on every load, not monthly. A late source creates the opposite trap. If you measure completeness against whatever landed, a half-arrived feed scores perfectly. Measure against the expected count instead.
Tune starting tolerances from your own history rather than copying someone else's numbers. Take a rolling baseline of comparable periods, set the alert band at the normal spread of those periods, and widen it only after a reviewed false alarm. End each week by reviewing which rules fired and which ones changed a decision. That review is what keeps the system lean.
Retail and Finance Cases That Change the Rules
A missing store feed and a mismatched cash balance can both pass basic format checks, yet each can distort a different business decision. The right quality test depends on what the numbers will drive.
Retail Promotions and Stock
For a promotion planned by store and SKU, measure completeness against the expected store-and-SKU count. If you count only rows that arrived, a missing store feed can look like zero demand. Set a tight timeliness target too: stale stock data may trigger a reorder for items already on the shelf, or keep a promotion running after stock is gone. Uniqueness checks catch duplicate transactions before they inflate demand and affect the next order.
An actionable alert identifies the affected stores, the freshness check that failed, and the replenishment or promotion report at risk. That gives the operations manager a chance to pause the promotion for those stores before customers reach the till.

Finance Cash and Compliance
For cash and compliance decisions, accuracy means reconciling balances to the bank or ledger. A value can be correctly formatted and still be wrong. Check cash data the same day or intraday when payroll and payment timing depend on it. Consistency checks should confirm that customer identifiers match between the ledger and risk file. A material change in an AML score should reach a person for review rather than wait for the weekly cycle.
Each dataset needs a named owner who responds when its numbers slip. A 2025 data-quality benchmark survey from Synq reported that nearly 20% of respondents had experienced a single data incident costing more than USD 10,000. The survey also found that insufficient knowledge of how to test effectively was the leading challenge, while nearly 40% planned to increase investment in data quality and observability.
More alerts don't mean better quality. A short list of owned checks for inventory, cash, forecasts, and filings is easier to maintain and act on than a long checklist.
These controls support operational processes; they are not legal or compliance advice. For regulated decisions, confirm requirements with your compliance lead or adviser.
Monitoring Documents Images and Other Inputs
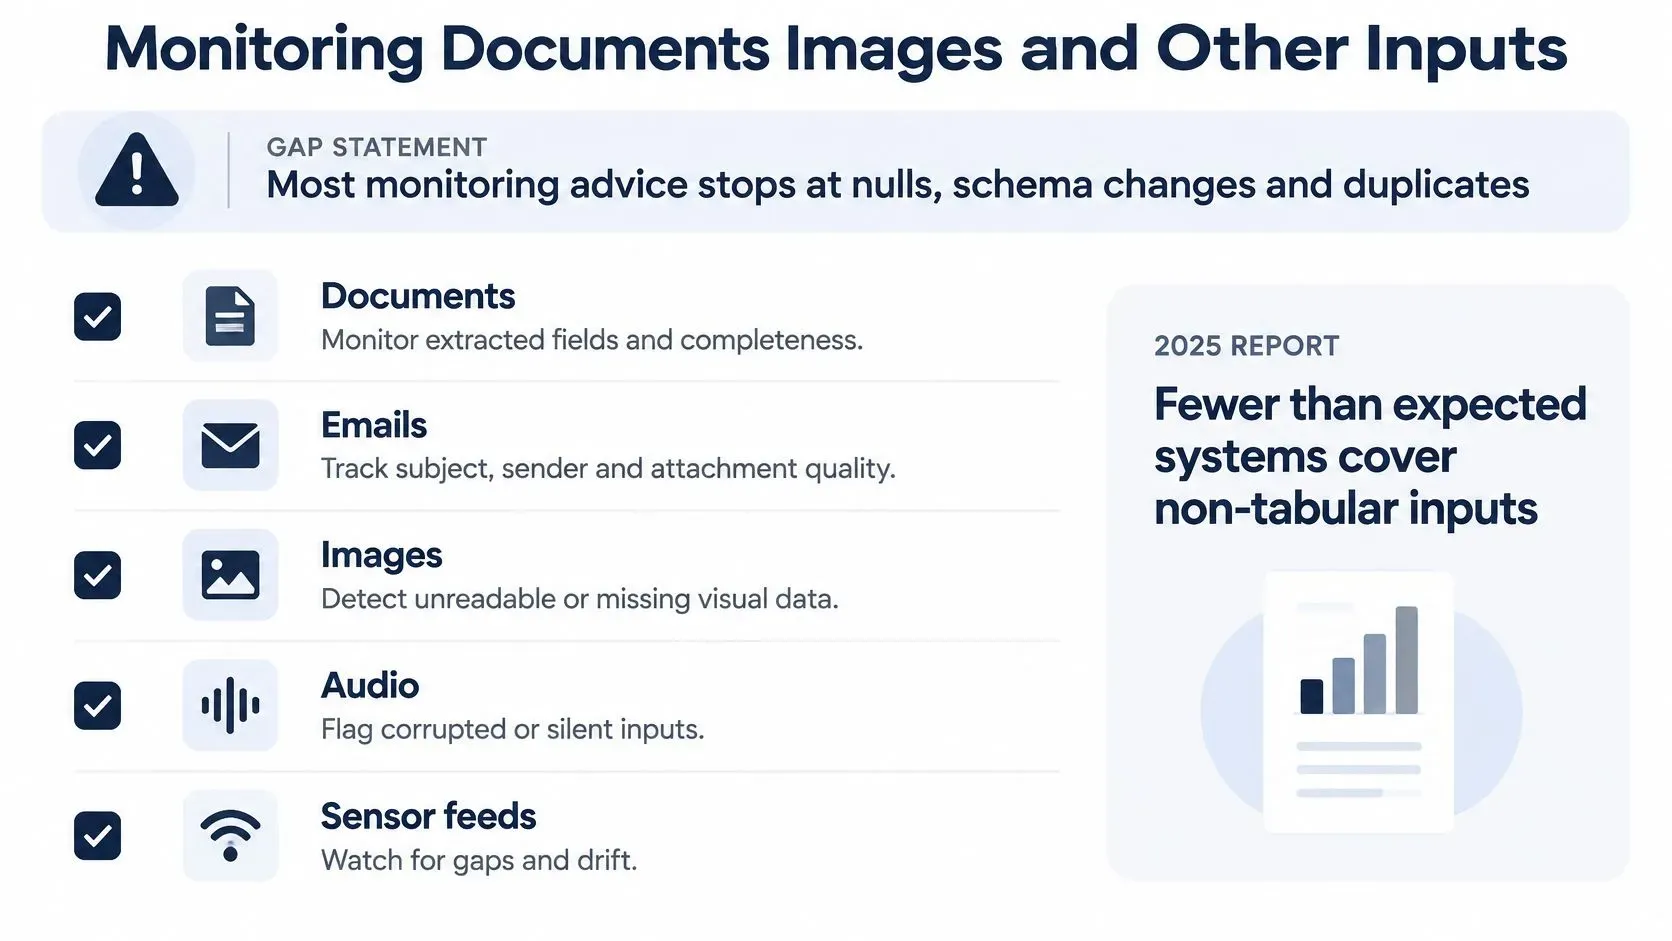
Most monitoring advice stops at nulls, schema changes, and duplicates in tables. AI analytics now also reads documents, emails, images, audio, and sensor feeds, and those inputs fail in quieter ways. A scanned invoice doesn't have a null rate. It has a misread decimal point.
A 2025 report on enterprise AI trust covered by insideHPC found that fewer than one-third of organizations currently feed unstructured data into AI models, that 42% of data and analytics leaders still do not trust their AI/ML outputs, and that 51% identify skills gaps as a primary barrier to observability maturity. Only a small fraction apply structured observability or automated quality checks to those inputs.
Translating the Six Dimensions
- Completeness: Missing files, missing pages in a contract, or missing metadata such as source, author, and timestamp.
- Validity: The file type matches expectations, extracted text is readable, and the timestamp parses into a real date.
- Accuracy: For scanned invoices, the OCR error rate on a sampled set of amounts and dates checked against the source document.
- Uniqueness: The same contract, email, or delivery photo ingested twice under different file names.
- Timeliness: Still the lag from the real-world event to the file being available for analysis.
- Consistency: Labels and categories mean the same thing across people, sites, and time.
Checks That Only Exist for These Inputs
Three controls have no tidy table equivalent. Annotation consistency matters when people label images or tag emails, because two reviewers applying different standards train your analysis on noise. Provenance records which system or person produced a file, so you can trace a bad insight back to its source. Semantic drift appears when the meaning of a category shifts, for example a support tag that starts covering refunds as well as complaints, even though the schema never changed.
Be plain about where a person must review. Legal wording, clinical notes, and any case where a small meaning error would change a forecast, a risk view, or a customer action need human eyes. Automation flags a missing timestamp or a spiking OCR error rate reliably. It won't judge subtle context, sarcasm in an email, or a clause that reverses an obligation.
A Starter Set You Can Run Without Specialists
- File arrival check: Expected files received, counted against a schedule.
- Metadata check: Source, author, and timestamp present and parseable.
- Extraction sample: A small set of documents rechecked by hand each cycle for OCR or transcription errors.
- Duplicate check: File hashes or document IDs matched before ingestion.
- Review queue: Low-confidence extractions routed to a named reviewer before use.
Put Checks on the Decisions That Move Money
A useful monitoring rule protects a decision, not just a data field. Choose the checks that could change a replenishment order, cash plan, or board forecast, then decide who acts when a check fails.
Your First Week
- List three decisions that would hurt this month if the numbers were wrong, such as replenishment, cash, or a board forecast.
- For each decision, set checks for expected records, valid values, agreement with a trusted source, and how recently the data was updated.
- Name an owner and write down when that person should be notified.
- Hold or flag the affected report when a high-impact rule fails, so questionable figures are reviewed before they guide a decision.
- Review alerts after a week. Keep rules that prompt useful action and remove those that do not change a decision.
ELECTE offers data analysis without requiring an analyst. Its AI Agent can analyze revenue drift, compare forecast models, and prepare board decks. Scheduled reports use current data and describe what changed since the previous report. Your team still sets the thresholds and decides how to respond.
Connect your sales, accounting, and banking sources to ELECTE to centralize access to your data and use dashboards and KPIs to review it. Before the next board pack, assign an owner and set a threshold and alert for the three decisions that move money in your business.
Comments
No comments yet — start the conversation.