Agentic Business Intelligence Explained for SMEs
Agentic business intelligence watches data, explains change, and prepares decisions. Compare it with classic BI, learn the risks, and start a value test.

Agentic business intelligence is analytics that watches connected data on its own, explains what changed, and prepares or triggers the next decision instead of waiting for someone to open a report. You're probably not short of numbers. You're short of numbers that arrive in time, with an explanation you can check and a next step you can approve.
That's the practical promise here, and it's narrower than the hype suggests. You'll get most value if you treat autonomy as supervised and measurable, start with one workflow, and judge it on outcomes over 90 days rather than on how many alerts or reports it produces.
What Agentic Business Intelligence Changes
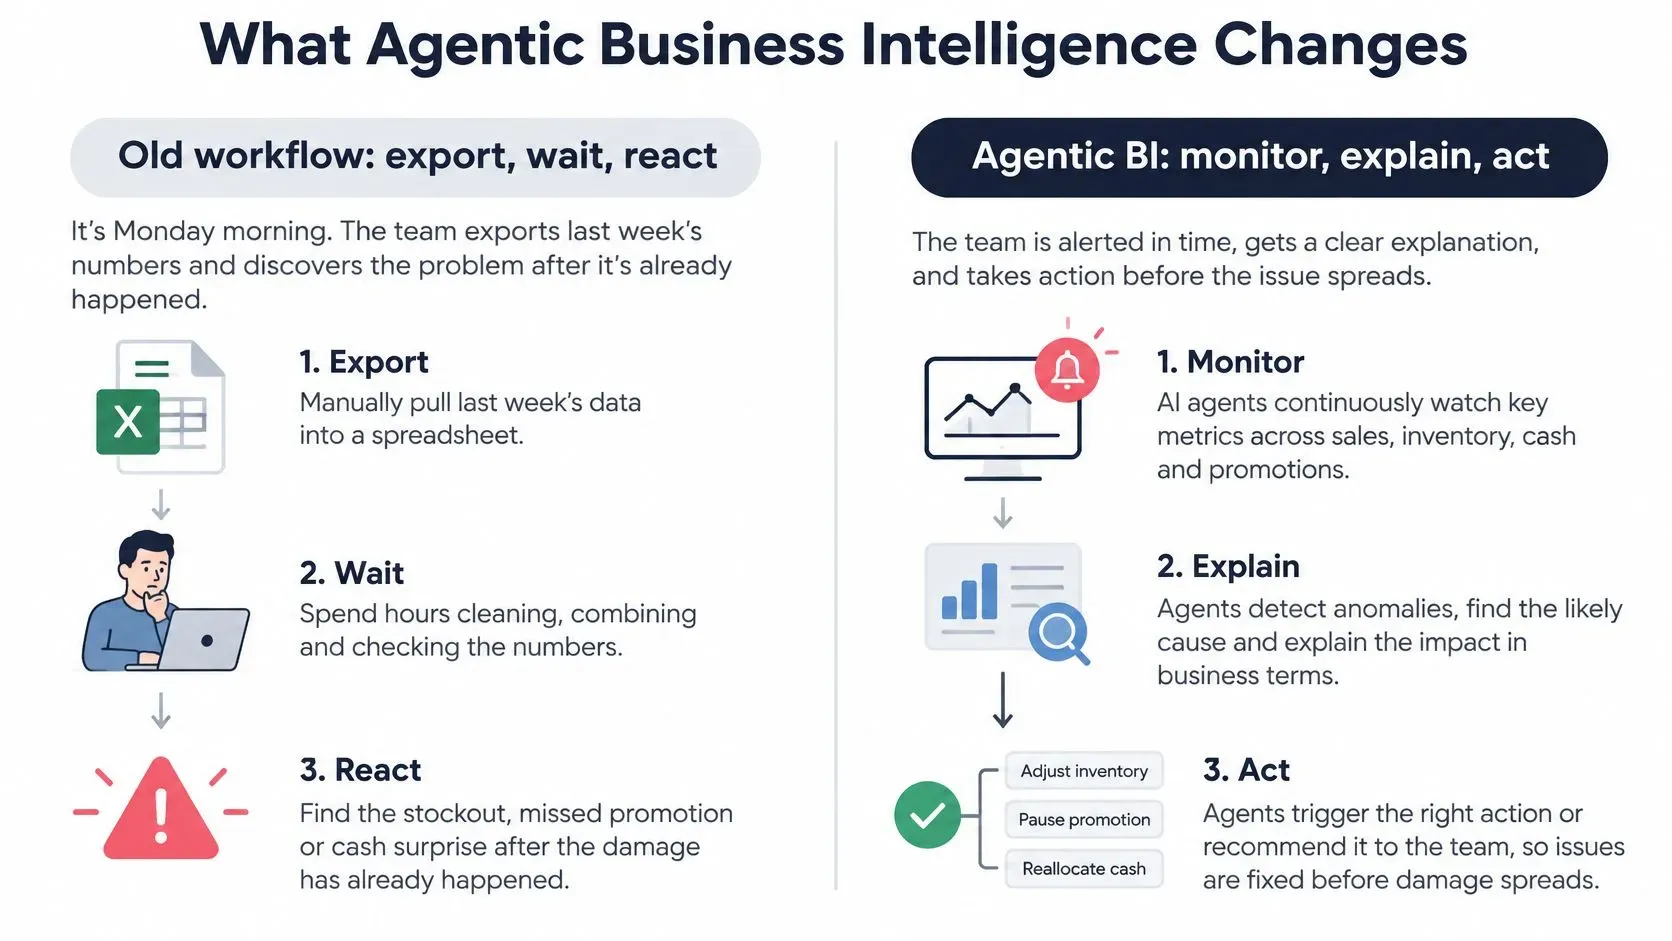
It's Monday morning. Your retail or finance team exports last week's numbers, tidies them in a spreadsheet, and discovers the stockout, missed promotion, or cash surprise after it's already cost you margin. The report is accurate. It's just late, and somebody still has to work out why the number moved.
Think of a dashboard as a filing cabinet. An agent is the night-watch analyst who checks the cabinet overnight and leaves a note on your desk. The note says what changed, what likely caused it, and what you'd do next.
Five Terms Worth Knowing First
- Schema means how tables and fields are named and related.
- Lineage means the record of where a number came from and how it was changed.
- EBIT means earnings before interest and tax, the profit measure used in the McKinsey survey.
- AML means anti-money-laundering checks.
- Counterfactual means what would have happened without the agent.
Job | Traditional BI | Agentic BI |
|---|---|---|
Who starts the analysis | A person opens a report | The agent watches data on a schedule or on change |
When insight appears | After someone looks | As soon as a threshold, anomaly, or refresh hits |
What you receive | Charts, tables, and filters | A written insight, the numbers behind it, and a suggested next step |
Who may act | Always a human | Low-risk alerts can run; high-impact actions need approval |
Skill required | Report builders and analysts | A business owner who can check the evidence |
Typical failure | Stale dashboards nobody opens | A fluent but wrong conclusion if tools and data are unchecked |
In 2025, 29% of organizations reported already using agentic AI, while 44% planned to implement it within the following year, according to Blue Prism's Global Enterprise AI Survey. That's why this reads less like a demo and more like an operating change. If your core systems also need tighter automation, it's worth understanding connected ERP automation for growing businesses from SIX ERP, because an agent is only as useful as the systems it can reliably read.
How the Analytics Agent Loop Works
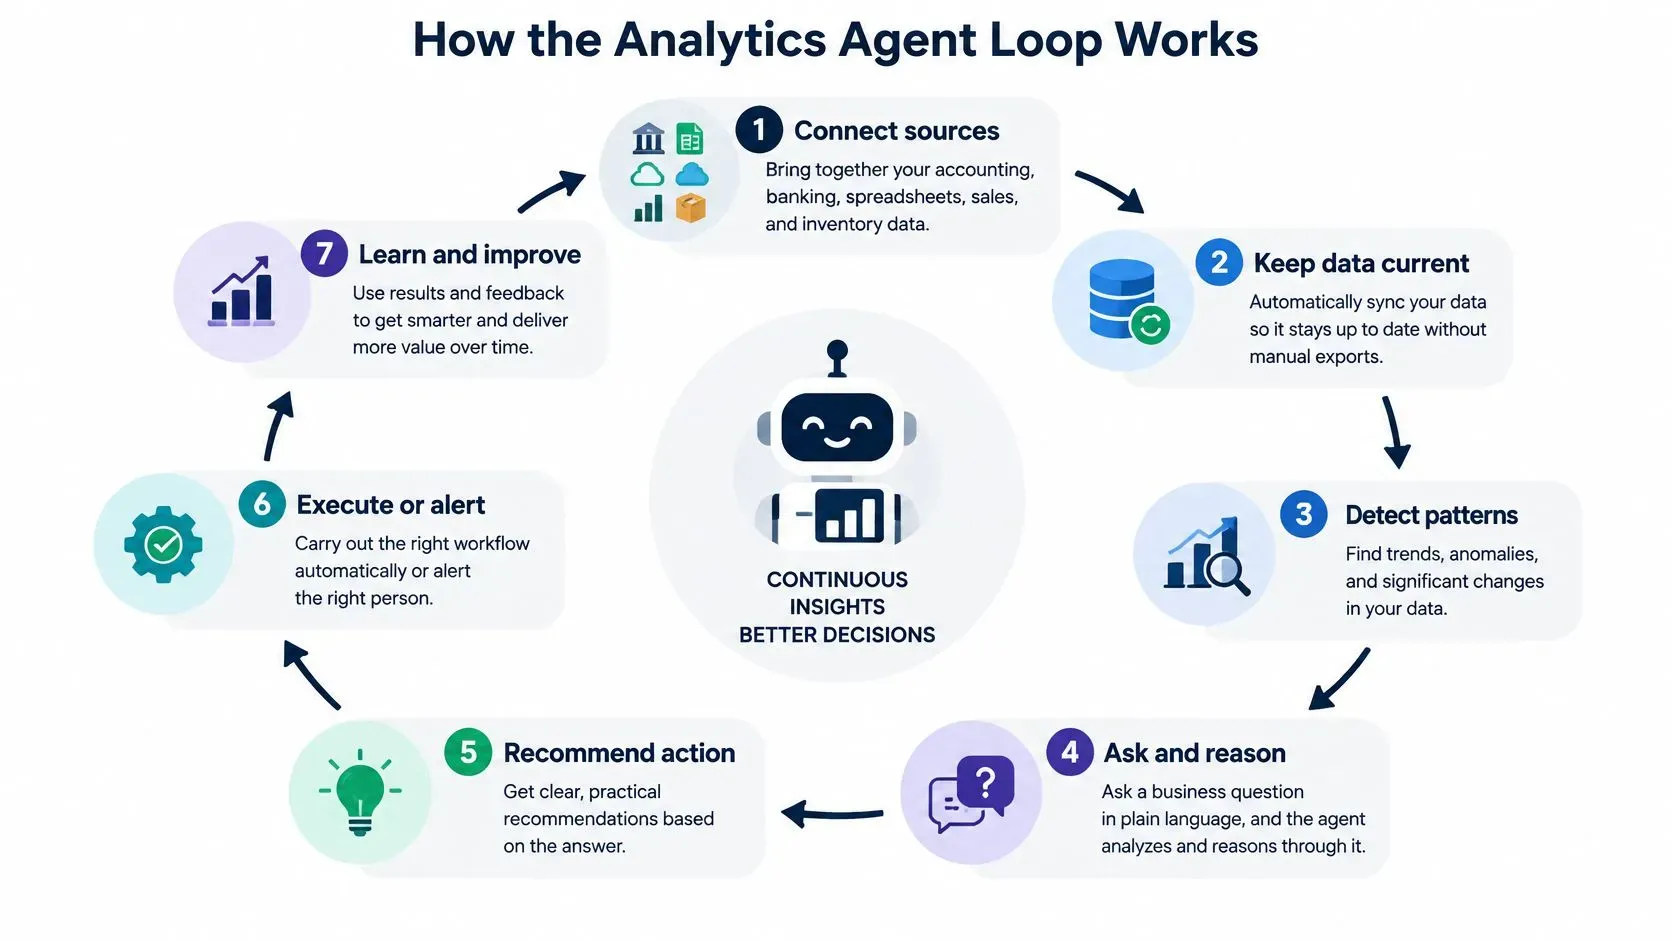
A sales report can show a decline without explaining whether demand fell, stock ran out, or a promotion ended. An analytics agent works through a defined sequence to check the data, calculate the change, and show the evidence behind its explanation.
The Six Stages in Order
- Connect sources. Bring together accounting, banking, spreadsheets, sales, and inventory data. ELECTE's dashboard centralizes data sources and keeps them current without exports.
- Check the data first. Confirm that data is fresh and that fields and formats are intact. If a source is stale or a field is missing, pause the analysis rather than present a confident-sounding conclusion.
- Run a fixed plan. Identify the relevant tables, join them, apply the agreed metric definition, and calculate. A model should not invent a formula for a business metric.
- Compare against a baseline. Check the result against a forecast, prior period, or threshold. “Sales fell” becomes more useful when you know how the result compares with the plan.
- Explain with evidence. Show the filters, joins, and formulas behind the finding, along with a confidence indicator that a manager can interpret.
- Route the result. Send a low-risk alert or prepare a report for review. Hold decisions with significant business impact for a person to approve.
Practical rule: If you can't see the filters and formulas behind a sentence, treat it as a claim to check, not a decision-ready insight.
Why the Constraint Matters
The BI-Bench study reports that frontier large language models achieved less than 50% accuracy on real-world, end-to-end business-intelligence tasks. Those tasks include choosing tables, joining data, transforming fields, calculating metrics, and producing answers. Fluent writing cannot make an incorrect join reliable. A safer approach is to constrain the agent to validated operations and judge its execution, not its demo fluency. That's a useful lens when you evaluate AI agents before investing.
For example, overnight sales fall in one category. The agent checks data freshness, joins sales to stock levels and the promotion calendar, calculates sell-through using your agreed definition, and compares the result with the forecast. It may find that an out-of-stock situation explains the drop better than weak demand, then show the stock data behind that finding. A manager can review the evidence before acting.
Test each part separately. Use representative questions with known dashboard answers, then score data preparation, calculation, and explanation on their own. A polished paragraph built on the wrong join should fail, even if it reads beautifully.
Where the Business Value Shows Up
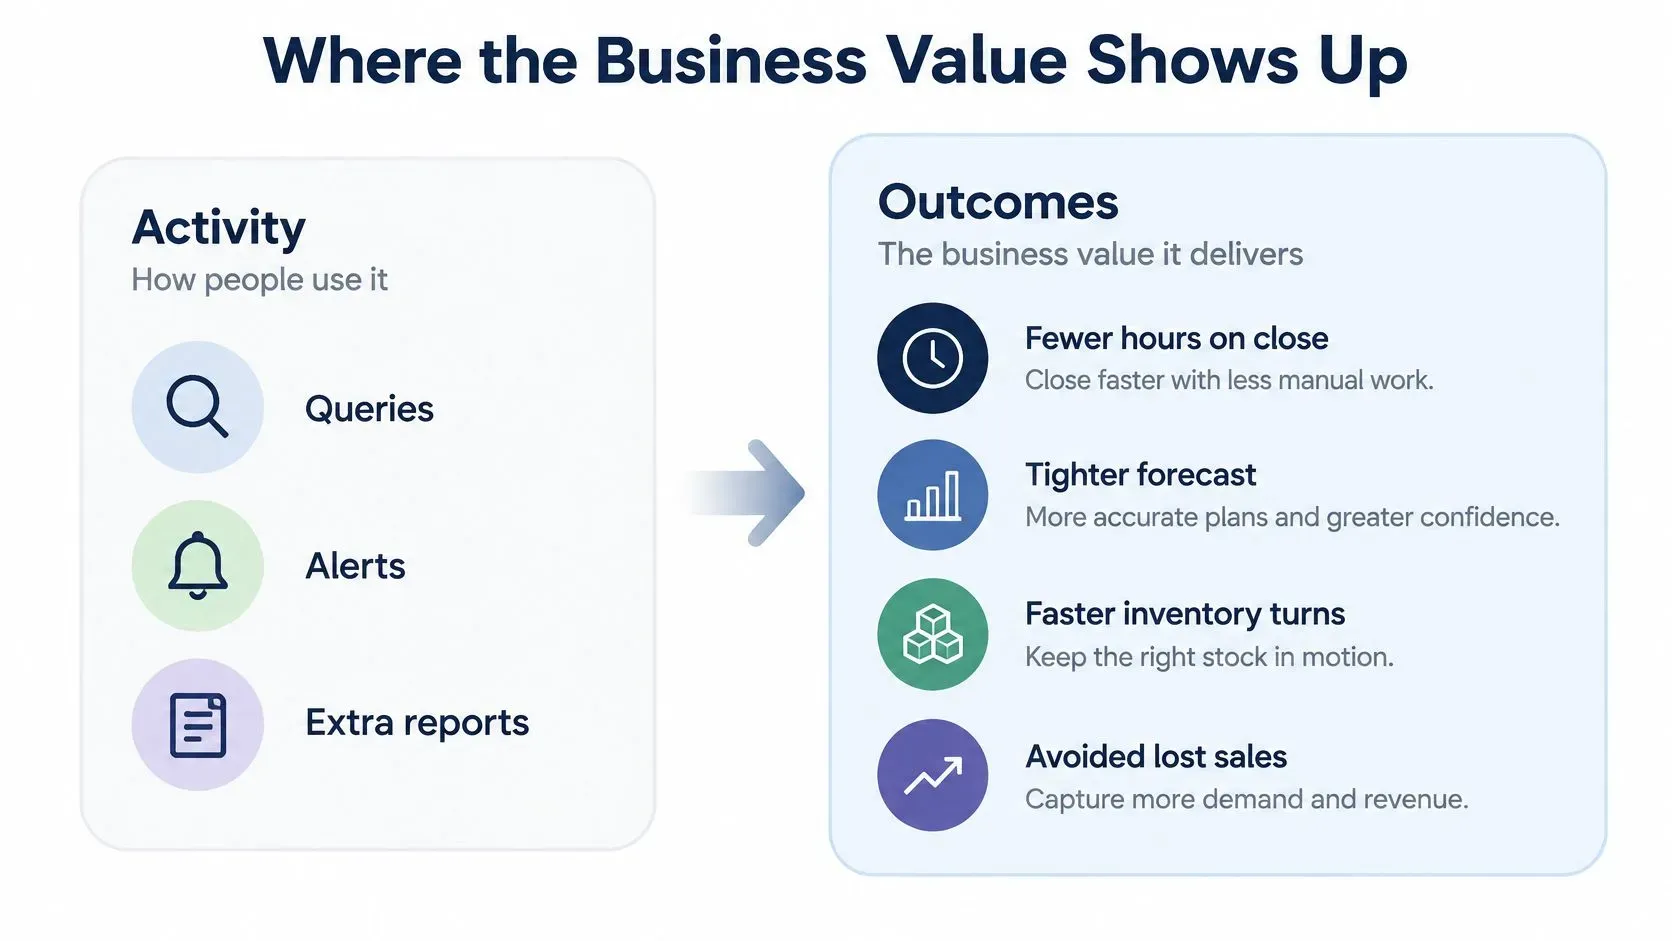
A finance team spends the first days of each month assembling reports from spreadsheets, then has little time left to investigate what changed. Agentic BI creates value when it reduces that assembly work and gives people more time to act on the results. Queries, alerts, and extra reports measure activity. Hours saved, a closer forecast, or a faster response to an inventory problem measure business outcomes.
Enterprise AI adoption surveys suggest that experimentation is running well ahead of scaled deployment, while profit impact remains narrow for many firms. For an SME, that is a reason to start with a specific, costly delay rather than treat an agent as a replacement for the team.
Three Jobs Where Value Is Easiest to See
Recurring reporting reduces the time spent assembling monthly and board packs. Your analyst can spend less time rebuilding familiar tables and more time checking exceptions and explaining changes.
Forecasting for cash, payroll, and demand helps you connect a changing number to a decision. If a forecast shifts, the useful outcome is knowing soon enough to review the plan, not only seeing the change in a new chart.
Anomaly monitoring checks sales, inventory, or transactions between scheduled reviews. The value depends on whether someone can investigate and respond sooner than they would under a routine review schedule.
Value job | Outcome to track each quarter |
|---|---|
Recurring reporting | Hours spent on the monthly close |
Forecasting for cash, payroll, and demand | Forecast error compared with the previous quarter |
Anomaly monitoring | Time from signal to decision |
Choose the job that addresses your most expensive delay. Set a baseline, track the outcome in the table, and judge the pilot by whether that measure improves, not by how many alerts or reports the agent produces.
Controls That Keep Autonomy Supervised
A sales alert can run on its own. A pricing change should not. Set permissions according to the cost of a wrong decision, then make every automated step traceable.
Only 21% of surveyed organizations reported a mature governance model for agentic AI, according to Deloitte's analysis of agentic AI adoption. The same analysis found that roughly 80% lacked mature capabilities such as decision boundaries, real-time monitoring, and complete action histories. Nearly two-thirds of respondents needed more human oversight than they had expected, citing poorly structured data and limited trust.
Action | Autonomy | Required control | Example |
|---|---|---|---|
Routine monitoring | Continuous | Freshness check and an execution log | Daily sales or inventory anomaly |
Recurring report | Scheduled | Versioned metrics and a named reviewer | Monthly close or board pack |
Forecast used in a plan | Assisted | A person accepts the number | Cash, payroll, or demand forecast |
High-impact commitment | Approval gate | Evidence, override, and post-decision review | Price change, credit, AML escalation, or a large buy |
Use the table as a permission system. Let routine monitoring run continuously when the system records data freshness and execution history. Give scheduled reports a named reviewer and stable metric definitions. Keep forecasts in an assisted workflow until a person accepts them; require an approval gate for consequential choices such as pricing, credit, large inventory buys, or AML escalation. For a practical guide to how to integrate human supervision and AI, match review to the consequence of an error.
What Every Insight Should Carry
Every insight needs a source, refresh time, and record of any human override. Where available, include the model or prompt version, data transformations, and a confidence indicator. If a threshold breach suggests that data or logic has degraded, pause the automation and investigate before it continues recommending action.
For European readers, the European Commission's EU AI Act implementation timeline sets out dated obligations: requirements for general-purpose AI models from 2 August 2025, transparency requirements under Article 50 and related enforcement from 2 August 2026, obligations for certain high-risk systems covered by Annex III from 2 December 2027, and obligations for high-risk AI embedded in regulated products under Annex I from 2 August 2028. The high-risk requirements include risk management, suitable data quality, activity logging, technical documentation, information for deployers, human oversight, accuracy, cybersecurity, and resilience.
The NIST Artificial Intelligence Risk Management Framework offers a plain-language checklist: validity and reliability; safety; security and resilience; accountability and transparency; explainability and interpretability; privacy; and fairness, including the management of harmful bias.
Keep personal data out of an agent's inputs unless the workflow needs it. Regulated teams should confirm their specific obligations with counsel.
How to Prove an Agent Pays Off
The hard question isn't whether an agent can find a pattern. It's whether you can attribute better margin, forecast accuracy, inventory turns, or analyst productivity to that agent. Most firms can't do that yet, which is exactly why your pilot needs a measurement design before it needs more features.
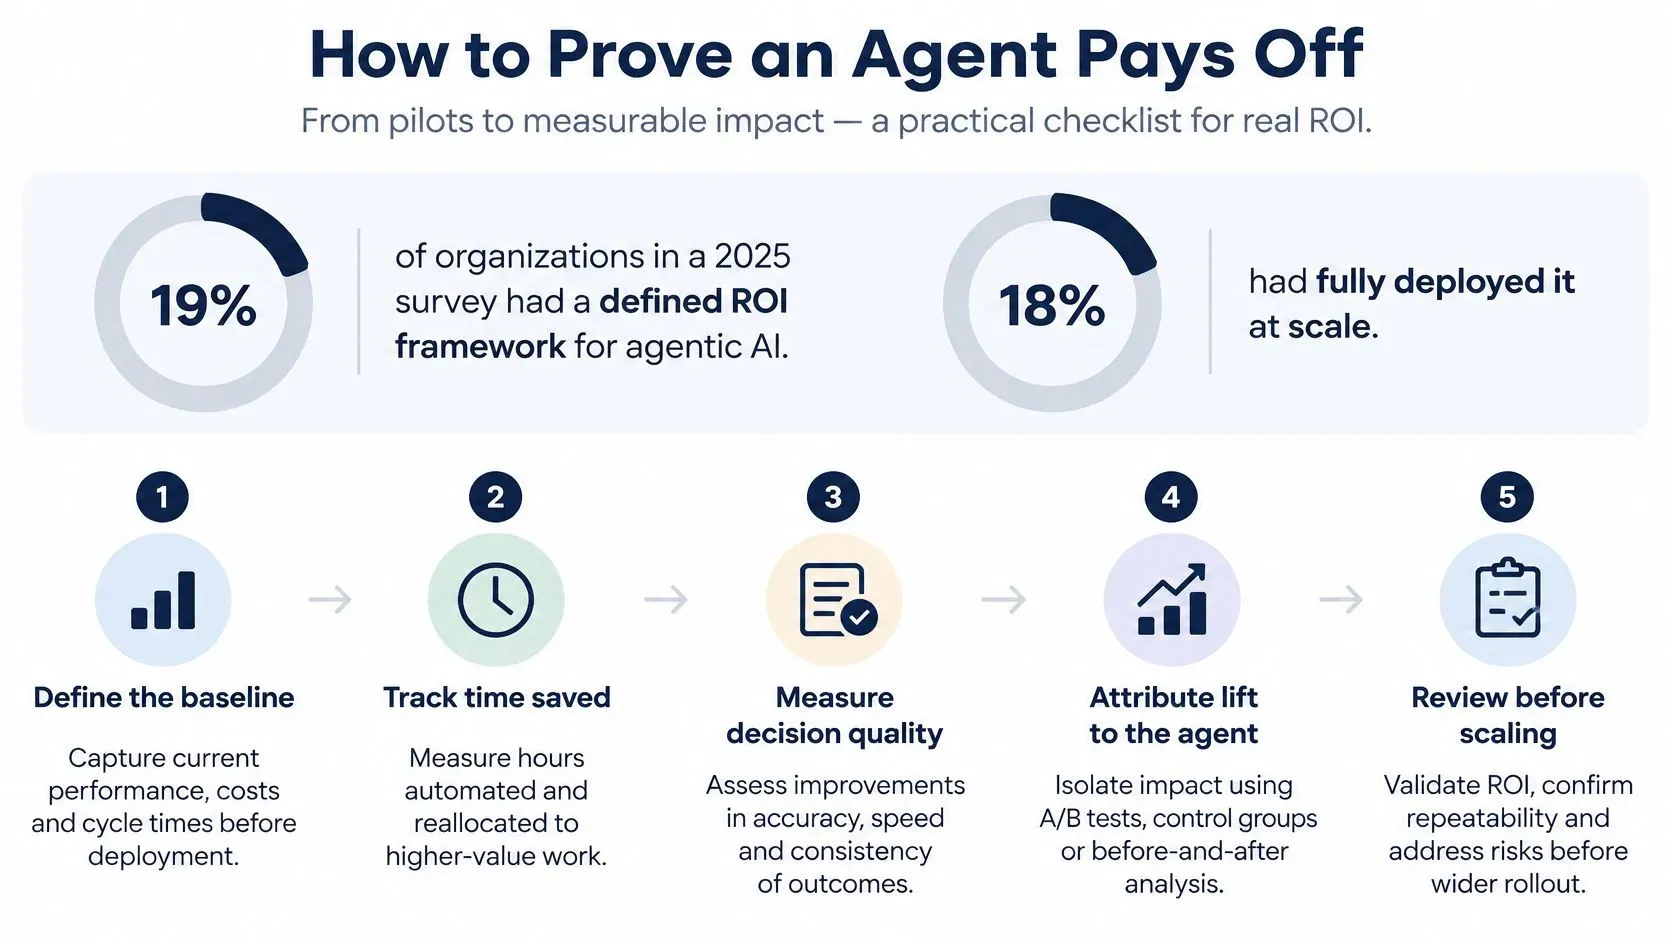
Only 19% of organizations in a 2025 survey had a defined ROI framework for agentic AI, while just 18% had fully deployed it at scale, according to the Qlik 2025 agentic AI study. You can run a cleaner test than that without a data science team. If you want the supporting maths in one place, start with Calculating the ROI of AI in SMEs.
A 30-60-90 Pilot You Can Actually Run
- Pick one workflow. Choose reporting, forecasting, or anomaly watching, not all three.
- Record a four-week baseline. Capture the outcome metric for that job, plus analyst hours spent today.
- Run beside the old process for 30 days. Keep your existing controls in place while the agent works in parallel.
- Compare at 60 days. Log every false alarm and what it cost in time, money, or a wrong promotion decision.
- Decide at 90 days. Keep, narrow, or stop the workflow based on outcomes, not enthusiasm.
Measure cost per useful insight by dividing total cost by the insights somebody acted on. Fifty alerts that nobody used aren't cheaper than five that changed a decision. Track how often a person correctly overrides the agent too, because overrides reveal where your data, thresholds, or metric definitions need work.
Use a held-out comparison as your counterfactual. Run the agent in one store, product line, or set of weeks and keep it off in a comparable one. Same period last year is a weaker comparison because pricing, demand, and staffing have all moved.
No return is guaranteed. End the review with a three-line scorecard you can fit on one page.
- Baseline. The outcome and analyst hours before the agent.
- Result. The outcome, false-positive cost, and override rate after 90 days.
- Decision. Keep, narrow, or stop, with a named owner.
Agentic BI in Retail Finance and Operations
The same loop shows up in different rooms. What changes is the decision at the end, the person who approves it, and the evidence they need before they say yes.

Retail and E-commerce During a Promotion
Say you're running a promotion and one product line suddenly drops. The agent watches sell-through and on-hand stock, separates a demand spike from an out-of-stock, and drafts a reorder or markdown suggestion. Your category manager sees the sales table, stock position, and promotion dates, then approves or rejects the suggestion before any purchase order is raised.
Finance Preparing the Month
In finance, the agent refreshes cash, payroll, and revenue drift, compares the live number with the forecast, and prepares the monthly pack for review. Your finance lead checks the variance explanation and the formulas behind it before accepting the forecast into the plan. A credit or AML-style escalation stays behind an approval gate, and detection support isn't regulatory advice.
Operations and Product Teams After a Release
An operations or product team can monitor a few agreed KPIs and flag a metric that moved after a release. The agent shortens the time between the signal and your iteration review by attaching the before and after numbers, the release date, and any obvious data gap. The team lead still decides whether the movement is real, important, and worth a fix.
Agree the metric definition before the agent writes the narrative, or two teams will argue about a fluent sentence built on two different formulas.
That cross-check matters most if you're migrating from spreadsheets. The pattern is identical in every industry. Continuous watch, explained change, narrow action rights, and a named human who can still say no.
Choose the First Workflow to Automate
A useful first workflow has a clear owner, a recurring task, and an outcome you can measure. Choose recurring reporting if assembling packs consumes hours. Choose forecasting if cash or demand surprises arrive too late. Choose anomaly monitoring if issues surface only when someone checks the numbers. Keep pricing, credit, and compliance decisions under human control until you have reliable data lineage and approval steps.
Settle the data-location question early, too. Choosing between hosted and self-hosted ERP can help you weigh where connected data should live and who maintains it, choices that affect freshness checks and access controls.
Key Takeaways
- Select one workflow from reporting, forecasting, or anomaly monitoring.
- Record a four-week baseline for the outcome and analyst hours.
- Show the formulas beside each narrative insight.
- Name an approver for assisted and high-impact decisions.
- Review results after 90 days and stop if the workflow has not paid off.
ELECTE is an AI-powered data analytics platform for growing companies. Its AI Agent reads data, writes reports, and researches the market on schedule or on demand, 24/7. The Business plan costs €40 per month and adds automated reports and competitor analysis, AI-powered forecasting, unlimited data history, advanced integrations, and cash flow predictions. For planning, Fabio Lauria's free whitepaper, "AI for European SMEs: The 2026 Playbook," covers decision frameworks, ROI calculations, and implementation playbooks. Keep regulated decisions under human review.
Start by replacing one recurring export with a supervised workflow: the agent prepares an explanation, and a named person approves the next decision. Measure the result over 90 days, then compare ELECTE's Starter, Business, and Enterprise plans to find a fit for your team.
Comments
No comments yet — start the conversation.