Complete Guide to Business Intelligence for Startups
Learn business intelligence for startups: readiness checks, KPIs by function, lean stacks, and a 90-day plan that links every insight to a decision.


More than 80% of respondents said their organizations hadn't observed a tangible enterprise-level EBIT impact from AI, even though 71% reported regular generative AI use in a business function, according to McKinsey's 2025 global survey. That's a useful starting point for a startup: adopting technology and improving operating profit aren't the same achievement.
You might already have customer records, payment exports, campaign reports, and inventory files. The harder question is whether anyone can use them to decide what to reorder, which customers need attention, or how much cash the business can safely spend.
Business intelligence for startups connects those records to decisions. It doesn't have to begin with advanced forecasts or a dedicated analyst. A dependable spreadsheet can be more useful than an impressive dashboard built on inconsistent definitions.
Start by checking which decisions your data can support. Then choose meaningful metrics, an affordable architecture, and a review routine that records what changed. Forecasting and automation become useful when you can check their inputs, understand their limitations, and assign someone to act.
Why Startups Drown in Data and Still Guess
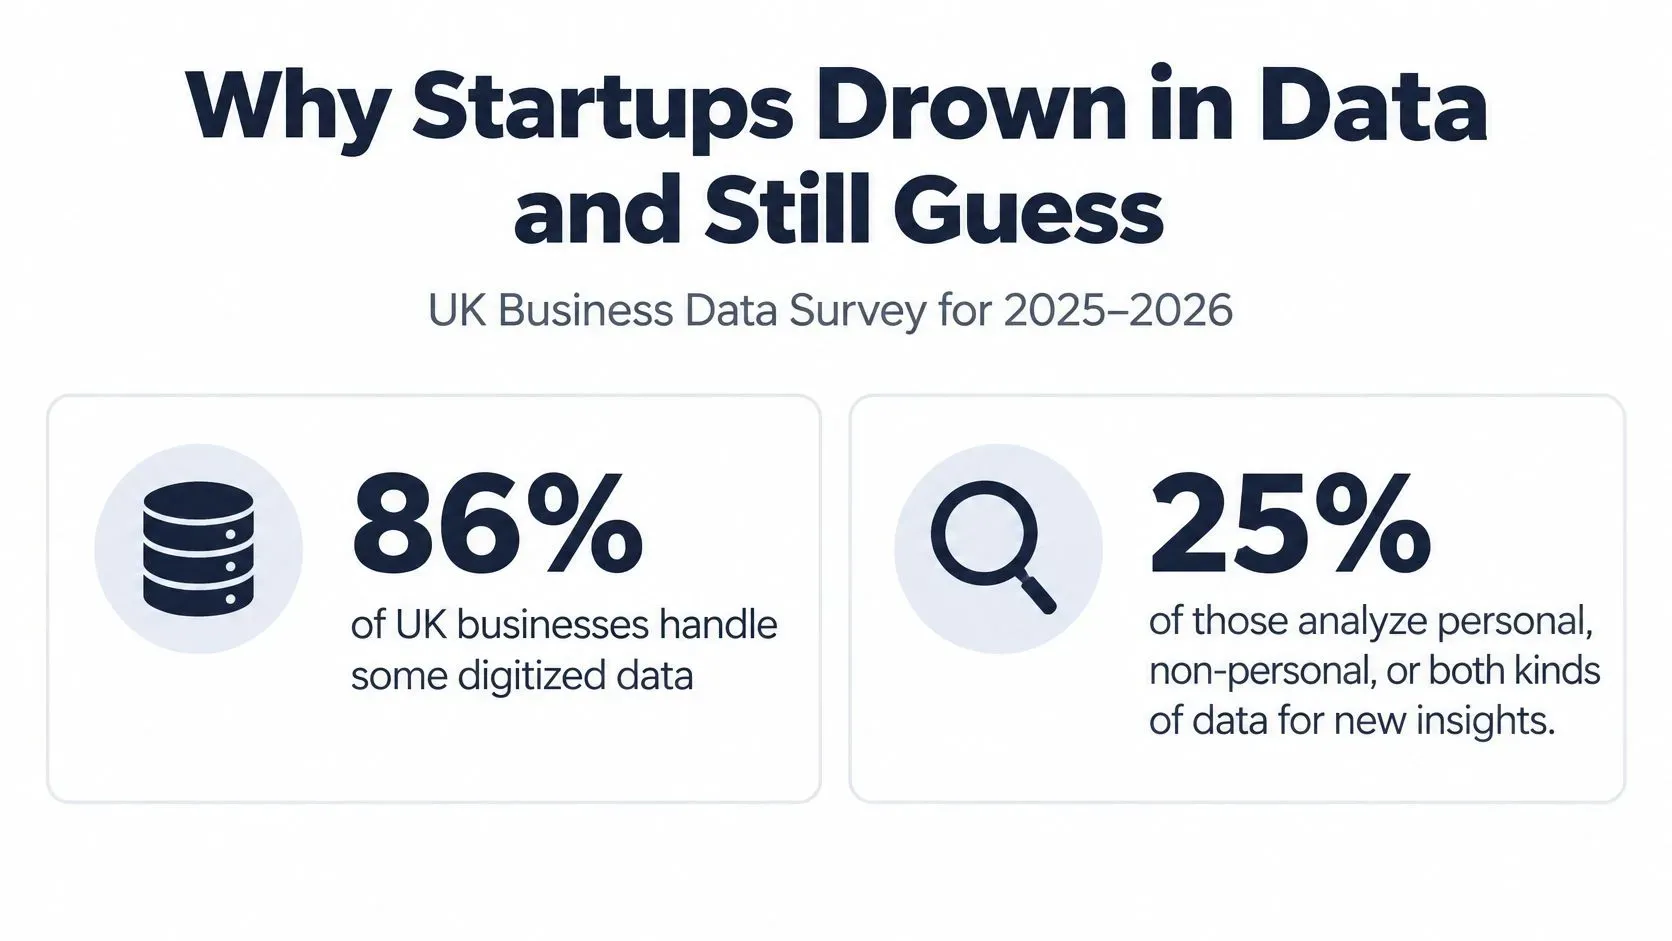
In the UK Business Data Survey for 2025–2026, 86% of UK businesses handled some digitized data, but only 25% of those analyzed personal, non-personal, or both kinds of data to generate new insights. Analysis rates were 35% among small businesses and 26% among micro businesses. Data improved internal processes always or most of the time for only 11% of small businesses, compared with 29% of large businesses.
The gap feels familiar. Your founder opens Stripe, your operations manager downloads a bank file, and your salesperson shares a CRM screenshot. Monday's pricing discussion still ends with competing interpretations because each person uses a different definition of revenue.
A decision loop, not a department
Business intelligence means organizing business records so people can understand performance and act on it. Think of a cockpit with working gauges, rather than a hangar full of spare parts.
A useful loop has clear stages:
- Trust the records. Confirm that orders, refunds, invoices, and payments haven't been confused or counted twice.
- Measure a decision. Show the metric that determines whether someone changes pricing, purchasing, staffing, or customer outreach.
- Assign the action. Name the person who can respond.
- Check the outcome. Record whether cash, conversion, stock availability, or margin changed.
AI adoption isn't a substitute for this loop. Headlines can describe anything from occasional writing assistance to integrated operational systems, so different survey definitions produce different adoption figures. None establishes your own payback.
Score your readiness before comparing vendors. Your working system needs decision-specific data checks, functional KPIs, a manageable stack, a rollout routine, and a way to test churn or inventory outcomes. Those are operating responsibilities, not features you can buy and forget.
The Minimum Data Foundation Before You Adopt BI
Readiness is a gate for each decision, not a verdict on your company. You can be ready to monitor cash while remaining unready to forecast seasonal demand.
A review of SME AI adoption and barriers reports OECD figures showing that 39% of SMEs used AI applications in 2025, up from 26% in 2024, while 67% of non-users remained unsure how to use generative AI or understand its risks. It also describes obstacles involving integration, industry-specific data, funding, and analytical expertise.
Test the decision before the platform
Use the following as planning heuristics, not statistical guarantees. The right history must cover the behavior you're trying to understand, and it must contain consistent records.
BI readiness by decision type
Decision | Minimum history | Fields to standardize first | Spreadsheet enough? |
|---|---|---|---|
Cash position and runway | Start with reconciled balances and complete bank and invoice lines; an illustrative starting window is 4–8 weeks | Date, amount, category, entity, currency | Yes until multiple entities |
Stockout or low-cover alerts | Planning starting point of 8–12 weeks of sales and on-hand stock | SKU, location, quantity, timestamp | Yes for one warehouse |
Lead-to-close conversion | A complete sales cycle; an illustrative review window is 30–90 days | Source, stage, owner, created and close dates | Yes under a few hundred leads a month |
Promotion or price lift | Planning starting point of 2–3 comparable campaigns | SKU, price, discount, channel, units | Only if campaigns are logged the same way |
Demand forecast | Planning starting point of 12–24 months or a full season | SKU-day sales, promo flag, stockout flag | No |
Cohort retention | Planning starting point of 6+ months of stable customer IDs | Customer ID, signup, activity, revenue | No for statistical cohorts |
Cash monitoring begins with what you hold and owe; runway also needs a credible burn estimate. Stock alerts require current stock records because sales history alone can't tell you what's available. Conversion analysis needs consistent stage names and enough time for leads to reach an outcome.
Promotion comparisons need similar conditions. A campaign during a holiday isn't a clean comparison with an ordinary trading period. Likewise, a short demand history can't establish annual seasonality, and an immature customer group can't reveal long-term retention.
Standardize before you aggregate
Give each customer or order a stable ID. Use a consistent timezone, currency treatment, SKU format, and written definitions of active and churned. To clarify how these records relate, explore conceptual modelling for teams.
Keep spreadsheets while a named owner can reconcile them to the source each week without fragile manual joins. Set a documented quality threshold appropriate to the decision. For example, a hypothetical 5% failed-row threshold could trigger a warning and human review, but high-impact decisions may require stricter checks.
Practical rule: Mark a decision green when its inputs reconcile, amber when someone must qualify the output, and red when missing or inconsistent records could reverse the decision.
Collect only necessary personal information, restrict access, and document retention and processing arrangements before connecting customer records to a platform.
Startup KPIs by Function That Change a Decision
Choose the decision first, then the measurement. Your sales lead needs to know which channel deserves budget, not whether a chart is rising.
Keep a primary metric per function until someone acts on it regularly. Supporting measures should explain the primary metric rather than create competing priorities.
Startup KPIs by function
Function | Primary KPI | Plain definition | Decision it changes | Cadence |
|---|---|---|---|---|
Revenue | Net revenue retention or MRR growth | NRR = (starting MRR + expansion − contraction − churn) / starting MRR | Pricing, packaging, hiring | Weekly |
Retention | Logo churn and early cohort retention | Customers lost / customers at start; share still active at month 1 and month 3 | Onboarding and success fixes | Monthly |
Sales | Lead-to-close rate and CAC payback | Closed-won / leads; CAC / monthly gross profit per customer | Which channel keeps budget | Weekly |
Operations | Stockout rate and weeks of cover | Stocked-out SKUs / active SKUs; on-hand / trailing weekly demand | Reorder and safety stock | Daily or weekly |
Finance | Cash runway and forecast error | Cash / monthly net burn; absolute percent error against actual | Spend freeze or raise timing | Weekly |
Marketing | Contribution after ads | (Revenue − COGS − ad spend) / revenue | Pause or scale a campaign | Weekly |
Read the formula without losing the decision
MRR means monthly recurring revenue. The revenue formula shown calculates net revenue retention for existing customers, not total MRR growth: new customers belong in a separate MRR bridge. That distinction helps you separate acquisition performance from expansion and customer losses.
Logo churn counts lost customer accounts. Pair it with retention among customers who joined during the same period, called a cohort, so an onboarding problem doesn't disappear inside an aggregate active-user count.
CAC, or customer acquisition cost, should include the acquisition expenses you've agreed to count. Its payback calculation uses gross profit, not revenue, because revenue isn't all available to recover acquisition spending.
A metric that never changes a meeting is a decoration.
Evaluate consequences alongside accuracy
For inventory, a statistically better forecast isn't automatically a better purchasing decision. An inventory-control study using M5 forecasting competition data found that the relationship between forecast accuracy and inventory costs changes with holding costs, lost-sales costs, lead times, and demand patterns.
Review excess stock and missed sales alongside forecast error. For finance, absolute percentage error means absolute forecast error divided by the actual amount; averaging those values gives MAPE. Avoid that measure when actuals are zero or close to zero, and inspect absolute currency error instead.
Two business-model distinctions matter:
- Marketplaces: Separate gross merchandise value from take-rate and recognized revenue.
- Hardware startups: Keep booked revenue separate from collected cash and inventory commitments.
The contribution formula in the table is a margin after product costs and advertising, not necessarily fully loaded profit. Add other variable costs when they affect campaign economics.
Use how to select meaningful metrics to refine your definitions. Circle the rows you'll review this month and leave the rest out of the operating dashboard.
Data Stack Options an Early Team Can Run
Your data stack is the arrangement used to collect, store, prepare, and display records. A warehouse is a central analytical store; transformations are the steps that clean and reshape its contents.
Choose an arrangement your team can maintain when someone is on leave or an export changes format. The simplest sustainable option is usually more useful than the most flexible unfinished one.
Early-stage BI stack options
Option | Best when | Skills needed | Breaks when |
|---|---|---|---|
Spreadsheet and scheduled export | One source, pre-seed, weekly questions | Founder comfort with sheets | Three or more sources or version fights |
Lightweight BI on a database | Someone writes SQL and history is clean | Basic SQL | No owner for metrics or access |
All-in-one SME analytics | Forecasts and reports without a data hire | An operator, not an engineer | You need a custom enterprise model |
Warehouse, transforms and BI | Multiple products and a named data owner | Analyst or engineer time | A tiny team with no maintenance hours |
Match complexity to maintenance capacity
Spreadsheet and scheduled export: This works when someone can trace every displayed total back to a source. Its breaking point is usually ownership and reconciliation, not the appearance of the charts.
Lightweight BI: A Metabase-style reporting layer suits a team that can write SQL, the language used to query databases. Test a representative question in an afternoon rather than building a broad prototype. Check permissions and metric definitions before offering self-service access.
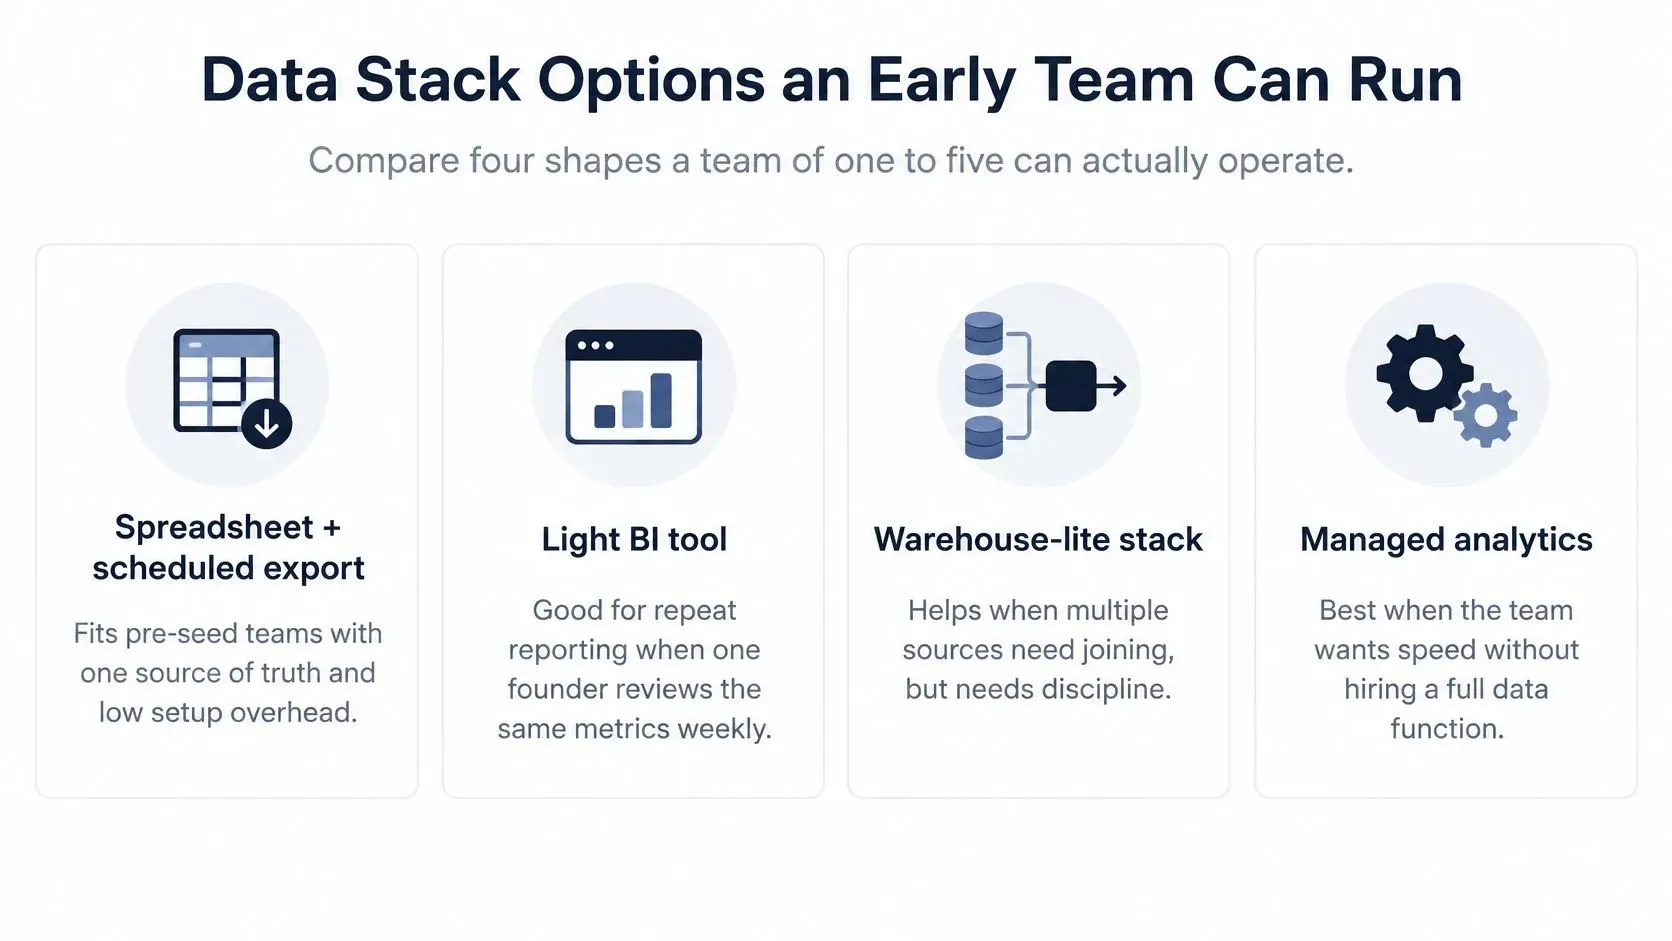
All-in-one SME analytics: This reduces the need to assemble separate components. Use a short connection test during evaluation: upload a representative file or connect a supported source, then check whether you can inspect totals, understand the output, and export it. Connection speed alone doesn't establish analytical readiness.
Warehouse, transformations, and BI: This gives an analyst or engineer more control over joins, history, and custom definitions. It also creates responsibility for pipeline failures, schema changes, permissions, and recurring costs. Budget for maintenance time as well as subscriptions.
Connect sources in a useful order
Start with accounting or payments and CRM. Add inventory for purchasing decisions or product events for customer behavior. Bring advertising records into the system once you've defined contribution margin, so campaign reporting doesn't confuse revenue with economic value.
For architectural context, the guide to data architecture costs for SMEs compares data storage approaches. Match your green readiness decisions to an architecture you can operate, rather than buying infrastructure to compensate for red inputs.
A 90-Day Roadmap from Quick Wins to Governance
Treat this as a proposed operating schedule, not a promise that every startup will reach automation on the same timetable. Each phase has an owner and a reason to stop.
Days 1–14 establish a useful page
- Pick the green decisions that matter most to the founder.
- Write short definitions for revenue, active customer, and churn.
- Connect or export a finance source and a commercial source.
- Publish a weekly page showing runway, pipeline or revenue, and an operational alert.
- Assign a reviewer and reserve a short recurring meeting.
Owner: A founder or operations lead. Stop rule: Don't publish a metric as authoritative if it can't reconcile to the underlying records.
The page should answer a practical question, such as whether collections need attention before the next supplier payment. Avoid adding charts merely because a connector makes them available.
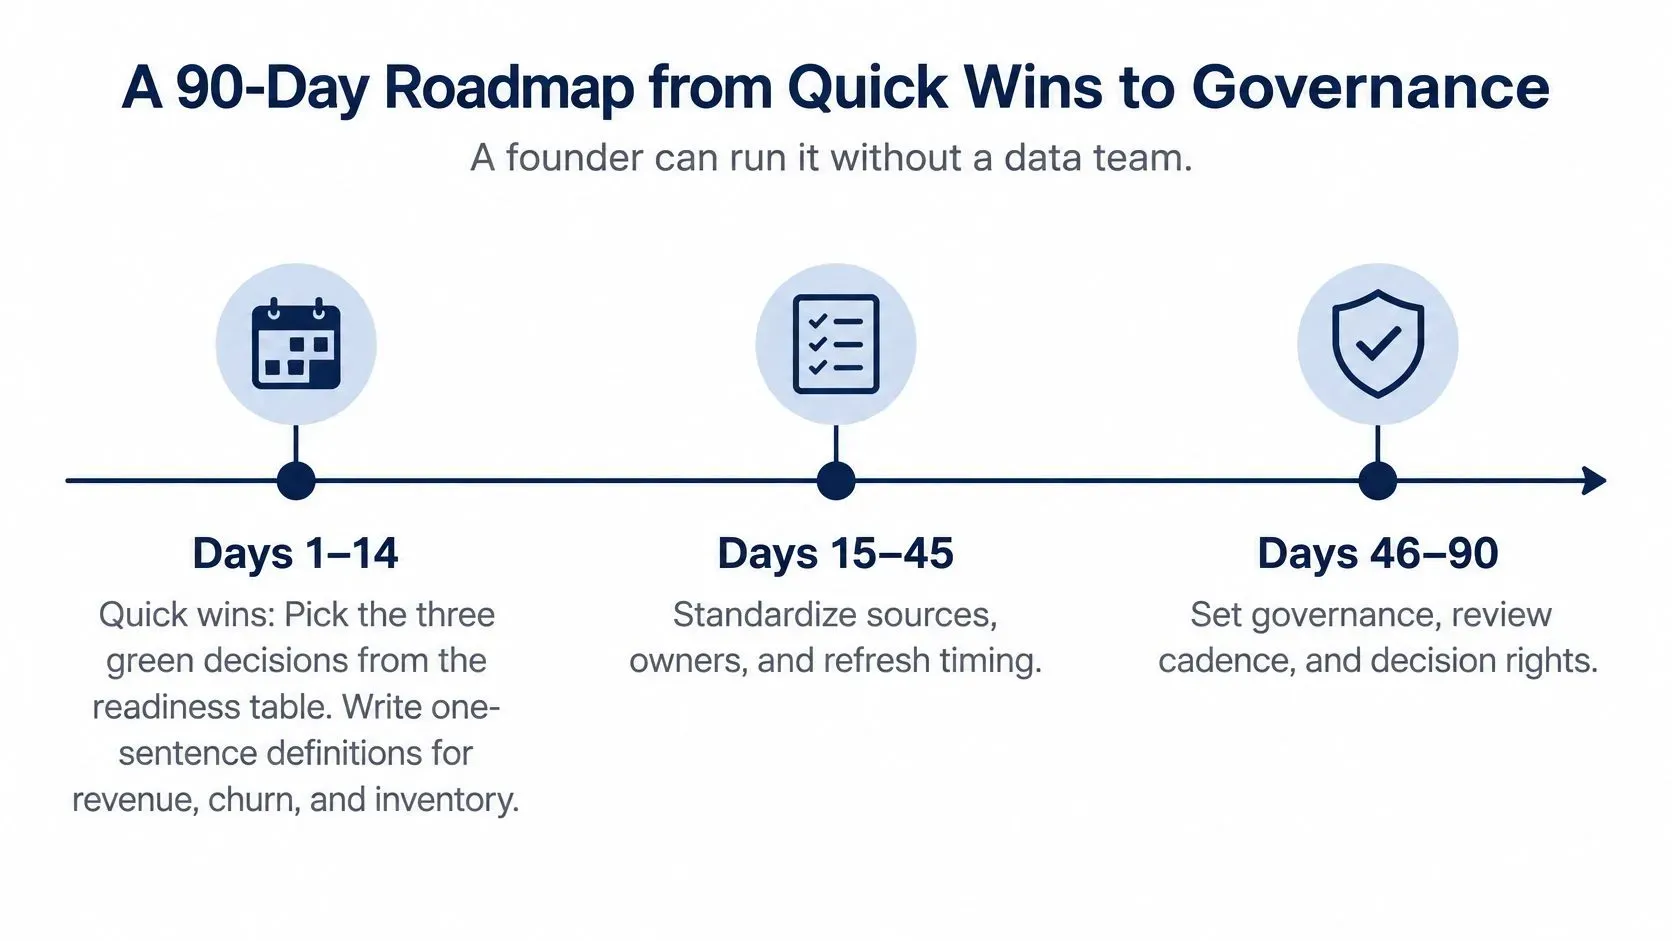
Days 15–45 make review repeatable
- Add the matching functional KPI and a target or action threshold.
- Reconcile totals on a fixed weekly schedule and log discrepancies.
- Record each insight with its date, source, and action taken.
- Remove charts that aren't used in decisions.
Owner: The functional lead who can authorize the action. Stop rule: Don't add further automation while recurring reconciliation failures remain unresolved.
Plain-language summaries can help colleagues understand a change without interpreting every chart. MyMentions' guide to AI tools for narrative data summaries offers a useful starting point for evaluating that reporting format. Require summaries to retain the reporting period, metric definition, and relevant limitations.
Days 46–90 add lightweight governance
The NIST AI Risk Management Framework organizes ongoing risk management around Govern, Map, Measure, and Manage, including observability and traceability for detecting performance changes.
- Govern: Name who may approve changes to definitions and automated actions.
- Map: Connect each forecast to its intended decision, likely failure modes, and acceptable error.
- Measure: Monitor freshness, missing values, and forecast error by meaningful segment.
- Manage: Assign a response to each breach, such as pausing automatic replenishment.
Owner: A named data steward, even if that's the founder. Stop rule: Suspend the affected automated action when its agreed quality or error threshold is breached.
Store the source snapshot, model version, timestamp, confidence or severity, and eventual outcome with each automated insight. Promotions, a new product mix, or a changed accounting code can make historical relationships unreliable without making the dashboard look broken.
Your completion test is operational: a recurring decision takes less time, reporting work has declined, and someone can explain how a wrong recommendation would be detected. Margin improvement may need a longer observation period.
Churn and Inventory Cases That Prove Payback
Productivity isn't the same as financial return. In the Federal Reserve Bank of Philadelphia's Third District analysis, 71% of AI-using firms reported productivity increases, but more than 70% reported no change in labor costs, external spending, production quality, or sales.
Churn prevention as a testable intervention
Consider a hypothetical B2B SaaS startup with 40 customers. Its founder reviews last login, support tickets, and invoice delays, then calls accounts that have been quiet for 14 days.
Suppose baseline monthly logo churn is 6%, and the team believes outreach retained two accounts paying €400 MRR each. That's €800 in monthly recurring revenue associated with the intervention, against an illustrative two hours of review, not €800 in proven incremental profit.
Record the evidence behind each retention judgment. Compare similar accounts where feasible, and include outreach time, discounts, and service costs before estimating net value.

Inventory decisions across channels
Say a retailer combines online and store demand, checks shared availability, and asks a buyer to approve transfers before placing new orders. Measure whether that action reduces missed sales without creating excess stock elsewhere.
For intermittent products, evaluate the reorder policy against the cost of holding stock and losing a sale, not forecast rankings alone.
Avoid these traps:
- Premature infrastructure: Buying a warehouse before agreeing definitions.
- Accuracy-only selection: Ignoring the purchasing consequences of model errors.
- False profit attribution: Counting every saved hour as cash savings.
- Unsafe automation: Acting automatically on red-readiness inputs.
These are educational illustrations, not guaranteed returns. Apply a money test to each use case: decision, owner, implementation cost, measured change, and review date.
Choose a Vendor and Run Your First Forecast
A vendor demonstration should use your decision criteria, not just the provider's preferred dashboard. Mark each requirement yes or no before committing to a trial.
Must-have | What to verify |
|---|---|
Source access | A working connection to your finance or commerce system, or file upload |
Selected KPIs | The metrics you intend to review |
Suitable history | Enough retained history for the chosen decision |
Explainable forecast | A plain-language description of the method and limitations |
Portability | Exportable results and visible source totals |
Trial support | An identifiable support route and responsible contact |
For a wider shortlist, compare the BI software picks from Scrappey against these requirements. Leave board packs and multi-model comparisons until your weekly review habit exists, and reject guaranteed-ROI claims.
Fit the platform to the job
ELECTE, an AI-powered data analytics platform for SMEs, fits teams seeking financial forecasting and automated reporting rather than a self-built warehouse. Our Starter plan costs €32 per month and includes basic financial analytics, revenue trend tracking, monthly forecasts, email support, 90-day data history, and CSV export; Starter and Business offer a 7-day free trial.
Most of our users are operational in under five minutes, with analysis and first forecasts generated immediately after connecting accounting software or uploading a file. That speed doesn't remove the need to validate inputs or confirm that the available history suits your use case.
For your first test, connect a reconciled source and generate a revenue forecast, or a cash forecast where the selected plan supports it. Write down the decision it should inform and compare the result with your current planning method. Forecasts are educational decision support, not financial advice.
Dashboard Templates and Key Takeaways
Build a small set of views with distinct purposes. Don't make every colleague use the same collection of charts.
View | Include | Purpose |
|---|---|---|
Weekly operating page | Cash runway, pipeline or revenue trend, operational alert, reviewer | Authorize near-term action |
Monthly review | Early cohort retention, net revenue retention bridge, forecast error against actual | Examine whether assumptions still hold |
Alert log | Date, source snapshot, metric, threshold, action, outcome, approver | Investigate and learn from decisions |
Before sharing financial dashboards widely, review access rights, sensitive fields, and approval responsibilities. Bookkeeping and Accounting of Florida Inc.’s business dashboard compliance essentials provides additional considerations for financial reporting. Dashboard controls don't replace professional accounting, legal, or compliance advice.
Key Takeaways
- Score readiness first. Mark each decision green, amber, or red before buying a platform.
- Begin with supportable decisions. Use clean operational records for cash, availability, and conversion before attempting mature forecasts.
- Tie metrics to authority. Give each primary KPI an owner who can change an action.
- Choose maintainable architecture. Match the stack to your team's skills and maintenance capacity.
- Measure changed decisions. Record the outcome, not merely whether someone opened the dashboard.
The best business intelligence for startups is understandable enough to question and useful enough to consult repeatedly. Keep the records traceable, the review focused, and the person responsible visible.
ELECTE offers AI-powered analytics, financial forecasting, and automated reports to help SMEs turn business records into practical decisions. Visit ELECTE to explore the platform and test a reconciled source against a real revenue or cash-planning question. Bring a defined decision and use the trial to assess whether the resulting insight improves your next review.
Comments
No comments yet — start the conversation.