What Is Data Analytics? A Practical Guide for SMEs
What is data analytics? Learn the process, four types, and business uses in plain English. Try ELECTE free for AI-powered insights.

Data analytics is the systematic use of technology and statistical methods to turn raw data into patterns, forecasts and evidence that improve decisions.
If your business already has sales reports, customer records and spreadsheets, why are important decisions still hard? Usually, the missing piece isn't another chart. It's knowing whether the information is trustworthy, what it tells you and who will act on it.
A retailer can track revenue perfectly yet keep running out of its best-selling products. A finance team can produce a polished cash report without spotting a payment problem early enough to respond. Recording an event and improving the next decision are different jobs.
Understanding what is data analytics means connecting those jobs. You don't need to become a programmer, but you do need to understand how questions, data quality, analytical methods and business actions fit together.
For SMEs, a useful starting point is a decision you already make, such as what to reorder or which invoices to review. From there, you can learn which methods help, where mistakes creep in and how to measure whether your team made a better decision.
What Data Analytics Means in Plain Terms
Data analytics combines techniques and software to examine information, identify patterns and support action. Eurostat's definition of data analytics connects that work to measurable organizational outcomes, including increasing production and reducing costs.
Think of raw data as the ingredients in a kitchen. Storing ingredients doesn't make dinner, and listing everything in the pantry doesn't tell you what to cook. Analytics is the preparation and cooking that turns those ingredients into something useful.
Storing, Reporting and Analyzing
A retailer's sales records show the distinction:
- Storing data: Save transactions containing products, prices, dates and quantities.
- Reporting data: Summarize sales by store or product category.
- Analyzing data: Investigate whether unavailable products explain lost sales, then recommend a change to replenishment.
A report can be part of analytics. The difference is whether someone uses the information to answer a question rather than display activity.

Where Analytics Fits
The field grew from statistical reasoning, expanded through computing and databases, and now includes machine learning. Those newer capabilities haven't replaced the need to interpret evidence carefully.
For learners and career switchers, the boundaries are useful but flexible. Business intelligence mostly organizes and reports business performance, while data science often involves building custom models, code and analytical systems. Data analytics overlaps both, translating governed information into decisions business users can act on, often without writing code.
SME owners, analysts, store managers, finance teams and executives all use this reasoning. For a finance-focused example, MyOfficeOps' resource on financial analysis explained for SMB owners helps connect financial information to operating decisions.
Analytics turns what your business records into evidence for what your business does next.
The Four Types of Data Analytics and the Questions They Answer
Suppose a store's sales dropped 12% in March. That's a hypothetical example, not a benchmark, and it immediately raises several different questions: what changed, what explains it, what happens next and what should the manager do?
Those questions correspond to descriptive, diagnostic, predictive and prescriptive analytics. Each asks more of the information and the people interpreting it.
The four types of data analytics at a glance
Type | Question it answers | Example (illustrative) | Typical output |
|---|---|---|---|
Descriptive | What happened? | Store sales dropped 12% in March | Dashboard or summary report |
Diagnostic | Why did it happen? | The drop traced to two stockouts in top-selling products | Drill-down analysis and driver breakdown |
Predictive | What may happen next? | April demand for winter lines likely 20% lower, with a range | Forecast with confidence range |
Prescriptive | What should we do? | Reorder 300 units now and pause one promotion | Recommended action with trade-offs |
All quantities in this table belong to the illustrative scenario. They aren't expected results for your business.
From Description to Explanation
Descriptive analytics establishes the facts. The manager might compare sales by product, store and trading day to locate the decline rather than treating it as a company-wide problem.
Diagnostic analytics investigates possible explanations. Stock records could reveal that popular products weren't available, but the analyst should also check returns, opening hours and transaction completeness before attributing the decline to stockouts.
This is a common point of confusion: a pattern isn't automatically a cause. Products running out alongside falling sales is evidence worth investigating, not permission to stop asking questions.
From Forecast to Recommendation
Predictive analytics estimates an uncertain future. A demand forecast should communicate a plausible range, not present a single number as a promise.
Prescriptive analytics compares actions under constraints. A reorder recommendation must consider available cash, supplier lead times, storage space and the cost of excess stock.
A forecast says what may happen. A prescription says which response best fits your objective and limitations. Even a reliable forecast can't decide whether protecting cash matters more than avoiding every possible stockout.
Most SMEs should establish dependable descriptive and diagnostic work before relying on predictions. Keep the comparison table as a reference when matching a real business question to the kind of answer you need.
How the Data Analytics Process Works Step by Step
Start with a business decision, not an export of every available spreadsheet. A focused question, such as which products need earlier replenishment, makes it easier to identify relevant information and reject distracting detail.
McKinsey's guide to building a data-driven strategy identifies three reinforcing capabilities: managing multiple data sources, building models that predict or optimize outcomes, and changing processes so those models influence decisions.
Build a Reliable Analytical Workflow
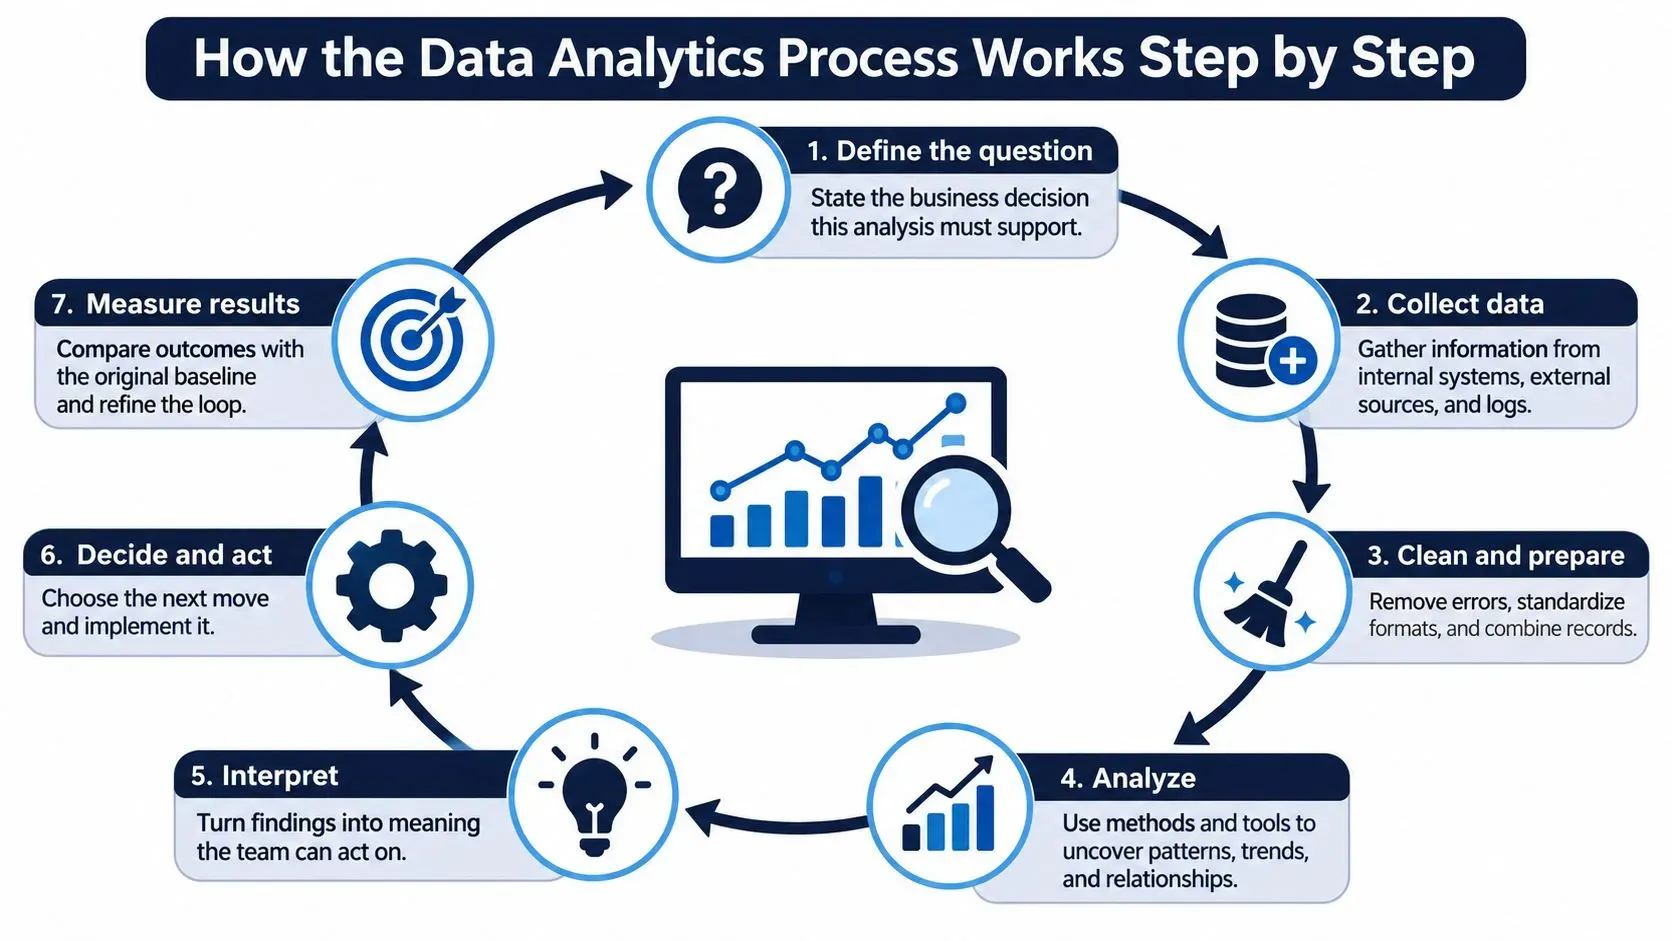
- Define the question and decision. Specify what someone will do differently after receiving the answer. A vague request to understand customers encourages interesting charts without a usable conclusion.
- Collect relevant data. Bring together sales, accounting, inventory and spreadsheet records where they help answer the question. The common mistake is selecting only the easiest source, then assuming it represents the whole operation.
- Clean errors, duplicates and gaps. Check identifiers, missing timestamps, impossible values and repeated transactions. Duplicate customer records can inflate customer counts before any advanced method enters the picture.
- Transform records into a consistent format and grain. Grain means what each row represents, such as a product at a location on a particular day. Combining daily inventory with individual sales transactions carelessly can repeat stock quantities and distort totals.
- Apply the appropriate method. Begin with summaries and comparisons, then add statistical or machine-learning methods when the question requires them. Keep dated versions of transformations so colleagues can reproduce the result rather than guessing which spreadsheet was final.
- Interpret and validate the result. Compare findings with the original question and test predictions on information the model hasn't seen. Watch for data leakage, such as including payment information that wouldn't have been available when a late-payment prediction was made.
- Communicate a conclusion and next action. Name the person responsible, explain uncertainty and specify how the result will be checked after implementation. A technically correct finding can stall if its recipient doesn't know what they're authorized to change.
Start Manually, Then Automate
For a small, tidy dataset, you can time-box an initial spreadsheet exercise to a few hours: write the question, select relevant records, inspect errors and align formats. That isn't a promise that messy systems can be reconciled quickly. It's a way to discover problems before automating them.
Interpretation and communication deserve as much care as calculation. Cyndra's step-by-step analysis and reporting guide is a useful companion when turning analytical work into a report colleagues can use.
At each stage, ask:
- Relevance: Does this input help answer the decision?
- Reliability: Could a preparation error reverse the conclusion?
- Availability: Would this information exist at the moment of action?
- Usability: Can the recipient explain the recommended next step?
How Good Your Data Must Be Before You Analyze It
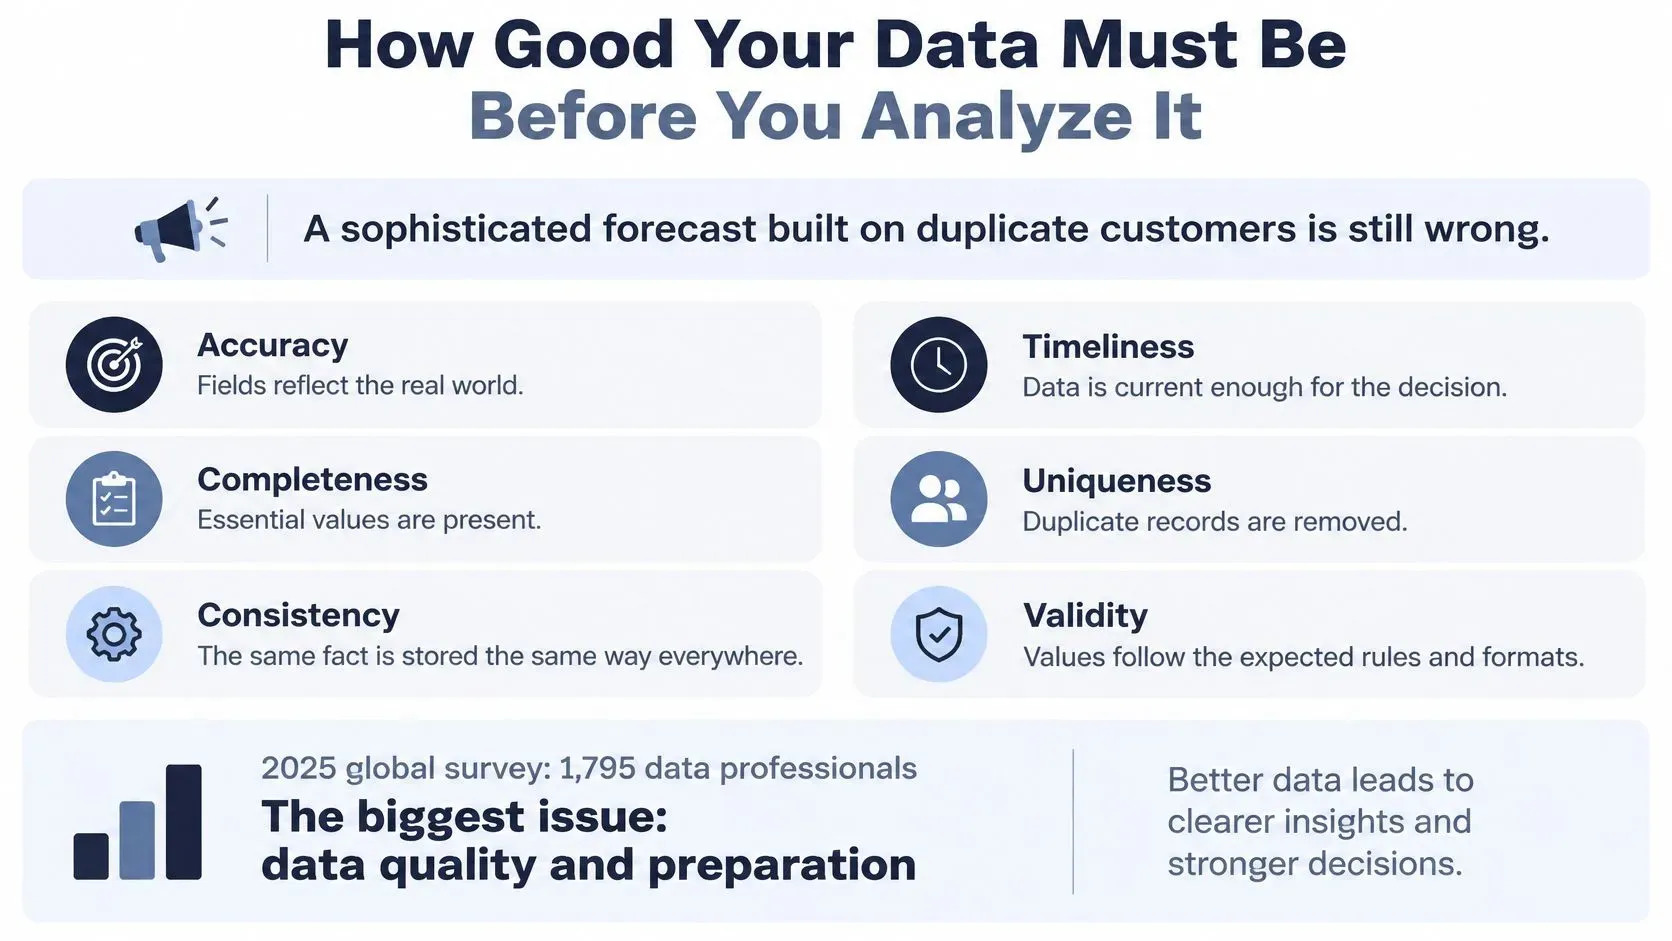
A weekly sales forecast can look precise and still rest on duplicate customers, missing returns and stock figures updated after the decision deadline. The smarter model does not rescue weak inputs; it only produces a more confident version of the same mistake. Readiness is the gate between calculation and action.
In a 2025 global survey of 1,795 data professionals, data security and privacy ranked first and data quality management second among analytics priorities, according to BARC's analytics trend announcement. Readiness also depends on people: teams need enough skill and training to question definitions, spot odd outputs and decide when a result is safe to use.
Decision-Grade Doesn't Mean Perfect
Decision-grade data is reliable enough that its remaining uncertainty is unlikely to change the action you choose. That standard depends on the consequences: an exploratory merchandising review can tolerate gaps that a credit or payroll decision should not.
Work works like a decision loop: question, evidence, action, then a check after implementation. If one link is weak, the answer may still be arithmetically tidy and operationally wrong.
Common flaws change conclusions in specific ways:
- Missing values: Incomplete records from a slow month can make a genuine dip disappear from a comparison.
- Duplicate customers: Counting a buyer repeatedly can distort retention, especially when duplicate profiles carry inconsistent purchase histories.
- Inconsistent product names: A bestseller split across several names may never appear among the leading products.
- Delayed stock updates: Recorded availability can exceed what is on the shelves when the order is placed.
- Biased samples: Feedback from loyal customers alone can encourage promotions aimed at people who would have purchased anyway.
For a practical preparation task, use this guide to removing duplicates from business datasets before calculating customer metrics.
Minimum Readiness Checklist
- Metric ownership: Assign someone to resolve questions about each measure, including edge cases such as refunds and partial payments.
- Agreed definitions: Document what counts as a sale, customer or return so two reports do not use different rules.
- Documented source: Record where the information originates and which system wins when records disagree.
- Refresh schedule: Match updates to the decision's timing; daily means little if purchasing reviews happen hourly.
- Spot-check routine: Compare selected records with their originals, such as invoices against ledger entries.
- Pause rule: Stop affected analysis when critical checks fail, then resume only after the cause is corrected.
Restrict access to customer and financial information, and use approved systems for processing sensitive records. Platforms do not remove accountability: people still define the question, validate unusual results and judge whether an insight is actionable.
From Averages to Forecasts
Most analytical methods aren't exotic. You can answer many useful questions with totals, percentages, averages and carefully chosen comparisons before introducing a predictive model.
The method should follow the question. Asking what is data analytics doesn't require learning every algorithm, but it does require understanding what different outputs can and can't tell you.
Core analytics methods and what they answer
Method | What it does | Business example |
|---|---|---|
Summary statistics | Calculates averages, totals and percentages | Average basket size per store each week |
Regression | Measures how factors move together | How ad spend relates to weekly sales |
Classification | Sorts records into categories | Flags invoices likely to be paid late |
Clustering | Groups similar records without predefined labels | Segments customers by purchase pattern |
Time-series forecasting | Projects values over time | Next quarter's cash position |
Anomaly detection | Flags values that break the usual pattern | A sudden drop in one store's sales |
Understand the Output Before Acting
Summary statistics help managers establish scale and compare performance, but an average can hide meaningful differences between stores or customer groups. Check the spread and relevant segments before deciding that an average describes everyone.
Regression estimates relationships between factors, rather like adjusting several controls to understand how an outcome changes. Advertising and sales may move together, but seasonality or promotional pricing could explain part of that relationship.
Classification assigns categories, often with a score or probability, so a finance manager can prioritize invoice reviews. Clustering instead finds similarities without starting with predefined categories, which can reveal purchasing groups that don't match your existing marketing labels.

Match Complexity to the Decision
Time-series forecasting uses the ordering of observations to estimate future values. Managers care because payment timing, seasonal demand and recurring trading patterns affect how they plan cash and stock.
Anomaly detection identifies observations that deserve attention, not necessarily wrongdoing or system failure. An unusually large order might be legitimate, so the alert should prompt investigation rather than automatic rejection.
Automated platforms can run these methods without requiring you to write code. You still need to understand whether you're receiving a description, a probability, a grouping or a forecast, and whether the assumptions fit your operation.
For a beginner question about current performance, start with summary statistics and segmented comparisons. For a planning question about future demand, investigate time-series forecasting and find demand planning software for SMBs that makes assumptions and uncertainty understandable.
Practical rule: Choose the simplest method that supports the decision, not the most impressive method your platform can run.
Where Data Analytics Creates Business Value
A McKinsey analysis of 714 companies found that investment in big-data software, analytics, hardware and analytics talent was associated with an average initial operating-profit increase of approximately 6%, rising to about 9% for companies sustaining investment over five years. These are associations across the companies studied, not guaranteed returns for an SME.
The practical lesson isn't to buy more analytical capacity and expect profit to follow. It's to connect each application to a changed operating decision and a measure of success.
Business functions, core questions and metrics to track
Function | Core question | Metric to track |
|---|---|---|
Retail inventory | Which products run out or sit too long? | Stock turnover and stockout rate |
Promotions | Which offers lift margin, not just sales? | Incremental gross margin per promotion |
Finance and risk | Which payments or accounts look unusual? | Late-payment rate and alert precision |
Cash flow | How much cash will be available in 90 days? | Forecast error against actual cash |
Marketing | Which channels bring profitable repeat customers? | Customer acquisition cost and repeat purchase rate |
The cash-flow horizon is an example planning window, not a recommended standard for every business.
What Success Looks Like in Practice
- Retail inventory: A replenishment rule works when fewer products run out without creating excessive slow-moving stock.
- Promotions: An offer succeeds when additional gross margin exceeds the relevant discount and campaign costs, not just when revenue rises.
- Finance and risk: Prioritized reviews help when staff identify genuine issues without spending their day investigating harmless alerts.
- Cash flow: Better planning should help the finance team anticipate shortages and adjust payment or funding decisions.
- Marketing: A channel deserves investment when acquisition costs and subsequent customer behavior support profitable growth.
For inventory teams extending their work into delivery and distribution, Faberwork's approach to logistics analytics offers a related operational example.
Measure Business Impact, Not Just Model Performance
Forecast accuracy alone isn't enough. A model can reduce prediction error while margins stay flat because recommendations arrive too late, ignore purchasing constraints or aren't used.
Record the starting position before changing a process. Where practical, compare a changed process with a similar unchanged one; otherwise, use a careful before-and-after comparison that accounts for seasonality and other changes.
These applications support financial and compliance work, but they aren't financial, legal or regulatory advice. Qualified people should review decisions with material consequences.
Treat the table as a starting map. Choose a function with a clear owner and an observable outcome before expanding.
How Analytics Turns Insight Into Decisions
Suppose a demand forecast suggests a product will sell faster than expected. Producing that estimate isn't the finish line: the purchasing manager must decide whether to change an order, the buyer must implement it and someone must compare the outcome with the starting position.
That's the decision loop:
- Insight: Identify an expected shortage.
- Owner: Give the purchasing manager responsibility for reviewing it.
- Action: Adjust the order within an approved spending limit.
- Measurement: Compare product availability and excess stock with the baseline.
A dashboard alone rarely changes behavior because it doesn't necessarily grant permission, resolve conflicting priorities or explain who should respond. A useful operating process makes those responsibilities explicit.

Add Oversight Without Creating Unnecessary Complexity
The NIST Artificial Intelligence Risk Management Framework organizes risk management into four functions: GOVERN, MAP, MEASURE and MANAGE. SMEs can translate them into practical responsibilities:
Function | Practical application |
|---|---|
GOVERN | Set responsibility for data access, report approval and automated actions. |
MAP | Identify who could be affected by an inaccurate forecast or recommendation. |
MEASURE | Monitor forecast error, input quality and relevant operational outcomes. |
MANAGE | Define when to investigate, pause automation, correct inputs or change the process. |
For example, a team might agree that a forecast missing expectations for three consecutive weeks triggers an input review. That's an illustrative operating rule, not a universal threshold: first check missing transactions, product changes and update delays before commissioning a replacement model.
Human review matters particularly for credit, compliance and consequential pricing decisions. Reviewers need enough context to challenge an output, not merely a button to approve it.
For further practical context, ELECTE's guide to AI-driven insights explores the connection between generated findings and business use. Before adopting automation, decide who approves the report, who may act on it and what happens when it's wrong.
Start With One Decision You Can Measure
Everything covered so far converges on a single piece of advice: begin smaller than you want to. The teams that get value from analytics fastest are the ones that pick one bounded, measurable decision and run the whole loop on it, rather than trying to analyze everything at once.
Define the decision before selecting the method. Make the relevant data decision-grade rather than waiting for every record to become perfect. Then choose an approach whose output your team can interpret and act on without translation.
A manageable first project could be weekly reorder quantities for a clearly defined group of best-selling products. Assign a purchasing owner, track stockout rate, and set a review date before changing any orders. That last step is what turns a report into a decision loop: you agreed in advance when you would check whether the analysis worked.
Key Takeaways
- Choose a bounded decision: Start where someone already has authority to act.
- Check the critical inputs: Focus on errors that could change the recommendation.
- Make uncertainty visible: Explain assumptions and limits alongside the result.
- Review actual outcomes: Keep, adjust or stop the approach based on what happened.
ELECTE, an AI-powered data analytics platform for SMEs, offers data analysis without requiring an analyst. Its AI Agent performs work an analyst would: it reads data, writes reports and researches the market on schedule or on demand, 24/7.
You still own the question and the decision. The platform can support the analytical work, while your team supplies the context, approves consequential actions and judges whether the results helped.
The most useful answer to what is data analytics is therefore practical: it's a disciplined way to replace unsupported assumptions with evidence you can act on and evaluate.
ELECTE offers analysis, forecasting and reporting to help you put a measurable decision loop into practice. Visit ELECTE to explore the platform, then bring a specific business question to test how its analysis, forecasting and reporting would support your next decision.
Comments
No comments yet — start the conversation.