10 Alternatives to Power BI for Growing Teams in 2026
Compare 10 alternatives to Power BI with pricing notes, strengths, limits, and use cases. Find the right analytics platform for your team today.

Your month-end close finished last Tuesday, but it's Friday and you're still in Power BI, rebuilding the same three visuals because a column changed name in the source system. Nobody asked you for those visuals. They asked for a number, and the number sits behind a model you built and only you can maintain.
That's usually the moment teams start pricing out alternatives to Power BI. Not because the product fails. It ships inside the Microsoft stack, costs little per seat, and half of finance already knows the interface. Teams leave when the licensing math breaks at scale, when every new question needs a data model rebuilt, when a warehouse has to exist before anyone sees a chart, or when there's no analyst left to press the buttons.
Below are ten platforms worth a serious look in 2026, each tied to a specific reason teams walk away from Power BI. You'll get honest limits and a "switch if" call for each one, so most of the list rules itself out for you in a minute.
1. ELECTE
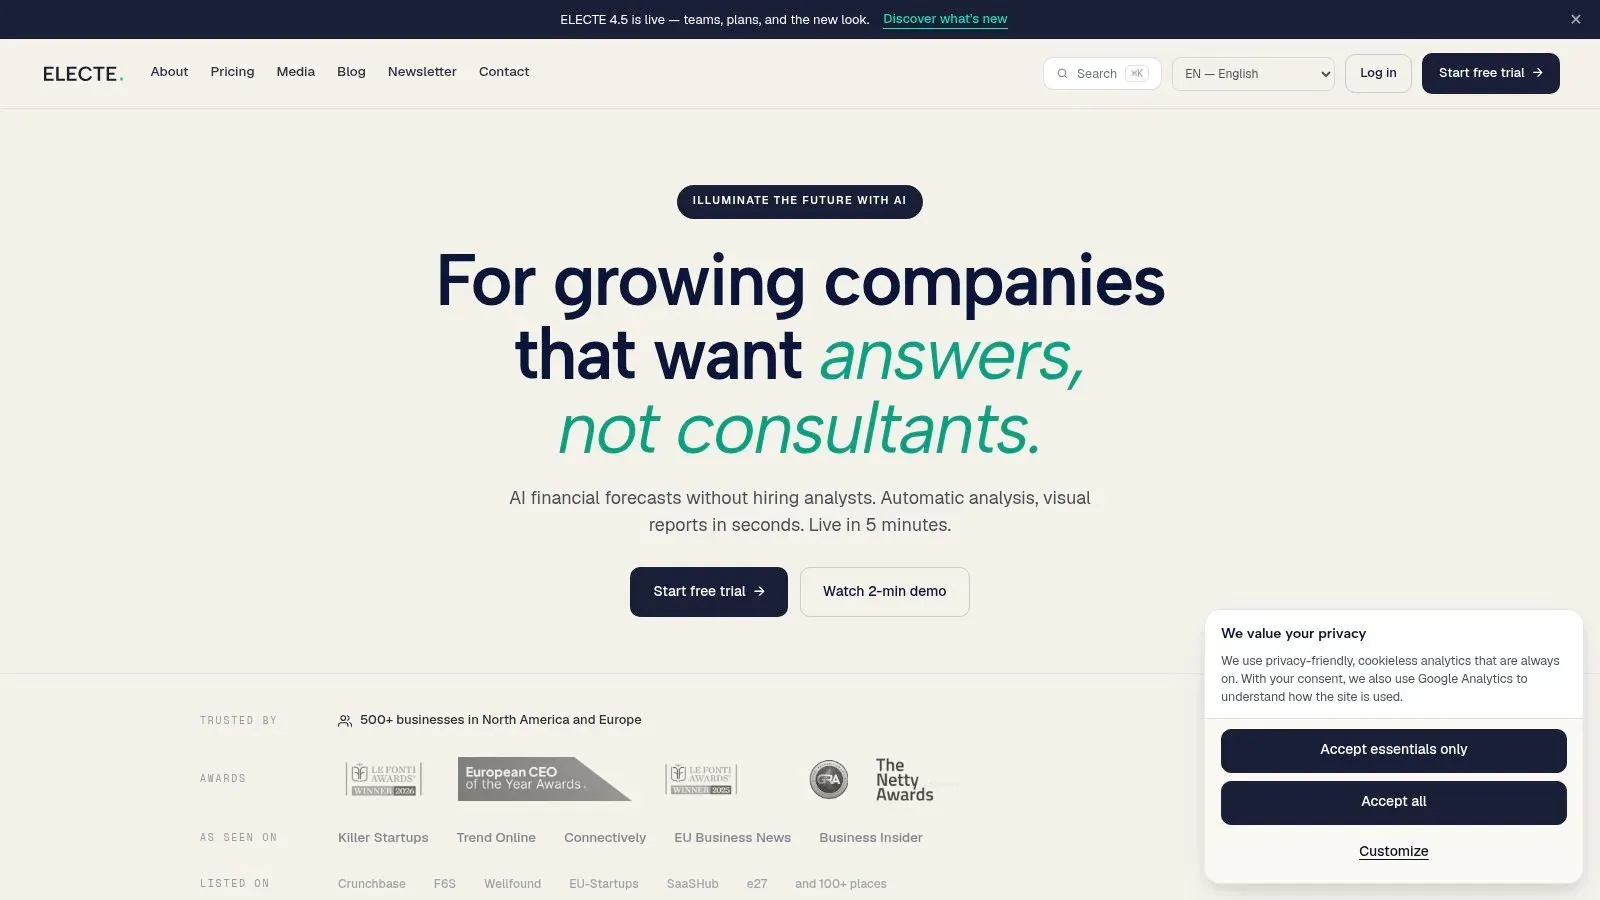
You don't have a data analyst. That's the gap ELECTE was built to close. It's an AI-powered analytics platform for growing companies: connect QuickBooks, Xero, or an Excel/CSV file and you get forecasts, cash flow views, and board-ready reports without building a model first. Setup takes about five minutes, since you link accounts or upload a file rather than run an integration project.
The AI Agent handles the maintenance work
The autonomous AI Agent runs on demand or on a schedule. It monitors connected data for anomalies, drafts reports, and can take on analyst tasks like analyzing revenue drift, summarizing your top 10 competitors, or preparing board decks. Its forecasting compares six methods on live numbers instead of forcing a single model across every metric. The dashboard pulls accounting, banking, and spreadsheet data into one place, keeps it current without manual exports, and projects the balance sheet forward, with one-click export or team sharing. ELECTE puts the saving at 10+ hours a week on financial analysis.
- Checkable pricing: Starter is €32 per month (basic financial analytics, revenue trend tracking, monthly forecasts, 90-day history, CSV export); Business is €40 per month and adds the AI Agent, AI-powered forecasting, unlimited history, advanced integrations, and cash flow predictions.
- Connections: QuickBooks, Xero, and Excel/CSV uploads, plus API access and an MCP Server for pulling forecasts into your own tools.
- Microsoft Teams integration: scheduled reports and alerts inside Teams channels, two years of history on first sync, multi-entity and multi-currency support, and read-only access that never writes back to your source systems.
Where it falls short: forecasts are only as good as the data you connect, and comparing six methods doesn't make the output a guarantee of accuracy.
Switch if: you're a growing finance or operations team that needs forecasts, board packs, and monthly reporting without hiring an analyst or building a semantic layer first.
2. Tableau
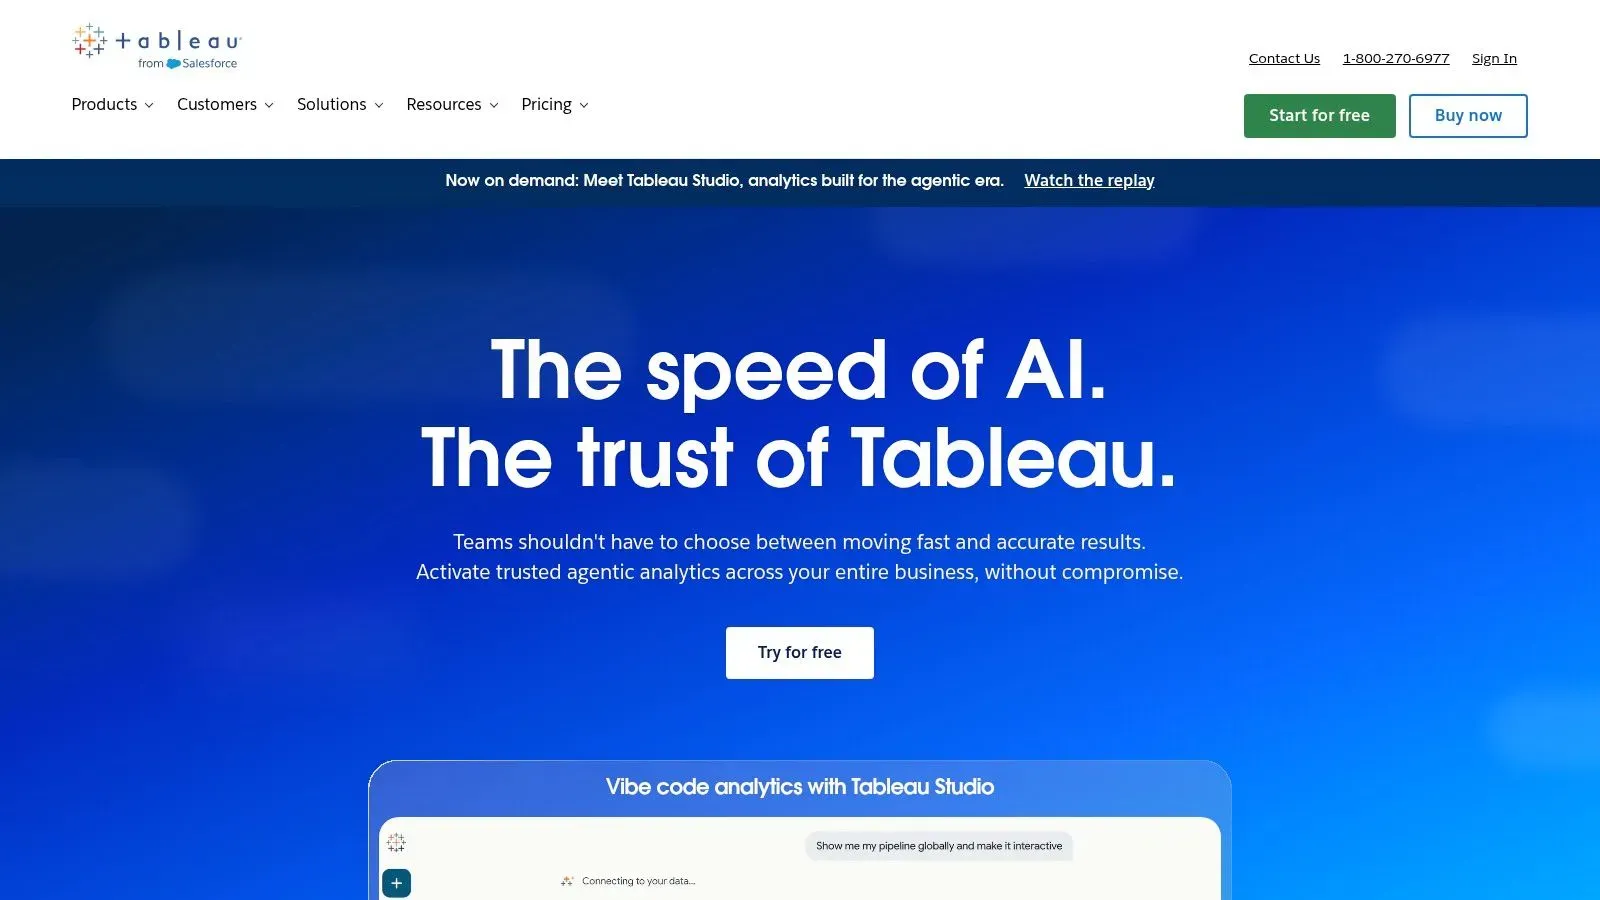
The market treats data exploration as core infrastructure, and Tableau is the clearest proof. Salesforce announced an all-stock agreement to acquire Tableau on June 10, 2019, at an enterprise value of $15.7 billion, according to TextQL's history of the Tableau acquisition. Nobody pays that multiple for a charting utility. They pay it for a product analysts open every morning.
The strength is still exploratory visual analysis. Drag a field onto a shelf and you see the shape of the data before anyone writes a spec. An analyst chases a question across a workbook without filing a ticket, then publishes a governed dashboard for everyone else.
- Best for: teams where analysts drive the questioning and business users consume polished dashboards.
- Deployment choice: Tableau Cloud for hosted, Tableau Server when you need self-managed.
- Built-in assists: Tableau Pulse for metric summaries and alerts, Tableau Agent for AI-assisted work in supported products.
The licensing trap
Tableau Cloud's Standard edition lists Creator at $75 per user per month, Explorer at $42, and Viewer at $15, billed annually, per Tableau's Cloud pricing page. Enterprise runs $115, $70, and $35. There's no single seat price to multiply across your company, so you have to forecast who builds, who explores, and who only reads. Work through the Power BI vs Tableau pricing comparison before you sign an annual contract.
Switch if: visualization depth is the bottleneck and you have analysts who'll live in it daily. If your real problem is cost or maintenance, Tableau makes both worse.
3. Google Data Studio (formerly Looker Studio)
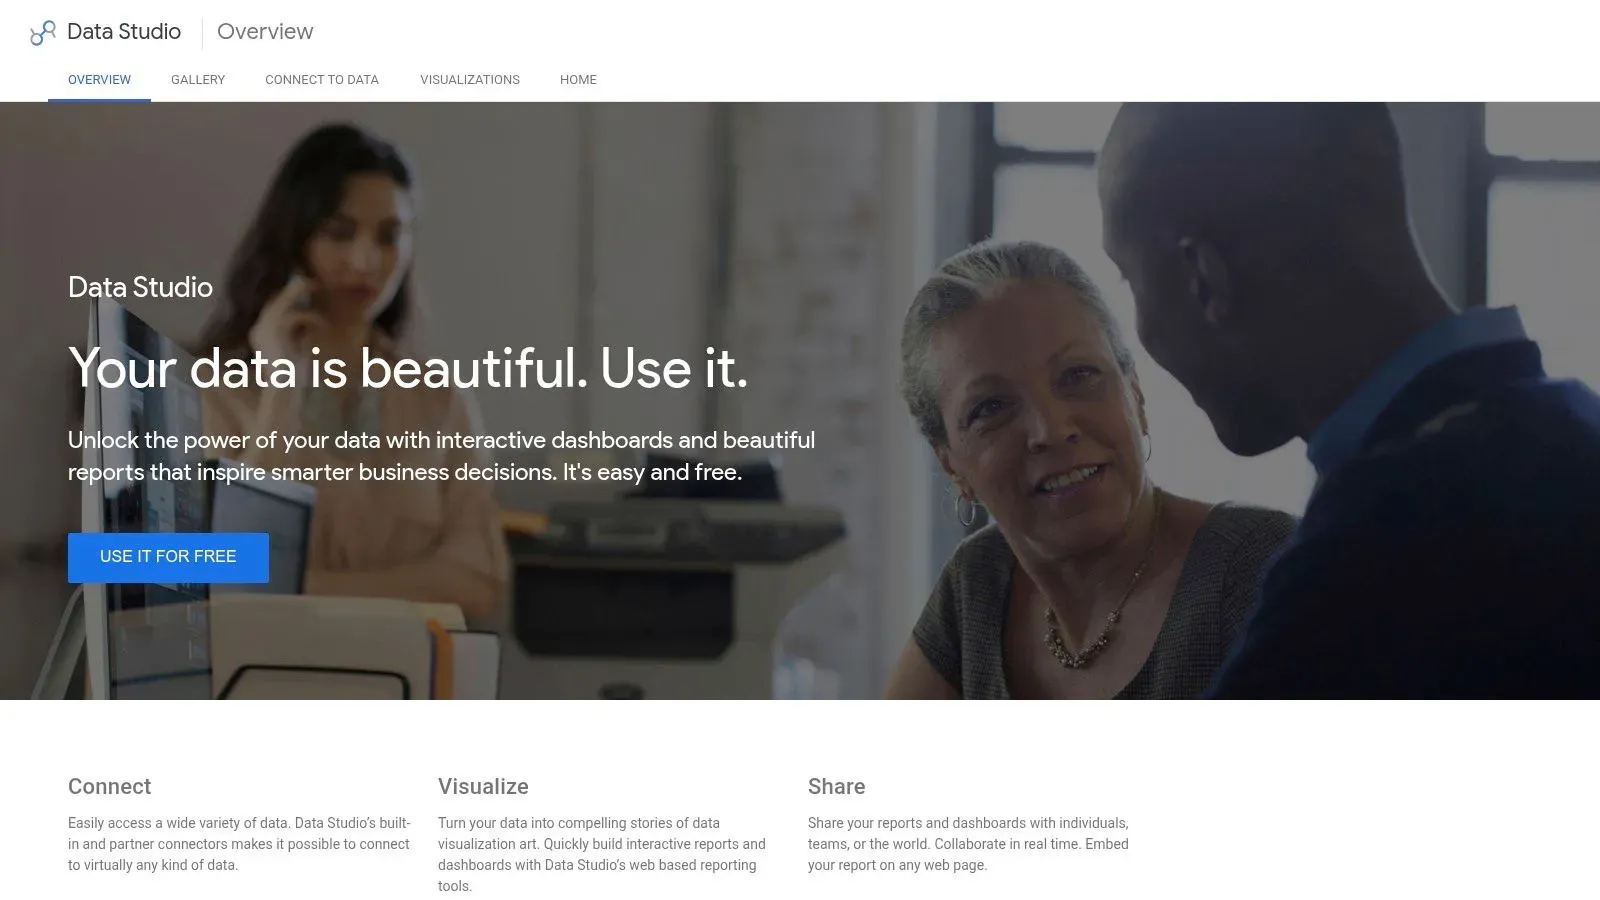
Free is a real strategy when the reporting need is modest. Google Data Studio, now branded Looker Studio, combines Sheets, BigQuery, and other connectors into shareable dashboards with a drag-and-drop editor. For a marketing team already living inside Google Ads and Analytics, that's a short path from raw data to a client-ready report.
- Cost: the standard product is free, which makes it easy to test or run for basic reporting.
- Speed: reviewers highlight quick, shareable dashboards and less manual reporting work.
- Admin tier: Pro capabilities cover organization-level administration and asset management.
Free doesn't mean private
Check what "free" exposes. Tableau Public is also free, but dashboards published there are visible to anyone on the open web, which rules it out for confidential sales, customer, inventory, or financial data, per Activepieces' breakdown of Tableau pricing tiers. Data Studio's default sharing behavior deserves the same scrutiny before you publish a P&L.
Depth is the other wall. Advanced data modeling and complex calculations hit a ceiling compared with full BI platforms, some third-party connectors are unreliable and need workarounds, and large reports slow down enough that you end up adding a separate preparation layer.
A free tool that costs your analyst an afternoon every week isn't free.
Switch if: you need accessible, low-cost reporting across Google sources and your questions are simple. Stay away if: finance needs governed metrics or you're calculating on messy data.
4. Looker (Google Cloud)
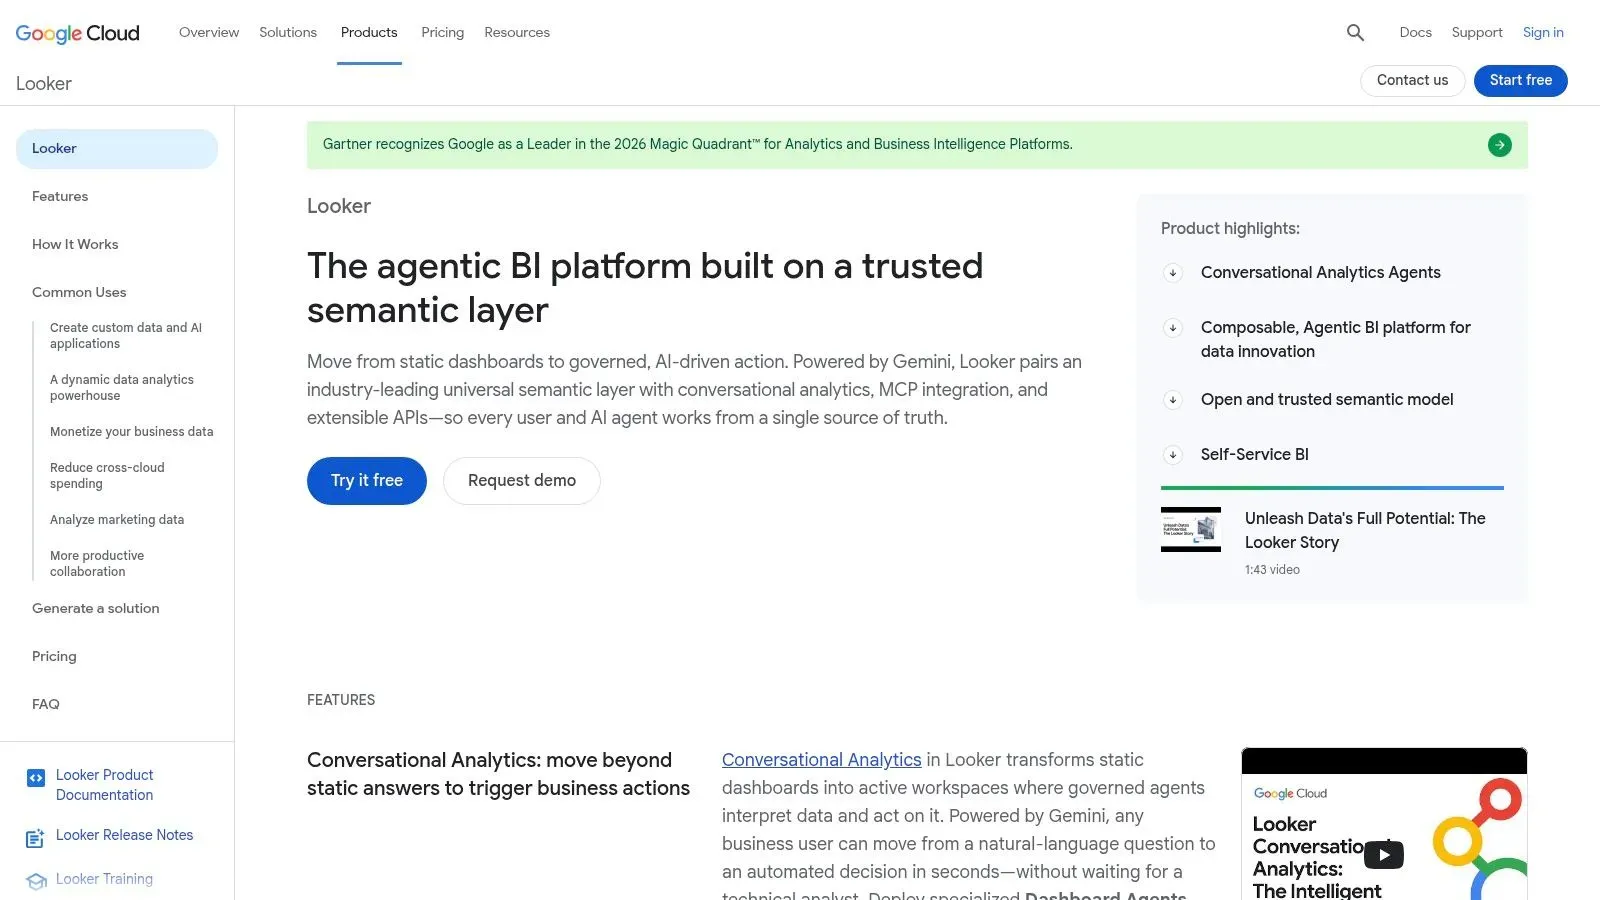
Most comparisons argue about features. The more useful question is where the logic lives. Looker puts it in LookML, a modeling layer that defines metrics and business rules once, so every dashboard, exploration, and embedded view pulls the same definition. Analysts stop reconciling two versions of "active customer."
That architectural choice explains where Looker sits among Power BI alternatives. Shortlists usually sort the market into visual exploration tools, associative engines, governed semantic-layer platforms, and search-first tools. Looker belongs to the governed semantic-layer group, and you choose it when metric consistency across departments matters more than speed to the first chart.
- Governed self-service: business users explore, but only within metrics you've defined.
- Warehouse alignment: strongest when data already sits in BigQuery or another cloud warehouse.
- Embedding: APIs and SDKs let you put governed analytics inside your own product.
The cost of that governance
LookML is code, and someone has to own it.
Building the model takes real engineering effort before a single chart exists. A self-service tool lets a manager build that chart alone; Looker needs a person who can write, test, and version a model first. For a five-person team without an analytics engineer, that hire is the entire budget. Custom platform and user licensing also makes pricing hard to compare before a sales conversation, so plan for a quote rather than a price list.
Switch if: you have a cloud warehouse, an analytics engineering function, and a genuine metric-consistency problem across departments. Skip it if: you need dashboards by Friday.
5. Qlik Cloud Analytics
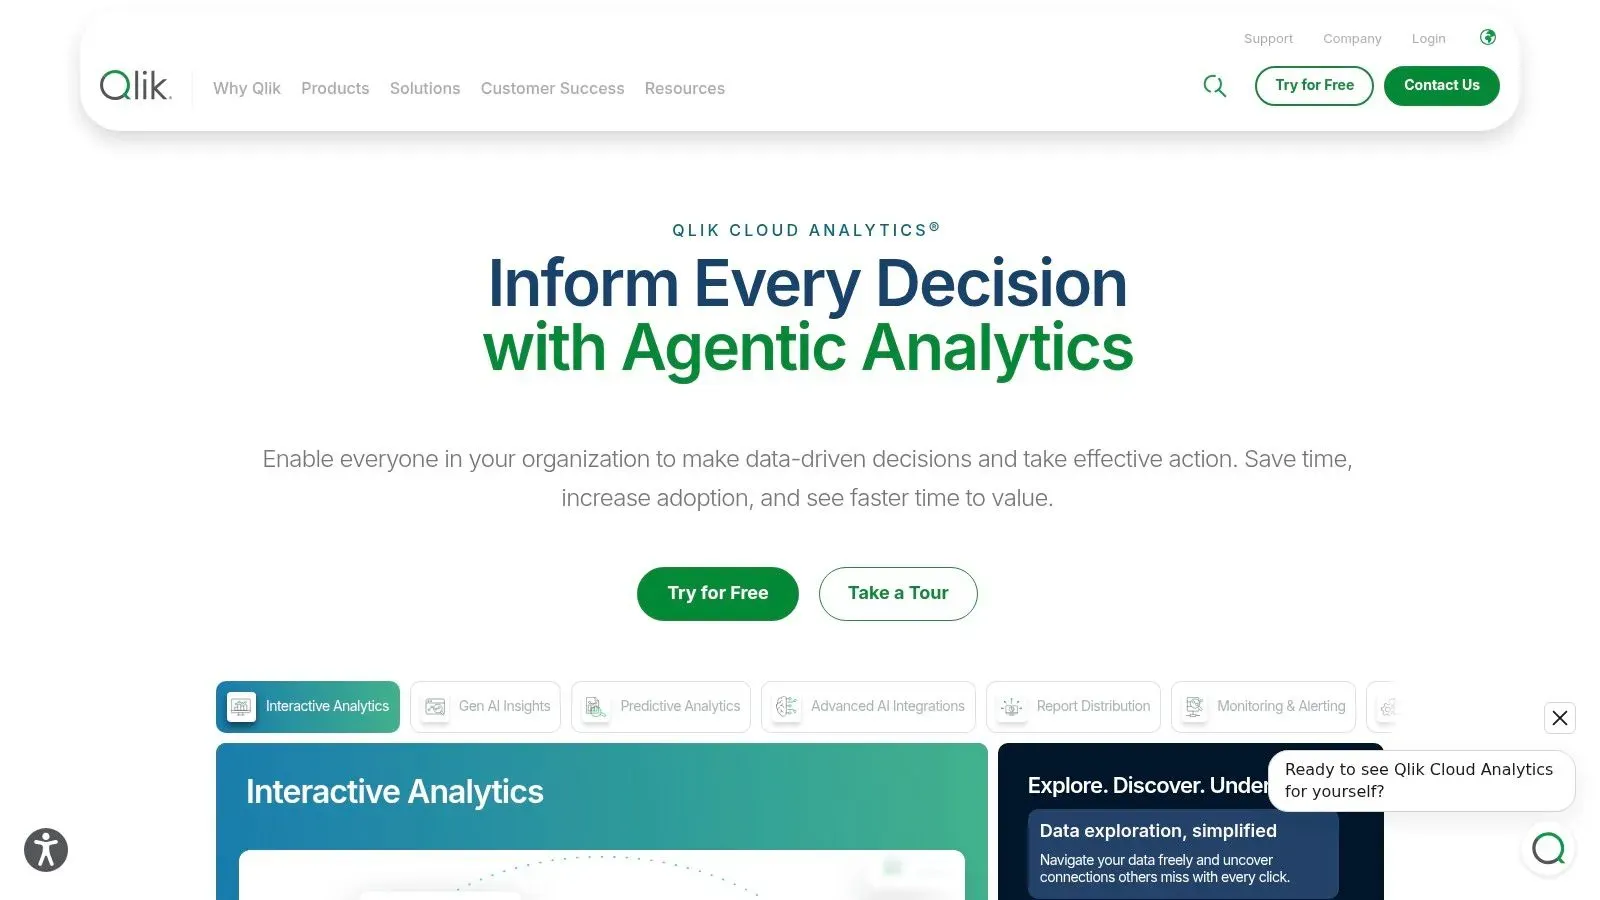
Qlik has been solving data exploration since 1993, when it was founded in Lund, Sweden, while business users still depended on centralized IT for static reports, according to Notion Capital's account of the Qlik exit. Its early product, QuikView, ran on an associative data model that let people follow relationships across data instead of one predefined query path. Qlik listed on Nasdaq in July 2010, raising $112 million with shares up about 28% on the first trading day, and Thoma Bravo took it private in 2016 in a deal valued at roughly $3 billion.
That history explains the product. The associative model shows what's connected and what isn't, which is how you find the outlier your dashboard never asked about. Click a region and every chart updates to the data associated with it.
- Analytics plus data movement: Qlik Automate handles workflows and reporting inside the same ecosystem.
- Predictive add-ons: Qlik Predict ships in Premium and Enterprise tiers.
- Assisted exploration: Insight Advisor and Qlik Answers sit at different tiers.
What it costs you in effort
Scripting and advanced development carry a learning curve, and publicly listed plans get expensive for smaller teams. Pricing depends on users, analyzed-data capacity, or both, so you need usage estimates before you can compare it to a per-seat product. For the platform-level view, read how ELECTE differs from both platforms.
Switch if: your analysts investigate fragmented sources and need to see relationships rather than a fixed dashboard. Skip if: you want a wide audience on read-only reports at low cost.
6. Zoho Analytics
If your business already runs on Zoho CRM, Books, or Desk, Zoho Analytics is the shortest distance between those records and a dashboard. Connectors, blending, and preparation live inside the same account structure, so you're not exporting CSVs into a separate tool every Monday.
The core feature set covers the basics well: reports and dashboards, scheduled reports and alerts, collaboration features, natural-language requests through Ask Zia, and a choice of cloud or on-premises deployment.
- Entry price: there's a free plan, and the paid entry point is accessible for a BI product.
- Data prep included: blending and preparation are part of the platform, not an upsell.
- Deployment flexibility: cloud or on-premises, which matters in regulated environments.
The ceiling shows up fast
The free plan caps you at two users and 10,000 rows, so treat it as a trial rather than a deployment. Advanced formulas, custom integrations, and complex dashboard work take time to learn, and users find the interface and customization less flexible than visualization-first tools. That's acceptable for operational reporting and painful for a board pack that depends on precise layout.
Switch if: you're an SME already inside the Zoho suite and need dependable reporting without onboarding another vendor. Skip if: your reporting is finance-critical or layout-heavy.
7. ThoughtSpot
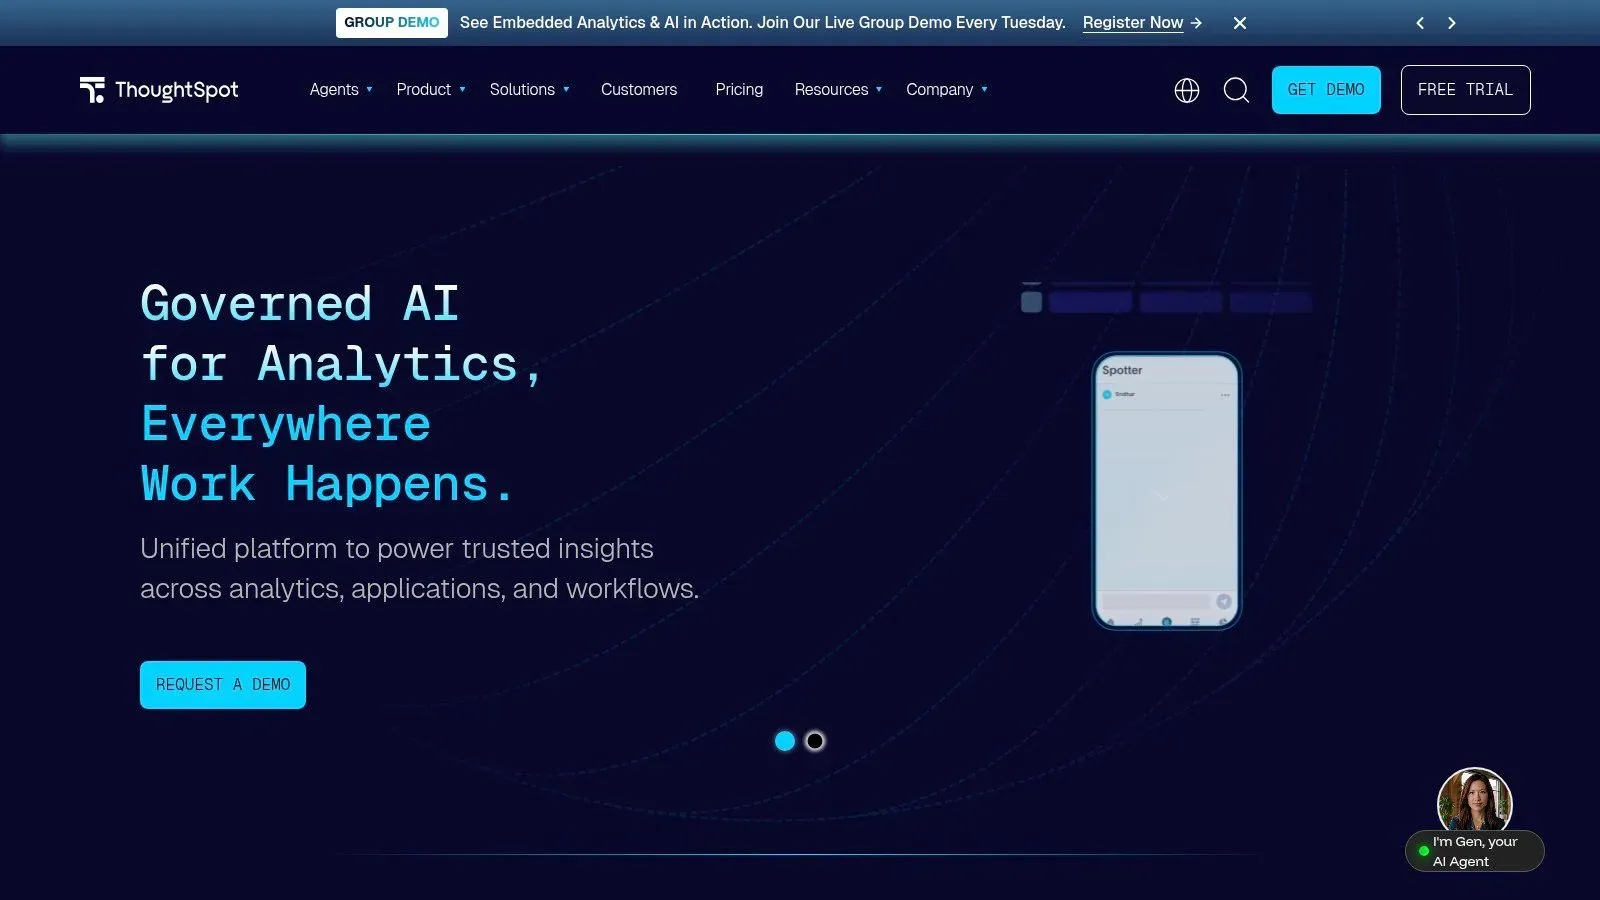
Search-first analytics sounds like a feature. It's really an answer to a staffing question: what if people could ask for a number instead of learning a dashboard?
The honest test: natural-language querying still needs a person to ask the right question and interpret the answer.
ThoughtSpot bets on that model. Users type a question, get a result, then drill into a Liveboard. Spotter AI agents handle question answering and insight discovery, and the platform connects to cloud data platforms with embedded analytics options.
- Adoption upside: reviewers praise the intuitive search experience, and non-technical users explore without a tutorial.
- Monitoring built in: interactive dashboards and alerts keep known metrics visible.
- Public pricing: some plans publish a starting point, which is unusual at this end of the market.
Where search meets its limits
Reviewers flag limited visualization customization and occasional slow loading. Both are survivable. The deeper issue is that results depend on well-prepared, governed underlying data. Point a natural-language engine at messy tables and you get confident wrong answers faster than before.
The passive-versus-continuous question matters here too. Flitch's comparison of Power BI alternatives separates tools that start with dashboards from agentic systems that automate analysis across data, and the criteria that distinguish them are anomaly-detection precision, alert fatigue, explanation quality, and the time between a detected issue and a business decision. A chat box answers none of those.
Switch if: self-service question answering for non-technical staff is the goal and your data is already governed. Skip if: you need standard reporting at a predictable price.
8. Metabase
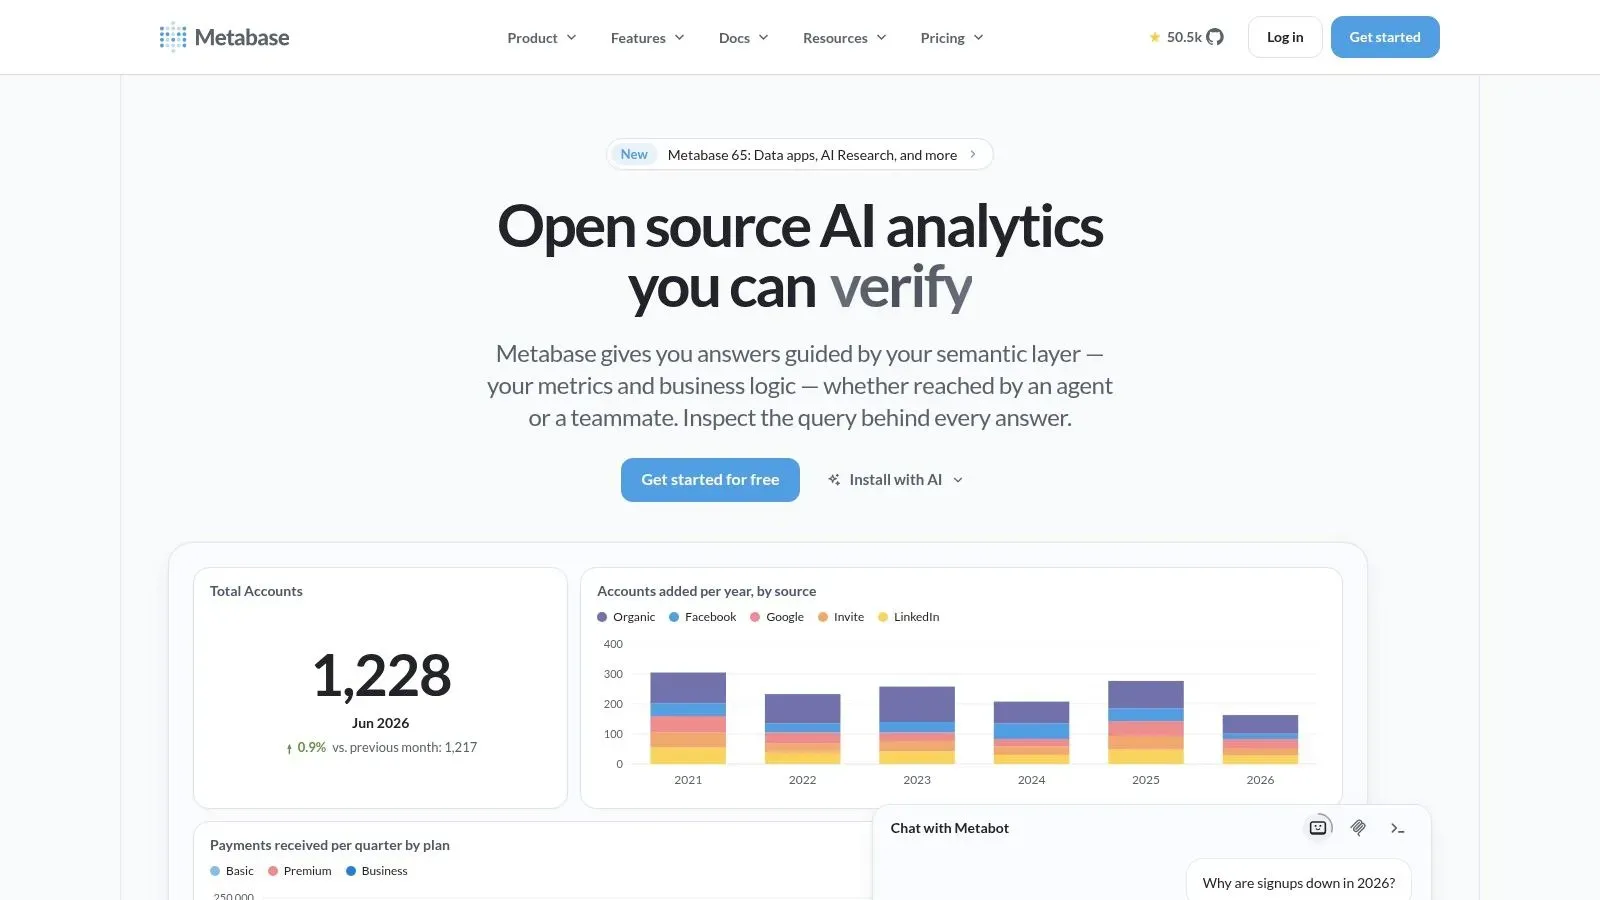
Metabase wins the first week of most BI evaluations. Connect a database, get your tables listed, and build a question in a visual editor. Analysts who prefer SQL get their own editor, and both paths coexist without a migration.
- Open-source edition: free to license and self-hosted, with unlimited users.
- Fast start: the shortest path from a database connection to a working dashboard.
- Deployment choice: self-host for control or use managed cloud plans.
- AI assists: natural-language questions and SQL generation, subject to configuration and usage terms.
The bill arrives in year two
Self-hosting means you own infrastructure, upgrades, and security. That's fine if you have a platform engineer with spare hours, and a second job if you don't. Advanced access controls and embedding sit behind paid plans, and managed plans get costly as users multiply.
Don't size this decision with market-share shorthand. A BARC 2023 estimate cited by Report Viewers' comparison of BI tools puts Power BI, Tableau, Qlik, and Looker at roughly 74% of the surveyed BI-tool market, falling to about 61% once embedded-analytics vendors are included. Neither figure predicts your onboarding time or reconciliation hours. Measure those instead: days to connect a new source, share of metrics defined in a reusable layer, and business questions answered without SQL.
For a broader shortlist, see the best self service analytics for SMEs.
Switch if: you want an approachable system you can self-host and you have someone to operate it.
9. Sigma
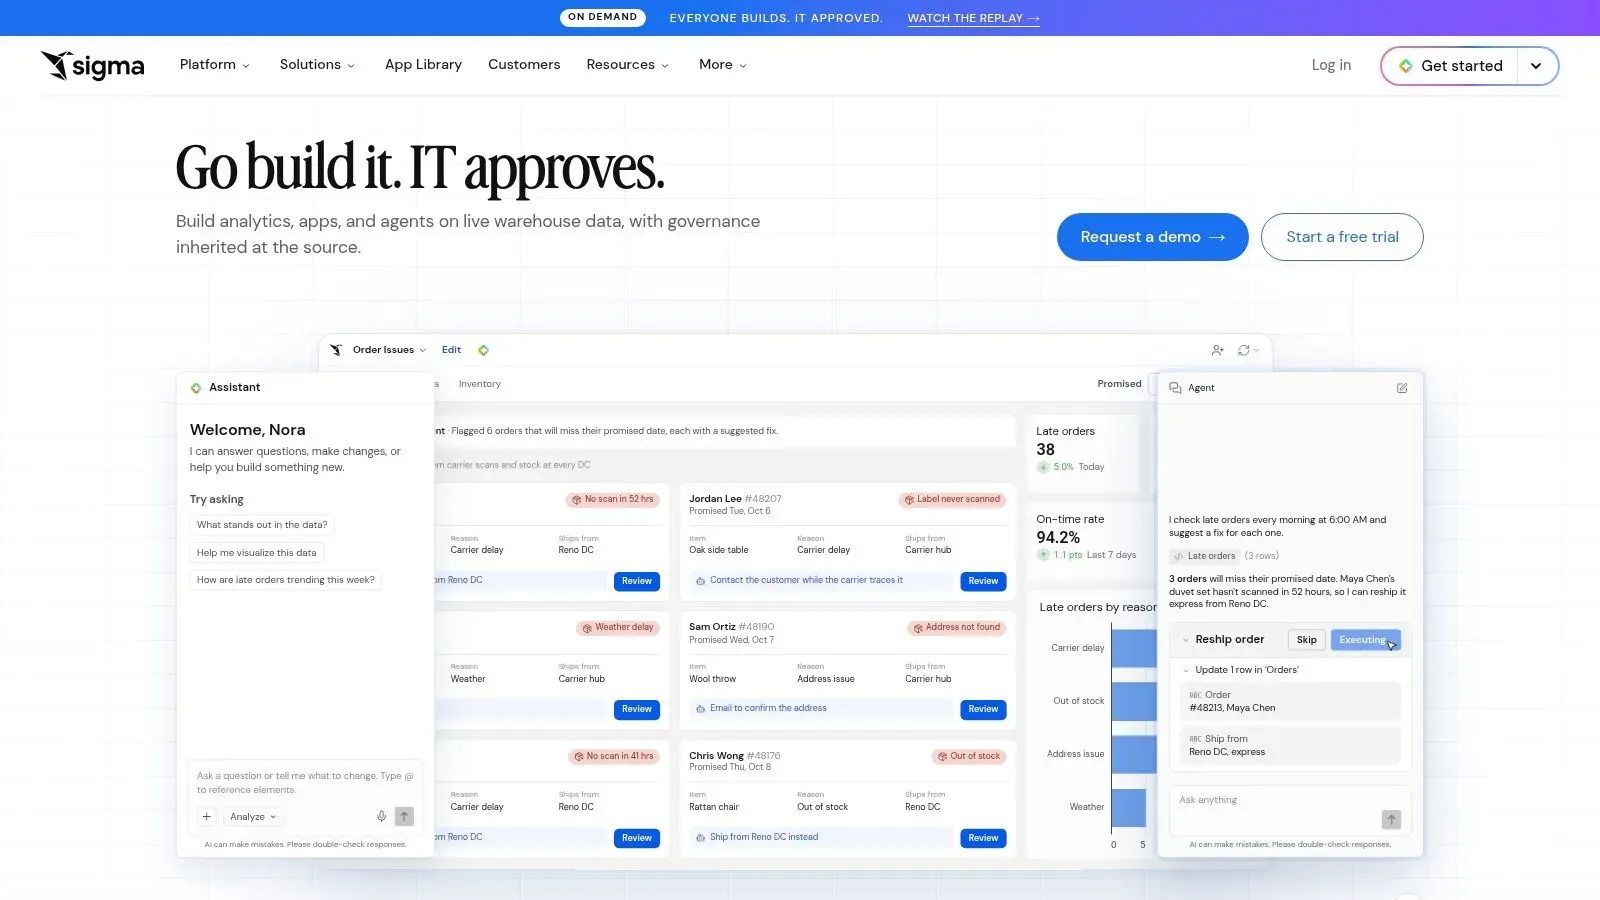
Sigma assumes a modern warehouse, and it pays off if you have one. Point it at Snowflake or Databricks and business users work in a spreadsheet-style grid on live data, while analysts drop into SQL or Python in the same workbook. Nothing gets extracted into a separate BI store.
- Familiar surface: the spreadsheet interface lowers the barrier for finance and operations users.
- Live data: queries run against the warehouse, so numbers match what your data team sees.
- Extras: reports, data applications, workflows, and embedded analytics.
Why pilots stall after month three
Two failure modes repeat. The first is warehouse dependence: if your system of record is an operational tool and the warehouse lags behind it, users hit stale numbers and return to their own spreadsheets. The second is economics. Pricing isn't publicly itemized, so you can't compare it to a per-seat product without a sales call, and a warehouse-centered design rarely suits a small team that wants one inexpensive reporting tool.
The pilot that tells you the truth: give the tool to five business users with no training and see who comes back the following week. Tools bought by leadership and ignored by staff are the most expensive kind.
Switch if: you already run a compatible cloud warehouse and want analysts and business users on the same live data. Skip if: you need an all-in-one reporting tool priced per seat.
10. Apache Superset
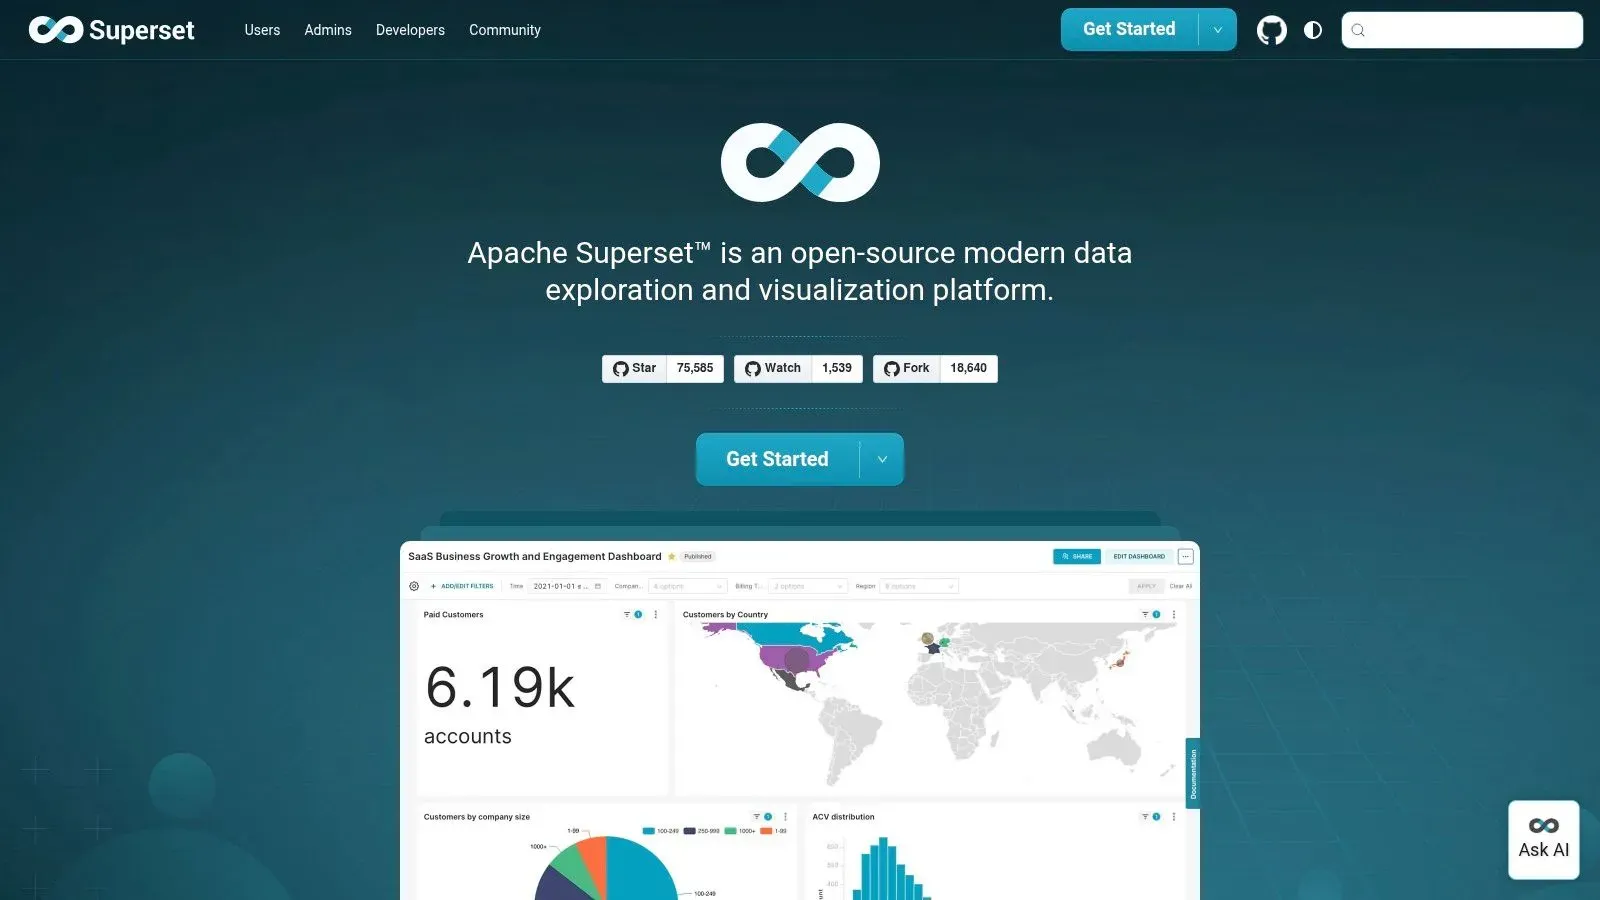
Superset is the honest answer for teams with platform skills and a taste for control. It's an open-source data exploration and visualization application that connects to SQL-speaking sources, with a no-code chart builder for the business side and a web-based SQL editor for analysts.
- No license fee: the open-source software costs nothing to use.
- Control: you choose deployment, authentication, and extensions, with API options built in.
- Breadth: it works across varied SQL databases and query engines.
Who actually pays
Free licensing isn't free operation. The documented Docker Compose setup is suitable for testing, not production, so someone owns deployment, upgrades, security, and monitoring. That someone is usually your most expensive engineer.
Total cost is where most alternatives to Power BI roundups stop short. The license is one line: creator, explorer, and viewer seats, infrastructure usage, migration, training, and ongoing dashboard maintenance all belong in the model, as FanRuan's Power BI alternatives analysis sets out. It notes that Metabase and Apache Superset can be free to license when self-hosted while staffing costs remain, and that Microsoft's replacement for new Premium capacity purchases is Fabric capacity, with an approximately $5,000-per-month F64 entry point for arrangements where viewers avoid individual paid licenses. Run that math three ways: small internal team, broad viewer access, and automated insight generation.
Switch if: you have platform engineers who want maximum control over deployment and cost. Skip if: business users need a tool that works without a technical gatekeeper.
How the ten Power BI alternatives compare on pricing model, free options, deployment, and best-fit teams
If licensing complexity pushed you off Power BI, read the pricing column as a mechanism, not a number: per-seat tools get expensive as your viewer count grows, while platform fees reward consolidation into one deployment.
Item | Pricing Model | Free Option | Deployment | Best For |
|---|---|---|---|---|
ELECTE (Recommended) | Starter €32/month, Business €40/month; custom Enterprise pricing | 7-days trial; free net invested capital calculator and company profile tools | Cloud-hosted | Growing companies that want automated financial reports and forecasts without an analyst |
Tableau | Per-user Creator, Explorer and Viewer licenses, billed annually; every deployment requires at least one Creator seat | Tableau Public (free, but dashboards are publicly visible) | Cloud or self-managed | Organizations building interactive dashboards and visual analyses |
Google Data Studio (formerly Looker Studio) | Standard product is free; paid Pro capabilities | Free standard product | Cloud | Small teams and Google-centric reporting |
Looker (Google Cloud) | Platform fee plus per-user licenses, quoted through sales | No ongoing free tier; trial arranged through sales | Cloud | Organizations needing governed metrics and warehouse-based analytics |
Qlik Cloud Analytics | Tiered subscriptions based on users and data capacity | Free trial | Cloud | Teams needing interactive analytics and integrated data workflows |
Zoho Analytics | Tiered paid plans | Free plan | Cloud or on-premises | Small and midsize businesses, especially Zoho users |
ThoughtSpot | Published pricing for team tiers; enterprise by quote | Free tier for small teams | Cloud and embedded options | Organizations seeking search-driven, self-service analytics |
Metabase | Free open-source edition; paid managed plans | Free open-source edition | Self-hosted or cloud | Teams wanting approachable BI with deployment flexibility |
Sigma | Custom per-user licensing over your cloud warehouse | Free trial | Cloud | Organizations analyzing live cloud warehouse data |
Apache Superset | Open source; no commercial license fee | Free open-source software | Self-managed or managed hosting | Teams wanting customizable SQL-based dashboards |
The free entries differ in kind. Data Studio is a free product, Tableau Public is free but publishes your dashboards openly, and Metabase and Superset are free software rather than a free service. Match the pricing mechanism to your ratio of builders to viewers before you compare features.
Choosing the Right Power BI Alternative for Your Team
Teams leave Power BI for four reasons: licensing complexity, modeling effort, warehouse dependence, and the lack of an analyst. Three questions tell you which of the ten alternatives resolves yours.
Who will build the reports? A data team with warehouse skills gets real value from Looker, Sigma, or Superset. Hand the same job to a finance manager with a spreadsheet and no analyst behind them, and Tableau or Looker turns that manager into a part-time developer. ELECTE exists for that second situation: connect QuickBooks, Xero, or a CSV file, and the AI Agent builds the report.
Where does your data live? Google sources point to Data Studio or Looker. A cloud warehouse makes Sigma the obvious trial. Zoho applications make Zoho Analytics the lowest-friction choice. If your data sits in scattered accounting and SaaS tools rather than one warehouse, integration coverage matters more than modeling depth.
How much control do you need over deployment and cost? Self-hosted open source trades license fees for engineering hours. Capacity pricing trades predictability for scale. Role-based licensing hides cost in the role mix. On Tableau's pricing page, every deployment requires at least one Creator license even when most employees only consume dashboards, Viewer Blocks cover broad access without an individual license per person, and products bill on annual contracts. That one mechanic changes your cost answer more than any feature grid.
Run one real workflow, not a demo
Shortlist two or three platforms and give each the same job: your messiest monthly report, the one that currently eats three days and a reconciliation. Measure time to the first correct dashboard, hours spent on data prep, and how many questions your team answered without you standing over the file.
That test is also how you judge automation claims. ELECTE customers save 10+ hours per week on financial analysis, and the only number that matters is the one you measure on your own close. A tool that removes the reconciliation step beats one with a prettier chart library every month.
Pick the platform that survives your worst reporting week, not the one that wins the demo.
You don't need another dashboard if what you need is someone watching the numbers. ELECTE connects your accounting, banking, and spreadsheet data, then runs an AI Agent that forecasts, surfaces trends and anomalies, and sends scheduled reports before you open the file at month end. Link your accounts or upload an Excel file and run your messiest close through it: connection takes five minutes, with no integration project.
Comments
No comments yet — start the conversation.