Automated Report Generation: How It Works for SMEs
Learn how automated report generation turns raw data into scheduled, decision-ready reports, with workflows, benefits and a step-by-step setup for SMEs.

98% of CIOs said a single built-in governance model for data and AI was critical, according to an MIT Technology Review Insights report cited in Databricks' data-governance guide. That reframes the reporting conversation: producing a polished document isn't enough. You also need to know where its numbers came from, who can see them, and who checked the conclusions.
For an SME, the immediate problem is usually more familiar. Someone exports transactions, repairs spreadsheet formulas, rebuilds charts, and emails a management pack. By the time leaders discuss it, that person may already be preparing the next version.
Automated report generation replaces that repeated assembly work with a defined process. But a useful implementation does more than send reports faster. It preserves evidence, highlights exceptions, and gives people clear responsibility for decisions.
You don't need to become a data scientist to understand it. Think of a report as a prepared meal: business records are the ingredients, calculations are the recipe, and review is the final taste test. Understanding those parts helps you choose what to automate, measure the benefit, and avoid trusting an attractive report that nobody can explain.
How Automated Report Generation Works in Five Stages
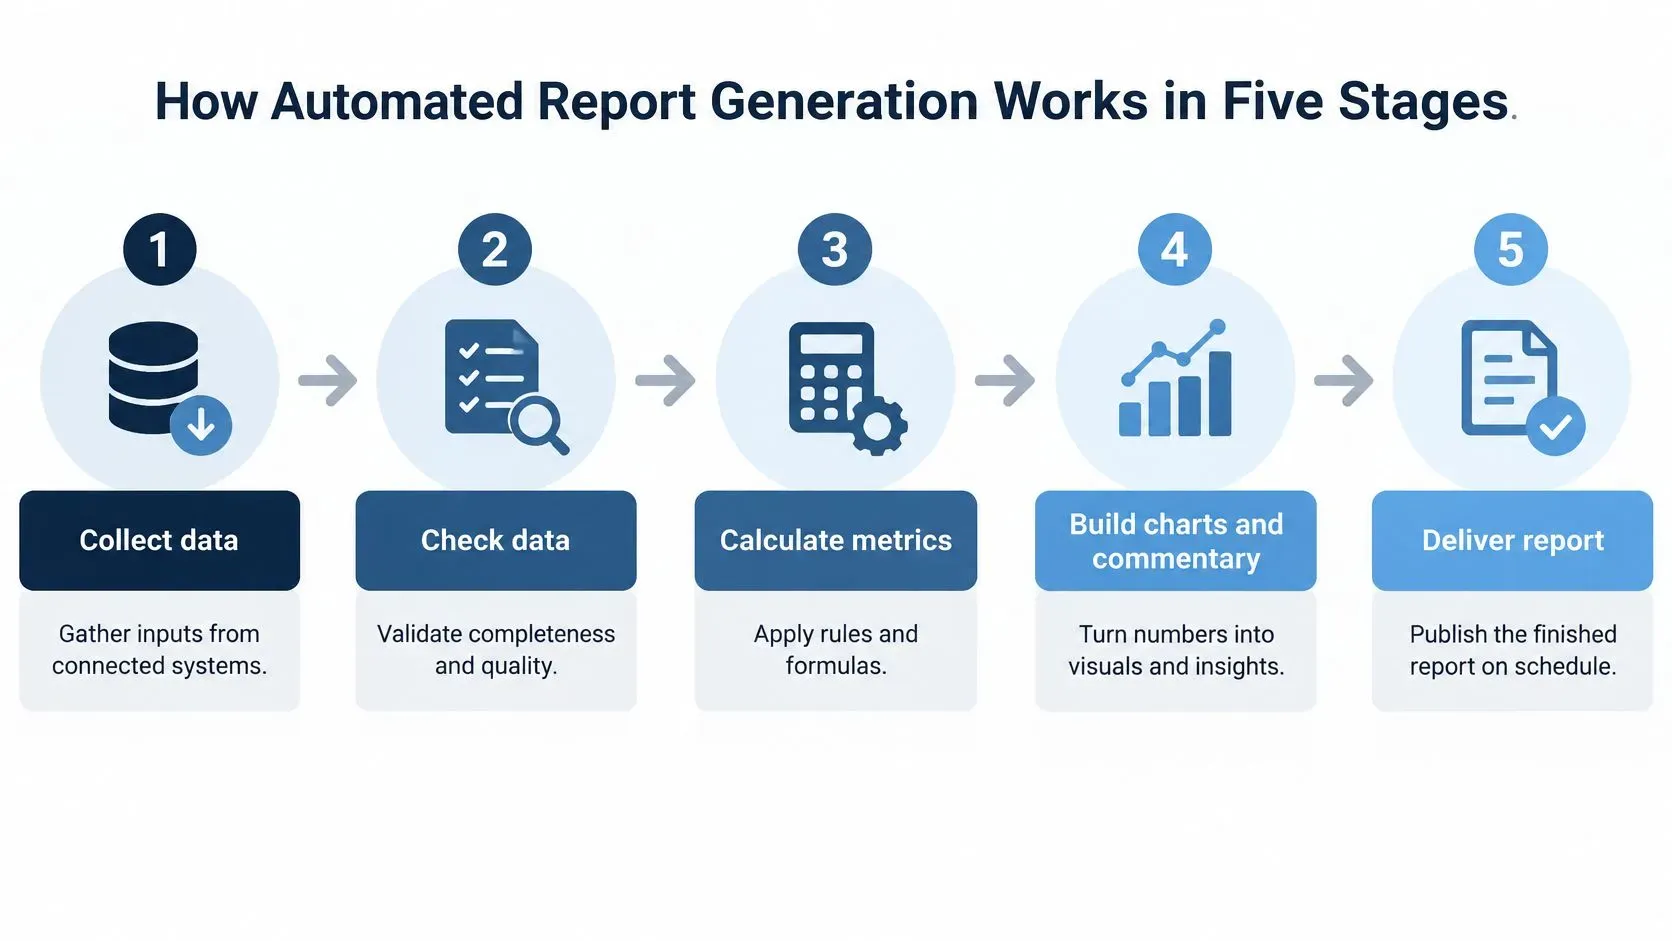
Automated report generation is a repeatable pipeline that collects data, checks it, calculates metrics, builds charts and commentary, and delivers the finished report on a schedule. Nobody has to rebuild the whole report from scratch each cycle.
A commercial kitchen offers a useful analogy. Ingredients arrive from different suppliers, cooks follow agreed recipes, and completed dishes leave at the right time. The head chef still tastes before service. Likewise, reporting automation needs consistent inputs and rules, while a person remains responsible for important interpretations.
The five stages of an automated report
Stage | What happens | Example output |
|---|---|---|
1. Connect sources | Pulls data from accounting, banking, CRM and spreadsheets | Live revenue feed from every system |
2. Clean and validate | Removes duplicates, checks totals and flags missing fields | Exception list of unmatched invoices |
3. Calculate metrics | Computes KPIs, period comparisons and variances | Revenue against last month with the percentage change |
4. Build visuals and narrative | Creates charts and commentary from the calculated metrics | Bar chart plus a two-sentence note on the main drivers |
5. Distribute and log | Sends the report on schedule and records the data used | Monday email to leadership with links to sources |
Consider a hypothetical monthly revenue report drawing from five systems: accounting, banking, CRM, e-commerce, and a spreadsheet of adjustments. Connections bring the records together, but they don't automatically make every record comparable. Your accounting system might record recognized revenue, while your bank records cash received.
Define those differences before calculating totals. If your teams disagree about sales, first fix mismatched sales and finance reports by aligning dates, identifiers, and metric definitions.
From records to a leadership email
The pipeline matches invoice identifiers, flags missing transaction dates, and applies your approved revenue definition. It then calculates the period comparison, builds the chart, and drafts commentary based on the calculated results. The leadership email contains the output and a route back to its evidence.
This end-to-end approach isn't yet universal: McKinsey's analysis found that more than 50% of surveyed data and analytics leaders said key data-management processes were automated at most only somewhat, while separate automation research reported that fewer than 20% had scaled automation across multiple parts of the business.
Practical test: Can the same template produce your report every cycle, with an exception list for anything the system couldn't verify?
If someone must repair the output before every delivery, you've automated only part of the preparation.
Why Manual Reporting Still Holds Teams Back
In a typical SME scenario, a retail manager exports data from separate systems and combines it in a spreadsheet that only its original creator fully understands. Sales, stock, and promotion results use different product names or reporting dates. Each weekly pack becomes another reconciliation exercise.
The routine looks manageable when you examine each task alone:
- Export sales from the point-of-sale system.
- Download stock counts from the warehouse application.
- Copy promotion results from a shared spreadsheet.
- Reconcile totals and repair broken formulas.
- Format charts and write commentary.
- Email the pack on Friday for Monday's meeting.
The manager sends a revised attachment after noticing a missing promotion. Someone else opens the earlier version during the meeting. The disagreement isn't about business performance anymore, it's about which file everyone should trust.
Why the routine persists
Each export seems too small to justify redesigning the process. The person who understands the formulas becomes the default troubleshooter, and colleagues avoid changing a workbook they can't confidently repair. Without a release log, nobody can easily establish which version was approved.
The underlying idea behind automation isn't new. CIO's history of business intelligence describes Hans Peter Luhn's 1958 paper, A Business Intelligence System, which outlined using machines to collect, organize, and distribute business information.
The practical obstacle is not just whether information is digital. It is whether your team has a repeatable process for turning it into an agreed report.
Ask your team: How many hours does each reporting cycle take? How many people touch the file before it's sent? Record the answers before changing anything.
Manual vs Automated Reporting, Task by Task
Compare tasks rather than comparing an entire spreadsheet with an entire platform. Some activities follow predictable rules; others require someone to understand a promotion, a supplier disruption, or an unusual customer contract.
Collection, reconciliation, and formatting are strong candidates because staff repeat them each cycle. Commentary needs a different approach: a system can draft an explanation, but an analyst should challenge whether the evidence supports it.
Manual and automated reporting compared by task
Reporting task | Manual approach | Automated approach |
|---|---|---|
Data collection | Files exported from each system | Scheduled connections pull data automatically |
Cleaning and checks | Reconciled by hand in spreadsheets | Rule-based validation with flagged exceptions |
Charts and formatting | Rebuilt by hand each cycle | Generated from one template on every run |
Commentary | Written from scratch each time | Drafted from the metrics and reviewed by an analyst |
Distribution | Attached and emailed manually | Sent on schedule with access controls |
Time per cycle | Staff hours for every cycle | Mostly review time once stable, with savings varying by organization |
A survey cited in a 2025 academic thesis reported that a typical SME owner using AI saved approximately 13 hours per week of personal work plus 13 hours equivalent in employee time, about 26 hours combined. That finding covers the surveyed users' AI applications, not reporting alone, and isn't a savings guarantee for your business.
For reporting, the plausible opportunities are concrete: fewer exports, fewer repeated lookups, and less chart rebuilding. Don't count those hours as saved until you also account for connection maintenance, exception handling, and review.
Benefits beyond the clock
A shared template gives leadership consistent definitions across reporting periods. Documenting calculation logic outside one person's workbook also makes a handover easier when staff change.
An exception list can bring missing records to the right employee before a management meeting. Set alerts to match operational needs, rather than waiting for someone to notice a suspicious chart.
Measure useful capacity released, not just how quickly the platform produces a document.
To establish your baseline, take your last three reports and log time against each table row. Mark the tasks that repeated unchanged, then identify which required business judgment.
Start with the repeated tasks. Keep a record of preparation time, review time, corrections, and late deliveries so you can evaluate the outcome without assuming a guaranteed return.
What a Modern Automated Report Contains
A modern report performs distinct jobs: it shows the numbers, explains their context, and supports a decision. A dashboard may accomplish the first job without accomplishing the others.
In a 2024 TechTarget survey of 375 data and IT professionals in North America, respondents reported automated visualization and dashboard creation at 40%, contextual recommendations and decision summaries at 39%, and AI-powered report generation at 38%, as summarized by AI Press Room. These are related capabilities, not interchangeable labels.
What useful context looks like
Say a sales report shows revenue drifting below forecast. A useful report identifies the product lines contributing to the gap, distinguishes lower order volume from heavier discounting, and states the assumptions behind the forecast.
It shouldn't turn an association into an unsupported cause. If sales fell during a promotion, the report can describe that timing, but it needs additional evidence before claiming the promotion caused the decline.
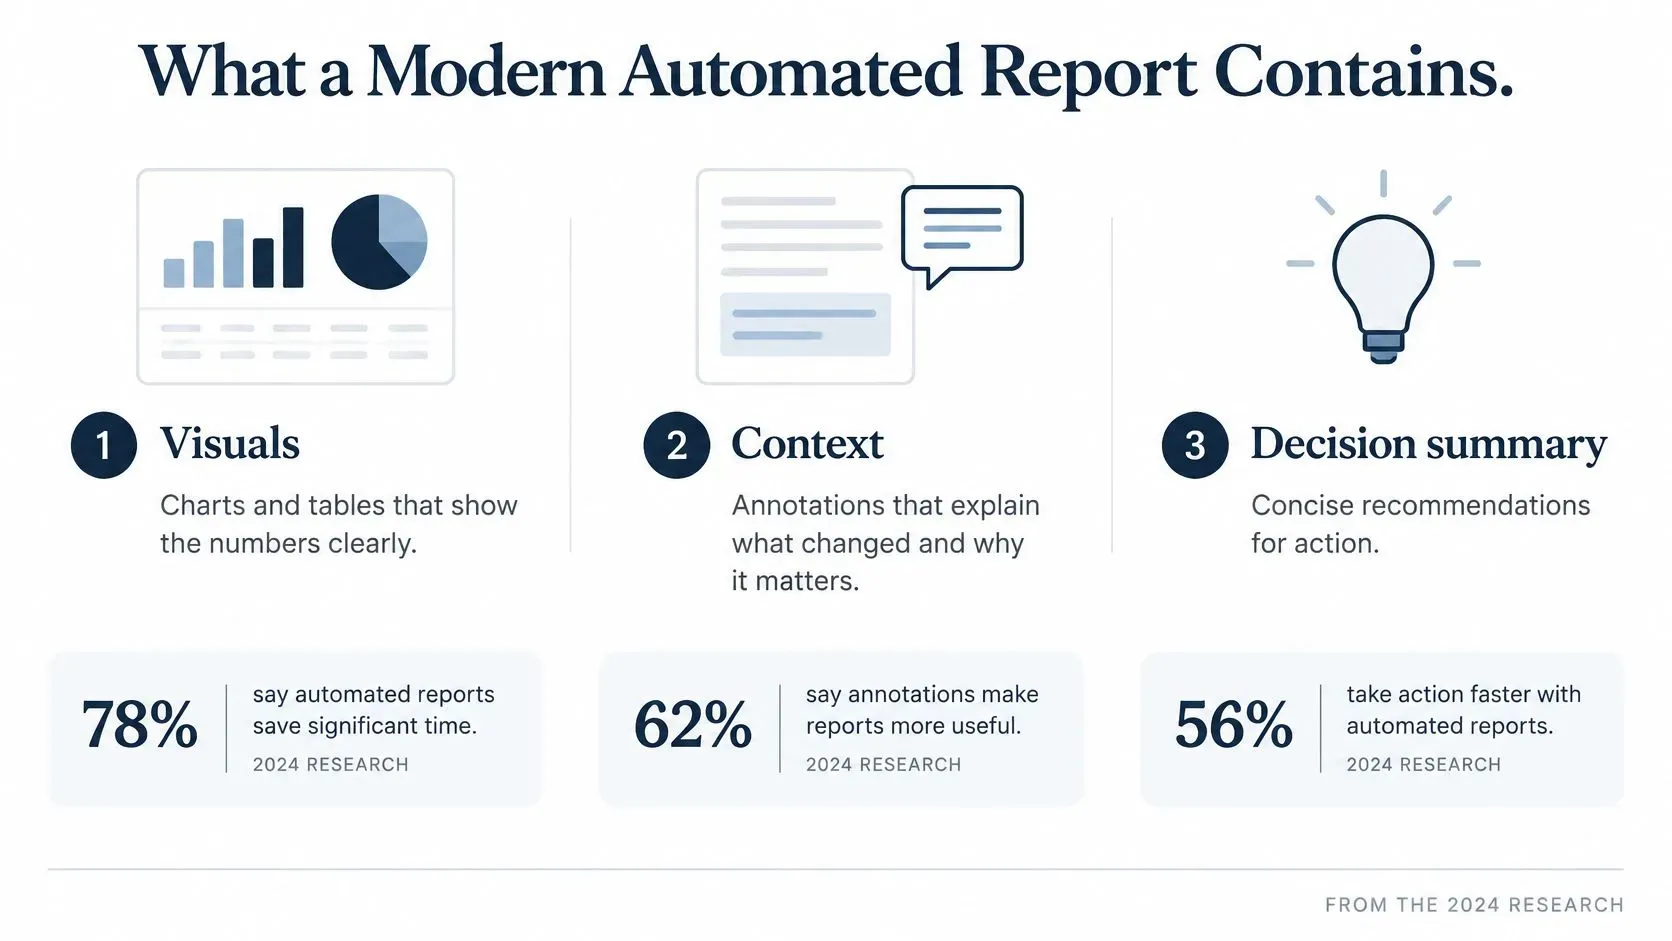
Use this component checklist when reviewing a template:
- Key KPIs: Include defined measures with their units and reporting period.
- Period comparison: Show an appropriate baseline, accounting for comparable trading periods.
- Anomaly explanations: Separate confirmed explanations from questions requiring investigation.
- Forecast assumptions: State what the projection assumes about demand, prices, or payment timing.
- Changes since last time: Identify revised inputs, altered assumptions, and material movements.
- Action owner: Name who investigates or acts, rather than ending with a vague recommendation.
Choose detail according to the reader's decision. A service manager checking operational issues needs different reporting from an executive evaluating account profitability. Vight's discussion of monthly versus weekly MSP reporting provides a useful service-business perspective on matching reporting frequency to management needs.
A report doesn't become more useful because it contains more charts. Keep the measures that help its reader decide what to investigate, approve, or change.
Real Workflows for Sales, Finance and Inventory Reports
The following scenarios illustrate workable designs, not promised implementation results. Each assigns a trigger, an automated task, and a human responsibility.
A retail chain's daily sales dashboard
The trigger is the overnight reporting cutoff. Point-of-sale and e-commerce orders enter the reporting pipeline after trading ends. The system groups transactions by store and product, then flags unusual drops for investigation.
Before the morning meeting, the regional manager spot-checks top products and flagged stores. A store closure or delayed upload needs a different response from a genuine demand decline, so the manager confirms operational context before assigning action.
A finance team's monthly close pack
The trigger is the agreed close timetable. In a hypothetical design, ledger, bank-feed, and payroll records are reconciled automatically, and a preliminary pack is generated on the first working day.
Preliminary doesn't mean approved. The controller checks outstanding adjustments and signs off on variances before release. If required entries haven't arrived, the pack should show its provisional status rather than imply the books are closed.
Upstream billing also affects this workflow. For a tutoring business, Tutorbase's guide to how to automate tutoring invoices is a relevant resource when examining how invoice preparation fits into the wider reporting process.
An inventory reorder report
A weekly cutoff triggers a comparison of stock levels, expected demand, and supplier lead times. The system lists items below their reorder point and suggests quantities using the agreed replenishment rules.
The buyer confirms quantities before purchase orders go out, considering supplier constraints, product substitutions, and upcoming promotions. Define your warehouse replenishment and stock metrics before turning suggestions into purchasing instructions.
Recurring reports by cadence, source and human check
Report | Cadence | Main data sources | Human check before release |
|---|---|---|---|
Daily sales dashboard | Daily | Point-of-sale and e-commerce orders | Spot-check of top products and flagged stores |
Weekly inventory and reorder report | Weekly | Stock system and supplier lead times | Buyer confirms reorder quantities |
Monthly close pack | Monthly | Ledger, bank feeds and payroll | Controller signs off on variances |
Weekly cash flow forecast | Weekly | Bank balances, receivables and payables | Finance lead reviews assumptions |
Quarterly board pack | Quarterly | All of the above plus agreed KPIs | Executive review and approval |
Treat these cadences as starting designs. Set the trigger according to when inputs are ready and someone can act on the output.
Every workflow needs the same allocation of responsibility: an event starts the run, automation performs the defined work, and a named person handles the relevant check.
Keeping Automated Reports Accurate and Auditable
A report can read beautifully and still be wrong. It might omit a significant exception, use an incorrect reporting period, or present an unsupported explanation with complete confidence.
NIST's evaluation of machine-generated reports distinguishes completeness, accuracy, and verifiability. These provide a more useful quality test than asking whether the writing sounds professional.
Test answers, not just sentences
Create a set of required question-and-answer pairs. For a revenue report, ask what revenue was against forecast, which product lines drove the difference, and whether missing transactions could change the conclusion.
Compare the generated report with the expected answers. Completeness means it includes required information; accuracy means the answers are correct; verifiability means a reviewer can find the supporting evidence.
Metric lineage is the path from a reported figure back through its calculation to its original records. It helps reviewers distinguish a source-data problem from a calculation or generation error. Hold or flag claims without supporting evidence instead of publishing them.

An audit-ready checklist
- Metric lineage: Preserve source identifiers and the query behind each measure.
- Timestamped input snapshots: Retain the data used for the published version.
- Transformation history: Record joins, exclusions, formulas, and manual adjustments.
- Model and version identifiers: Identify the forecasting model and reporting configuration.
- Uncertainty ranges: Show forecast uncertainty where the method supports it.
- Exception log: Record failed checks, unresolved gaps, and their owners.
- Approval trail: Capture who reviewed and authorized release.
- Access controls: Limit viewing and editing according to role.
- Correction procedure: Mark superseded reports and notify affected recipients.
- Escalation rules: Specify who decides whether incomplete data blocks publication.
Say a buyer disputes an inventory balance. With a retained snapshot and query, an analyst can trace whether the report excluded goods in transit or used an outdated warehouse feed. The task becomes reconstructing a calculation, not searching through email attachments.
Release rule: A missing input should produce a visible exception, not an invented explanation.
Freshness deserves its own check. Establish how to monitor data timeliness so an apparently current report doesn't conceal an old source feed.
Privacy note: Customer and employee records need role-based access and masked personal fields in shared outputs. Review applicable local data-protection rules before connecting sources, and retain only what's necessary. Reporting controls support financial and compliance work; they don't replace professional advice or determine your legal obligations.
Choose Your First Reports to Automate
Readers trust automated output they can inspect. A label saying a machine wrote the report answers a different question from the one your audience asks: what was validated, and who remains accountable for it? Build that accountability into the automation itself, the same way you build in the charts and commentary, rather than bolting a review step on at the end.
Match review effort to consequences
Review effort works like inspection on a production line. Routine components get sampled checks; safety-critical components get checked every time. Apply the same logic to reports: match the intensity of review to the consequences of a wrong number, then adapt the policy to your obligations and the reliability of your inputs.
Review level by report type
Report type | Release rule | Reviewer |
|---|---|---|
Stable descriptive metrics such as sales totals and stock counts | Automatic release after checks pass | Exceptions only |
Anomaly explanations and trend commentary | Analyst review before distribution | Analyst |
Forecasts and scenario assumptions | Analyst review of assumptions | Finance lead |
Reports affecting credit, employment, compliance or customer eligibility | Mandatory sign-off with an audit trail | Accountable manager |
Automatic release is earned through demonstrated reliability. During a pilot, compare outputs with an approved baseline and investigate every disagreement before relaxing review.
Rank candidate reports by frequency, staff time consumed, cost of error, and whether customers or regulators rely on them. A weekly internal sales dashboard with stable definitions is a sensible starting point: it recurs often enough to save real hours, and a mistake is visible and cheap to correct. A credit eligibility report sits at the other end of the scale because its consequences reach customers directly, so it needs mandatory sign-off from the outset.
Key Takeaways
- Choose a bounded pilot: Start with a recurring internal report whose inputs and definitions are understood.
- Measure the current workload: Record preparation, review, and correction time before automating.
- Set release conditions: Define which failed checks stop delivery and who resolves them.
- Make evidence accessible: Let reviewers inspect supporting records without requesting a separate investigation.
ELECTE, an AI-powered data analytics platform for SMEs, is one option for putting this approach into practice. It generates automatic weekly, monthly, or board-cycle reports from the live state of your data, including charts, commentary, and what changed since last time.
Most ELECTE users are operational in under 5 minutes, with analysis and initial forecasts beginning after connecting accounting software or uploading a file. Fast setup does not remove the need to validate your reporting definitions. A 2025 case study describes a fintech company using ELECTE to automate financial reporting and ensure real-time regulatory compliance; your own review requirements still depend on the decisions your reports support.
Start with a report you can check confidently. Done well, automated report generation means less repeated assembly, clear exceptions, and evidence a responsible person can defend.
ELECTE turns connected business data into scheduled reports your reviewers can inspect and share. Visit ELECTE to see how scheduled reports with charts, commentary and changes since the previous period would work with your data.
Comments
No comments yet — start the conversation.