Multi Source Data Integration: A Practical Guide for SMEs
Learn how multi source data integration works, from ETL vs ELT choices and field mapping to quality checks. Practical guide for SMEs with examples.

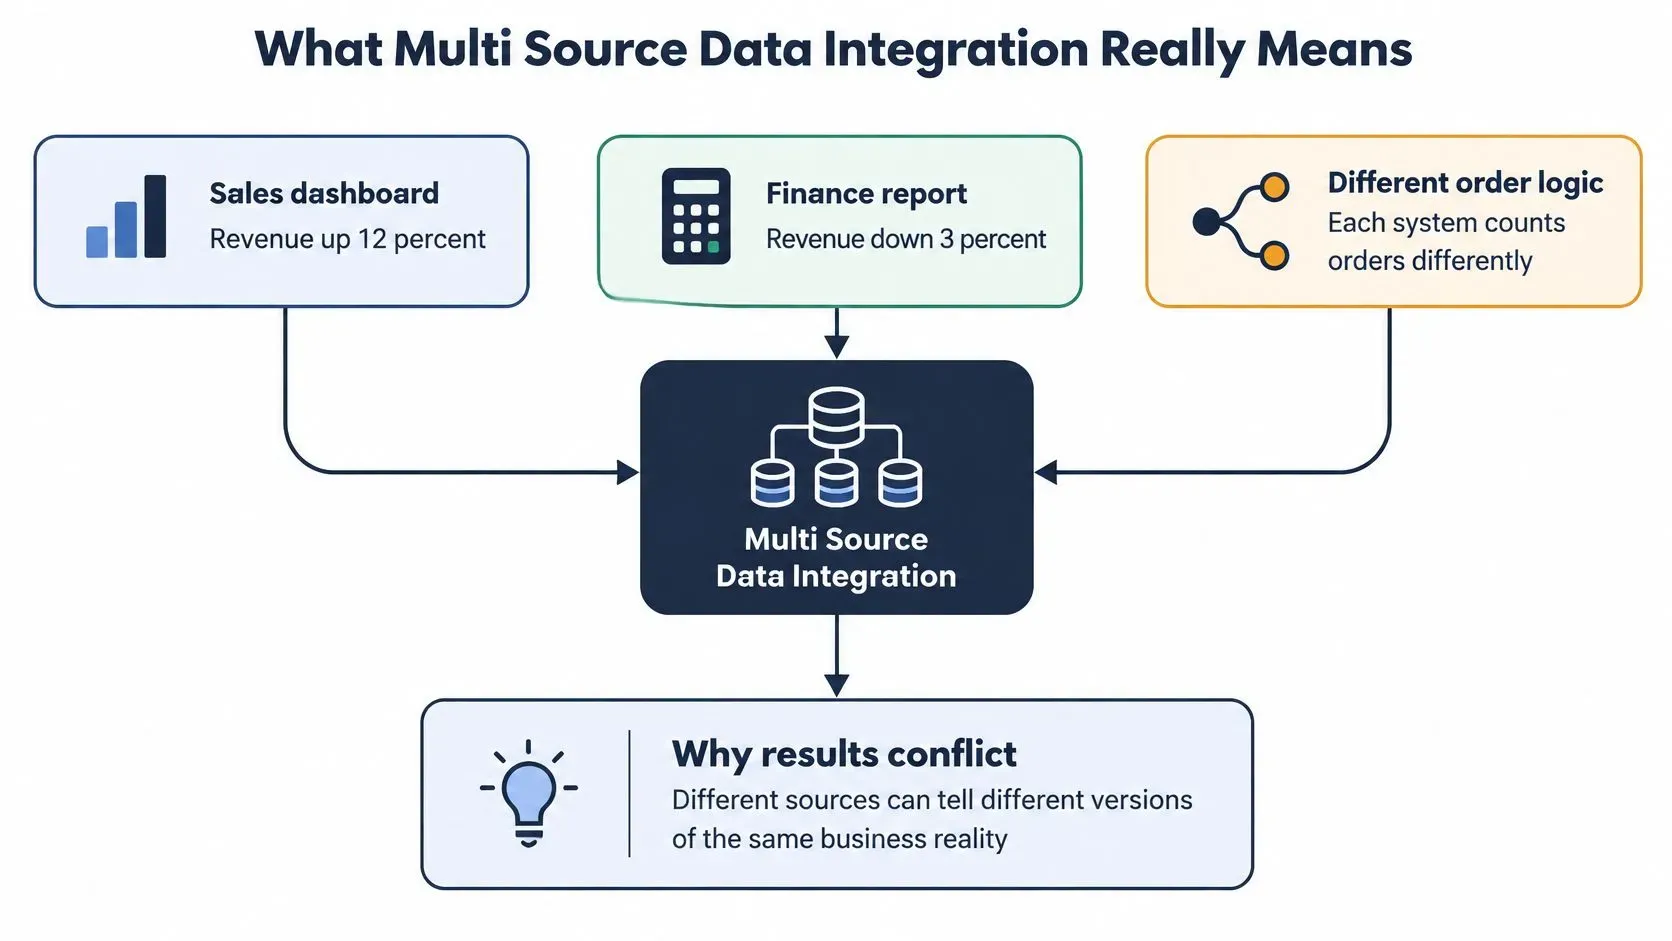
You open the sales dashboard and revenue is up 12 percent. Finance, looking at the same week, shows a 3 percent drop. Nobody changed the books overnight. The storefront counted every placed order. Finance counted cash after refunds and discounts. Both reports are internally consistent, and both are the wrong basis for a reorder if you treat them as the same number.
That clash is what multi source data integration is for. You combine records from several systems, such as an ERP, a CRM, an e-commerce platform, bank feeds, APIs, databases, event streams, and spreadsheets, into one model you can analyze. Moving rows is the easy part. Agreeing what those rows mean is the work.
Think of a kitchen before service. One supplier sends flour by the sack, another sends butter by the block, and a third emails a price list in cases. The recipe only works once everything is weighed in the same units and prepped the same way. Data behaves the same way.
The NIST Big Data Interoperability Framework treats this as more than a transfer problem. Datasets differ in format, scale, meaning, quality, and timing, and translating diverse, large datasets across domains and scales is a major interoperability gap. NIST also warns that the reliability of estimates built from "mashed-up" sources still has to be evaluated. Cross-source checks and an honest read of uncertainty belong in the job, not in a footnote.
Hold every later choice up to four mismatches.
- Format: CSV versus JSON, codes versus names, dates stored as text.
- Meaning: the same field name, a different business rule.
- Quality: duplicates, blanks, and values that cannot be true.
- Timing: one feed from this morning, another from last Tuesday.
Run a three-question audit on the sources you already have. Which system holds the customer identifier? How often does each feed refresh? Who owns each number when the systems disagree?
If card authorizations and payout files sit in that mix, Spell's guide for white-label payment providers is a useful companion. Orchestration rules decide which processor, currency, and settlement path a payment took, and those rules change what "revenue" even is.
The patterns below move the data. Mapping aligns it. Shared metric definitions give it meaning. Quality gates keep bad numbers out of decisions.
Integration Patterns Compared at a Glance
For most SME teams, start with scheduled ELT. Pull raw API, database, and file data into a cloud warehouse on a daily or hourly schedule, then transform it there. Reports change often, and you would rather edit a model than rebuild a pipeline.
Sketch the connectors before you pick a pattern.
- CRM or accounting connector: polls on a schedule. On day one, check the vendor's API rate limits so a full history pull does not get throttled.
- Database connector: reads the change log. On day one, confirm log access permissions, because a read-only reporting user often cannot see them.
- File-watch connector: picks up dropped CSV or Excel exports. On day one, lock the file naming rule so "stock_final_v3" does not overwrite last week's file without a trace.
Pattern | Best for | Typical latency | Main trade-off |
|---|---|---|---|
ETL (transform before loading) | Structured sources that need heavy cleaning before reporting | Hours to daily | Transform logic sits outside the warehouse and is slower to change |
ELT (load raw, transform in the warehouse) | Cloud warehouses with many sources and frequently changing reports | Hourly to daily | Raw copies need storage and governance |
Change data capture streaming | Operational databases where orders or stock change all day | Seconds to minutes | Higher setup complexity and monitoring of source load |
API polling | SaaS tools such as CRM, accounting and ad platforms | Minutes to hourly | Vendor rate limits and schema changes |
Scheduled file drops (CSV, Excel) | Finance exports, supplier price lists and legacy systems | Daily or weekly | Manual errors and no change history unless files are versioned |
Virtualization (query sources in place) | Occasional cross-system questions with low volume | On demand | Slow queries and dependence on source uptime |
ETL cleans before storage. It wins when a source must meet strict format rules before anyone is allowed to query it, such as a bank export that has to pass a fixed layout. The cost is speed of change. A new column means a release outside the warehouse.
ELT loads first and transforms later. It wins when the questions keep moving, which is the normal state of a growing catalogue or a changing chart of accounts. You pay in storage and in the discipline to label raw copies so nobody reports from them by accident.
Change data capture streams inserts and updates from an operational database. Use it when stock or orders move through the day and a missed hour means a stockout you could have seen. A nightly batch will not catch a promotion that sells through by lunch. You take on setup work and you have to watch the load you place on the source.
API polling asks a SaaS tool, on a timer, what changed. It fits CRM, accounting, and ad platforms that will not give you a database log. Respect rate limits, and expect a vendor release to rename a field without warning.
Scheduled file drops still carry finance exports, supplier price lists, and anything trapped in a legacy system. Version every file. Without that, you cannot tell whether Tuesday's total replaced Monday's or merely sat beside it.
Virtualization leaves the data where it is and queries across systems for a one-off question. It is a poor home for a dashboard people open every morning, because a slow or offline source becomes your report's downtime.
Match latency to the decision, not to technical ambition. A weekly board pack does not need streaming.
Practical rule: A three-source SME usually does well with API polling for the CRM and the accounting system, plus scheduled file drops for anything that only arrives as a spreadsheet, refreshed daily into a warehouse where ELT does the shaping.
How to Map Fields and Build a Canonical Model
A connector can deliver every column and still join the wrong customers. Mapping is the step that stops that.
Six steps that keep one meaning per field
- Inventory every source and its key fields. Record the system, the owner, the refresh rate, and the format. You cannot align what you have not listed. The common slip is skipping the spreadsheet "someone maintains," which is often the only place a supplier code lives.
- Choose a canonical model. Keep the entity list small: customer, product, order, location, and date. Give each entity one business key. Extra entities feel thorough until every new source needs a new table and nobody remembers which one reporting uses.
- Map each source field onto a canonical field. Note the transformation in the same row: currency conversion, unit changes, time zone alignment. A bare rename hides the math. "Amount" from the storefront and "amount" from the ledger are not the same column until you say which currency and whether tax is inside the figure.
- Build a crosswalk for identifiers. Match the CRM account ID, the accounting customer code, and the storefront email to one customer key, and write down the rule used for each match. Email is a weak key on its own. Case differences and plus-addressing create duplicate people who are one buyer.
- Set interface contracts. Name each field, its type, its allowed values, and the schema version. A vendor update then fails a test instead of changing what "status" means. Teams skip this because the first load works, then a renamed field flows into forecasts for weeks.
- Load a sample and check it. Compare totals and joins with the source system, and fix mismatches before you load full history. Full history makes a bad join expensive to unwind. A hundred rows will show a missing product key just as clearly.
Watch three slips in particular. Duplicate customers appear when email addresses differ only by case. Dates shift when one system stores UTC and another stores local time without a zone. Units diverge when purchasing counts cases and the storefront sells single units, so inventory looks healthy while the shelf is empty.
Every canonical field should trace back to a named source field and a named transformation.
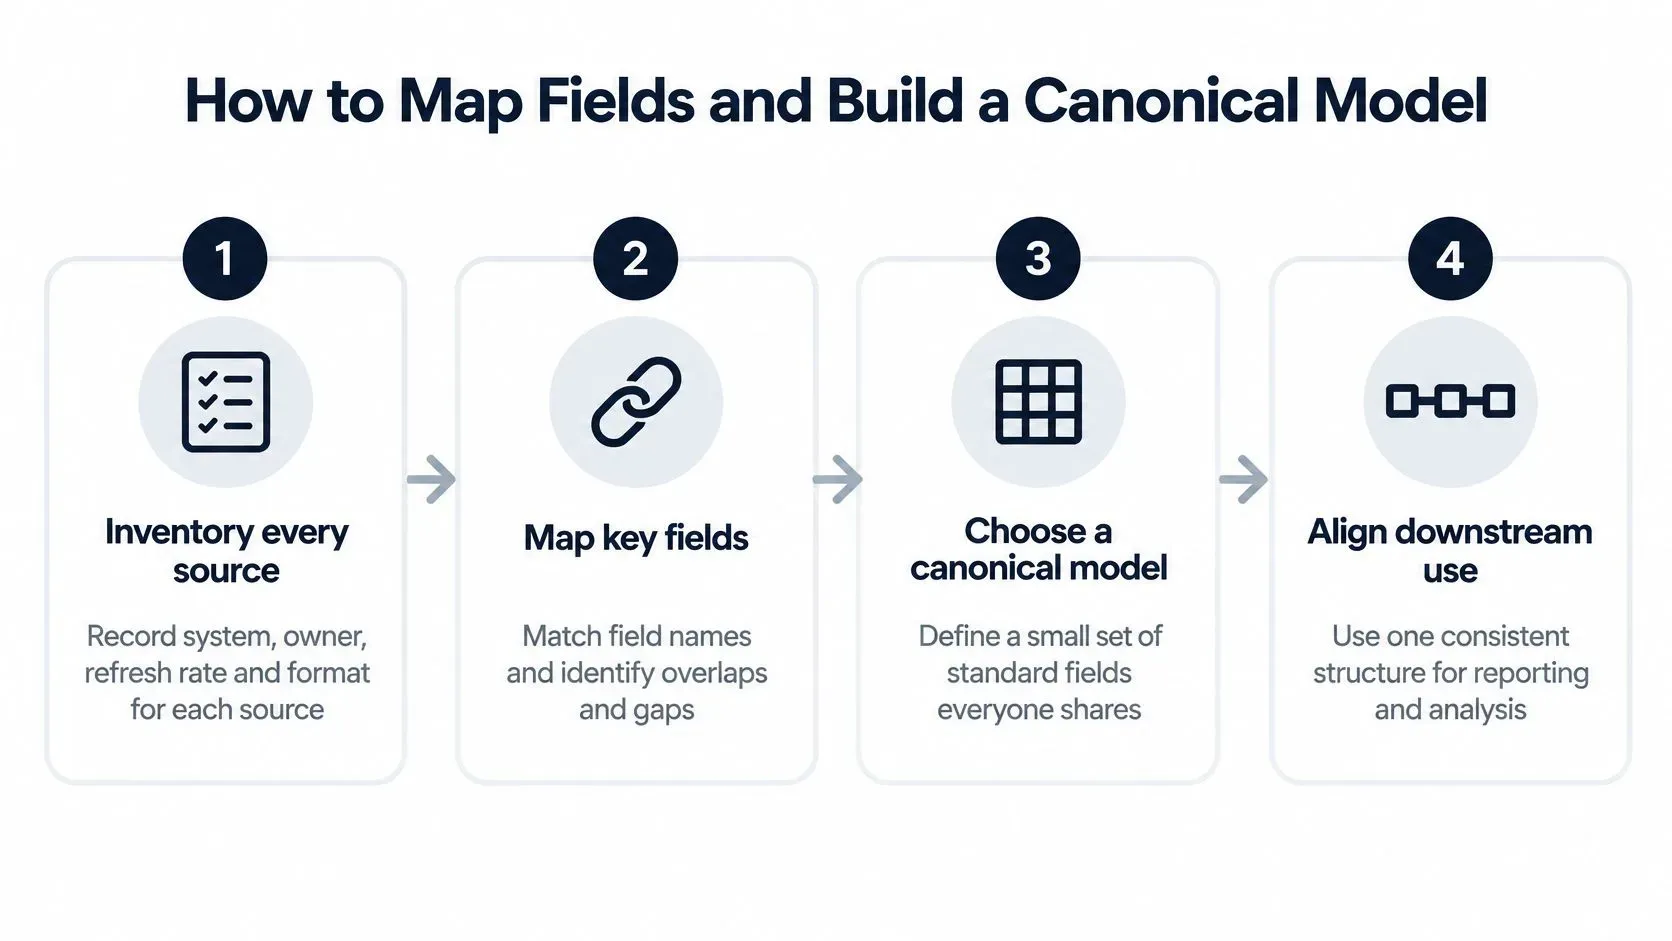
The same habit shows up when you are defining revenue consistently across departments. A shared model is a list of decisions, not a diagram you file and forget.
Agreeing on Shared Metrics Before Connecting Everything
Three labels start most arguments: active customer, net revenue, and inventory available. Each system below already has a definition. None of them asked the others.
Metric | CRM | Finance | E-commerce storefront | Reconciled rule |
|---|---|---|---|---|
Active customer | Any contact with an open deal | Paying customers | Buyers in the last 90 days | One window and one source of truth set by the metric owner |
Net revenue | Deal value before refunds | Gross sales minus refunds and discounts | Gross sales | Refunds count on the refund date and promotional discounts are netted |
Take net revenue. Finance subtracts refunds and discounts. The storefront counts gross sales. The CRM often holds the deal value from the day the opportunity closed, before anyone returned a thing. The first promotion opens a gap that looks like a data bug and is really two formulas.
Who owns the definition when nobody has a data steward title? That question matters more than another connector. Analytics-engineering survey data, cited in a NORC framework report, shows the share of respondents naming integration of various data sources as a top challenge fell from 35% in 2025 to 27% in 2026, while ambiguous data ownership remained a challenge for 41% of respondents. Poor data quality stayed the most frequently reported obstacle. Moving data got easier. Agreeing on it did not.
Better connectors do not produce trustworthy analysis. The bottleneck shifts from pipes to definitions.
A working method you can run this month
- Write one definition per metric. Include the formula, what is included, what is excluded, and the time window. "Net revenue" without a window is not a definition.
- Name a source of truth for each input. Refunds might come only from the ledger. Gross sales might come only from the storefront. Say so in one sentence.
- Name an approver for every change. A renamed discount code should not reach the board pack because a marketing tool updated overnight.
- Route unsettled disagreements into quarantine. Each exception carries a named owner. Leaving it in a chat thread means the dashboard keeps publishing both versions.
A reconciled net revenue rule can be this blunt. Refunds count on the refund date. Promotional discounts are netted. Anything left over becomes an exception with an owner, not a silent plug figure.
SMEs rarely hire a steward. Assign ownership to whoever uses the number most. The operations manager owns inventory available. The finance lead owns revenue. A short monthly review settles disputes before they harden into two dashboards.
If two people can defend two formulas, you do not have a metric yet. You have a meeting.
Quality Gates and Reconciliation Checks That Protect Results
Duplicate keys do the quietest damage. One customer stored three ways inflates active buyers, understates average order value, and sends risk or inventory metrics in the wrong direction. Fix uniqueness before you tune anything else.
Data quality is the bottleneck that shows up before tool choice. A TDWI survey of 672 respondents reported that data-quality issues were the leading inhibitor to successful integration projects, and it pushed teams to profile source stores before implementation. In the same research, an IBM-commissioned Forrester study of 518 global IT, data, and business decision-makers found that 58% identified quality issues as their number-one data challenge. More than half also struggled with integration for both machine-learning and business-intelligence platforms.
Treat the thresholds below as starting points. Tune them per source once you have seen a real week of data.
Check | What it catches | Example threshold | Action on failure |
|---|---|---|---|
Key uniqueness | Duplicate customer or SKU identifiers | Zero duplicates on primary keys | Block publication |
Completeness | Missing values in key fields | 98% or more populated for revenue and dates | Quarantine records and lower the quality score |
Timeliness | Stale or stopped feeds | Source updated within the agreed window, such as 24 hours | Show a freshness warning and hold forecasts |
Referential integrity | Orders pointing to unknown products or customers | Zero orphan rows | Quarantine and open an exception |
Reconciliation to control totals | Totals that differ from the source ledger or system report | Within 0.5% or the agreed tolerance | Block downstream reports |
Validity | Out-of-range values such as negative stock or future invoice dates | Rules set per field | Quarantine and log for review |
What blocks, and what only scores
Block publication when critical-key uniqueness fails or when reconciliation to control totals fails. A dashboard with doubled customers or a total that misses the ledger is worse than no dashboard. Let noncritical fields through with a quality score and lineage attached, so a missing phone number does not freeze the close.
Quarantine is a holding area, not a delete folder. Failing records land there with a reason code. A reviewer releases them or corrects them. Survivorship rules decide which of two conflicting addresses wins, and the losing value stays visible.
ELECTE on data quality checks is a practical companion if you want the monitoring habit written as a routine rather than a one-off cleanse.
Profile each source in week one. Set three critical rules. Add a daily control total for each major source. Put a freshness label on every dashboard so a reader can see what the numbers represent.
A Worked Example Combining Sales, Inventory and Promotions
The figures in this scene are illustrative, not a client result. Say a 40-person online retailer sells through an e-commerce platform, tracks warehouse stock in a spreadsheet, and runs offers in a marketing tool. The promotion team reports a 15 percent lift. Promoted lines still run out three days before the campaign ends. The lift and the empty shelf are telling different stories because the sources were never meant to meet.
An OECD survey of more than 2,000 SMEs across 12 countries found that 61% used at least one AI-enabled application, but 56.6% used AI only for isolated tasks. Only 19% applied it across multiple functions or enterprise-wide, and just 3.6% deployed agentic AI. A separate 2026 small-business survey in that Forbes piece put lack of expertise first among adoption barriers at 32.1%, then unclear ROI at 23.1%, and integration difficulties at 18.4%. The useful question is not whether a tool can connect your data. It is which two sources, joined carefully, pay back before you add a third.
One mismatch, then the fix
Week one, load only sales and stock, once a day, with a SKU crosswalk. Do not touch promotions yet. Week two, compare units sold with warehouse outflow. If those two agree, the keys are trustworthy enough to invite a third source.
Week three, add the promotion feed. The mismatch appears immediately. The marketing tool records bundle codes. The storefront sells single SKUs. A "bundle lift" counts one promo code as if it were one product, so the campaign looks stronger than the components that left the building.
Three fixes close the gap.
- Bundle mapping table: split each bundle into component SKUs before you measure lift.
- Stock freshness flag: show whether the spreadsheet landed today or three days ago.
- Weekly control total: compare units sold with warehouse outflow, and hold the promo report if they diverge.
Track stockout days per promoted SKU, forecast error on promoted lines, hours spent on the monthly report, and days needed to resolve exceptions. Those four tell you the workflow is working. A prettier dashboard does not.
A buyer still approves reorders above a set quantity. Keep the prior model version so a schema change in the marketing tool can be rolled back instead of rewritten under pressure. Connect only the fields this workflow needs, and keep customer emails out of the shared promo view.
Staged joins pay back faster than connecting every system at once, because each new source arrives against a total you already trust. More practical integration tactics for SMEs follow the same pattern: one decision, two sources, a check you can explain.

Key Takeaways and Your First Workflow
A combined figure can look precise and still be wrong if its sources use different definitions or refresh at different times. Start with one decision the team needs to make, then build a small workflow around a number people already question.
- Choose two sources where a disagreement costs time, such as sales and stock.
- Define one shared metric by recording its formula, inclusions, and time window.
- Set a quality rule and control total. Hold the report if the rule fails.
- Run the workflow for 30 days. Compare stockout days or reporting hours with your baseline.
- Add a third source after the first workflow is stable.
Connect only the fields that workflow needs. Before linking a source, confirm who owns the data and who may access it. Mask personal identifiers, such as customer emails, in shared reports.
ELECTE can support an initial workflow: link accounts and data sources or upload an Excel file, without an integration project or technical setup. Most users are operational in under five minutes, with AI analysis and first forecasts available after connecting accounting software or uploading a file. The sensible next step is to connect your own files and check one figure you already argue about.
Connectors bring records together; they do not settle what a metric means, which source owns it, or whether the totals reconcile. Agree on those decisions first, then use quality checks to decide whether a combined number is safe for a reorder, forecast, or board pack.
ELECTE connects accounting, banking, and spreadsheet data in a central dashboard that stays current without exports, with the full balance sheet projected forward. To begin, choose two sources and one metric the team disputes.
Comments
No comments yet — start the conversation.