Sales Forecast Meaning: What It Tells Your Business
Sales forecast meaning explained in plain terms: what a forecast estimates, how to read its range, and how it differs from sales targets.

A sales forecast is a structured estimate of the sales a business expects over a defined future period, built from past sales, market information and customer intentions, and stated with its assumptions.
If someone hands you a revenue prediction without explaining what could change it, do you have enough information to place an order or hire another employee? Usually, you need more than the headline figure. You need to know which outcomes are plausible, what the estimate assumes and which decisions you can safely make before customers buy.
That's the practical value behind sales forecast meaning. For an SME, a forecast should connect customer demand to purchasing, staffing and cash planning, without pretending uncertainty has disappeared.
You don't need to become a statistician to use one well. You need to distinguish expectations from targets, understand the main sources of error and keep a record of what you predicted before the results arrived. With those habits, forecasting becomes a repeatable management practice rather than a number prepared for a meeting.
What a Sales Forecast Means in Plain Terms
A sales forecast estimates the quantity or revenue you expect to sell during a specified stretch of time. That stretch is the period. The horizon describes how far ahead you're looking, such as an upcoming quarter rather than the following year.
Think of a weather forecast. It helps you prepare for likely conditions and uncertainty, but it doesn't promise exactly what will happen at a particular moment. Your sales forecast should support the same kind of preparation.
Say you manage an outdoor-furniture shop. Past transactions show when customers usually buy, market information helps you assess current conditions, and customer inquiries provide clues about purchase intentions. You can combine those inputs rather than relying on last season's sales alone.
The number and the reasoning behind it
A forecast has two layers of meaning:
- The expected result: The units or revenue you anticipate for the stated period.
- The supporting reasoning: The information, method and assumptions that make the estimate credible.
Buyer intentions can add useful information, although their value depends on the setting. In an academic comparison of forecasting methods, the strongest method incorporating purchase intentions reduced average forecast errors by approximately one-third relative to the benchmark. That finding supports considering customer signals, not assuming that any survey will automatically improve your forecast.
For your shop, the useful question isn't just how much you might sell. It's what you should do before those sales happen. Purchasing needs an order plan, store managers need staffing coverage, and finance needs to anticipate when supplier payments could arrive before customer receipts.
Promotions also need a realistic demand expectation. Otherwise, you might advertise products you can't supply or buy stock for a campaign that hasn't been approved.
A sales forecast is a structured estimate of future sales, not a guess and not a guarantee.
That distinction keeps the estimate useful even when the eventual result differs.
The Three Parts Every Forecast Communicates
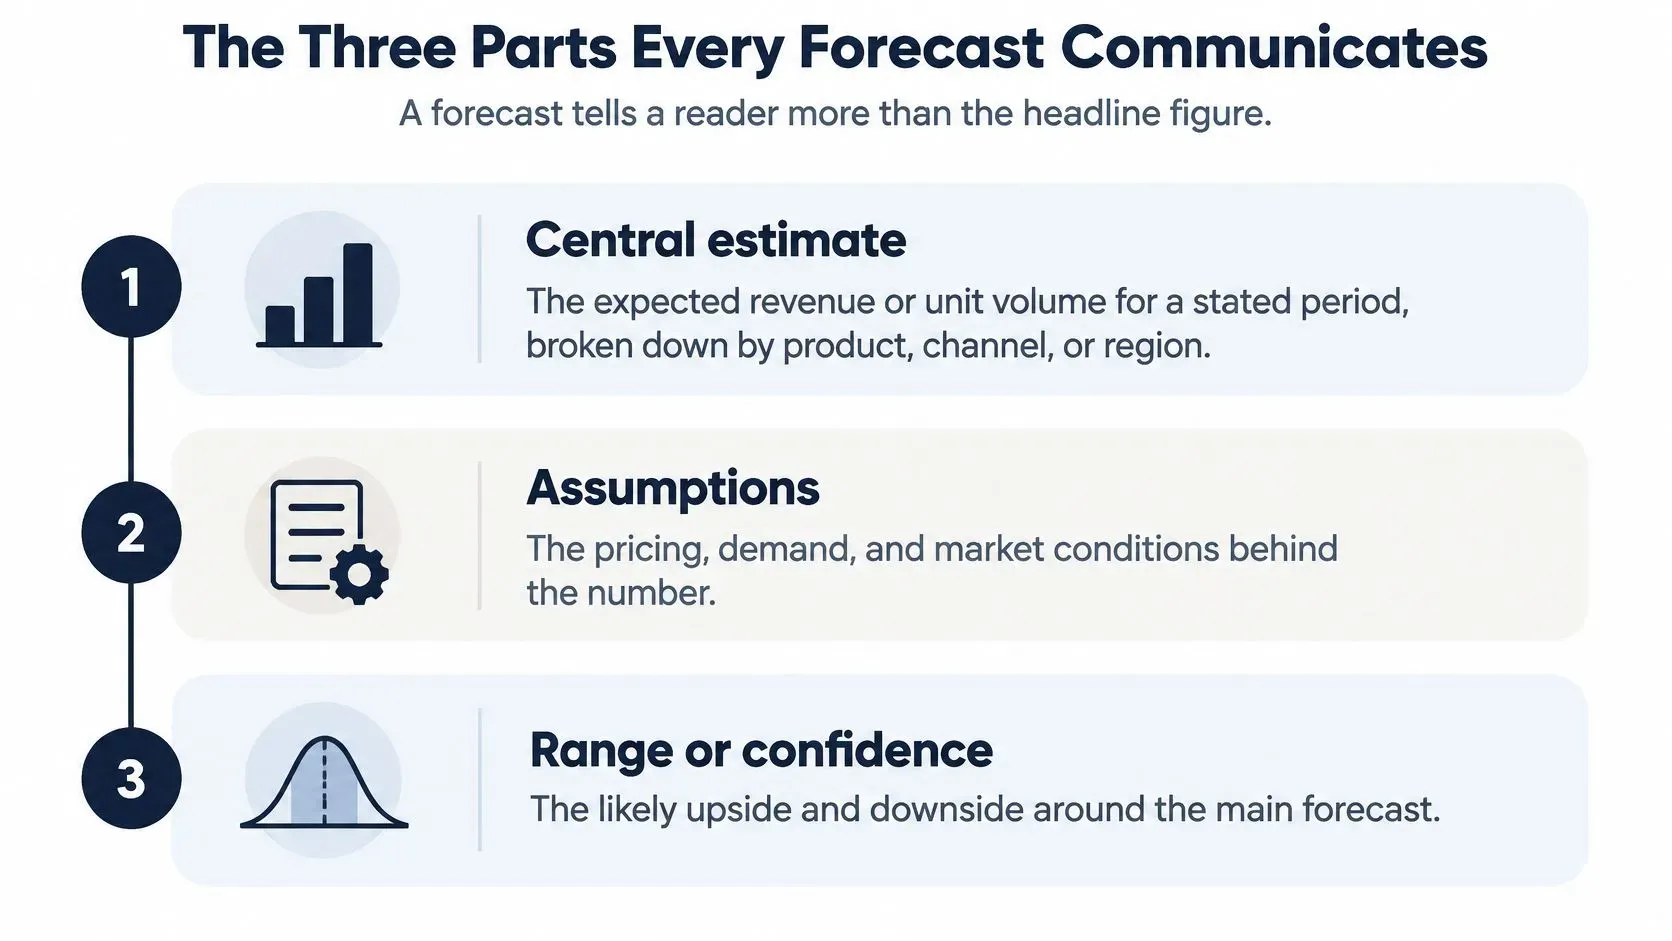
A usable forecast communicates a central estimate, a range and assumptions. Each answers a different management question.
- Central estimate: What revenue or unit volume do you expect during the stated period? Break it down by product, channel or region wherever those distinctions affect decisions.
- Range: How much could outcomes differ? Use downside and optimistic scenarios, or a prediction interval calculated by the forecasting method.
- Assumptions: What must remain true? Identify pricing, promotions, staffing capacity, seasonality and relevant market conditions.
For a hypothetical planning statement, you might write: expected sales of 1,200 units next quarter, with a scenario range of 900 to 1,400, assuming one promotion in month two. The central value supports routine planning, the downside informs cash protection, and the upside helps you negotiate additional supply.
A scenario range isn't automatically a statistical prediction interval. Scenarios describe outcomes under different assumptions; an interval expresses uncertainty under a defined model. Don't attach a confidence label unless your method supports it.
Match uncertainty to the decision
The Federal Reserve Bank of Atlanta's October 2025 Survey of Business Uncertainty report, drawing on roughly 1,500 U.S. business executives, reported greater uncertainty about future revenue growth than before the pandemic. Managers therefore need a way to act even when their expectations remain uncertain.
Inventory managers may prepare for an upper outcome when shortages are costly. Finance may budget around the central estimate while preserving a downside reserve. Marketing should release spending according to the assumptions behind expected demand.
Accuracy measures also have limits, as published forecasting guidance in Foresight explains. Ask for the period, range and assumptions before treating a headline figure as a commitment.
How a Sales Forecast Differs From Targets and Quotas
Teams often use forecast, target and quota interchangeably. That creates confusion because they answer different questions: what's likely, what's desirable and what someone is accountable for delivering.
Sales forecast compared with related sales metrics
Metric | Question it answers | Built from | Usually owned by |
|---|---|---|---|
Sales forecast | How much will we likely sell in a future period? | Historical sales, market information and customer intentions | Finance and sales operations |
Sales target | How much do we want to sell? | Strategy and growth ambition | Leadership team |
Sales quota | How much must each rep or territory sell? | Target split across people or territories | Sales managers |
Sales budget | How much can we spend to reach planned sales? | Forecast plus cost plans | Finance |
Pipeline value | How much open business is in deals right now? | Open opportunities weighted by stage | Sales reps |
Run rate | What does the current pace imply if it continues? | Recent period revenue projected forward | Finance analysts |
The table uses pipeline value in its stage-weighted sense. If your CRM shows unweighted pipeline instead, that total includes the full value of open opportunities, not just their probability-adjusted contribution.
Likewise, a sales budget can include planned sales revenue as well as spending. Define how your business uses the term so finance and sales aren't comparing different measures.
Keep ambition separate from expectation
A forecast is your honest expectation of what will happen. A target expresses what leadership wants to happen. Neither replaces the other.
Suppose your expected sales fall short of your growth target. You haven't necessarily built a poor forecast. You've identified a planning gap that requires action, such as improving conversion, expanding distribution or changing the offer.
Quotas allocate a target across representatives or territories. When quotas exceed expected sales, managers should explain the additional actions and resources required instead of raising the forecast to match.
Practical rule: Keep the forecast unbiased, set targets separately and use the gap to decide what needs to change.
A run rate also needs care. Projecting the current pace forward can provide a quick reference, but it won't automatically account for seasonal demand or a promotion ending. An opportunity total needs similar interpretation because deals can slip beyond the forecast period.
Compare forecasts and targets each month. Discuss which actions could close the gap, who owns them and when their effects should become visible. Don't make the forecast owner responsible for hiding an inconvenient expectation.
How Forecasts Are Built From History and Buyer Signals
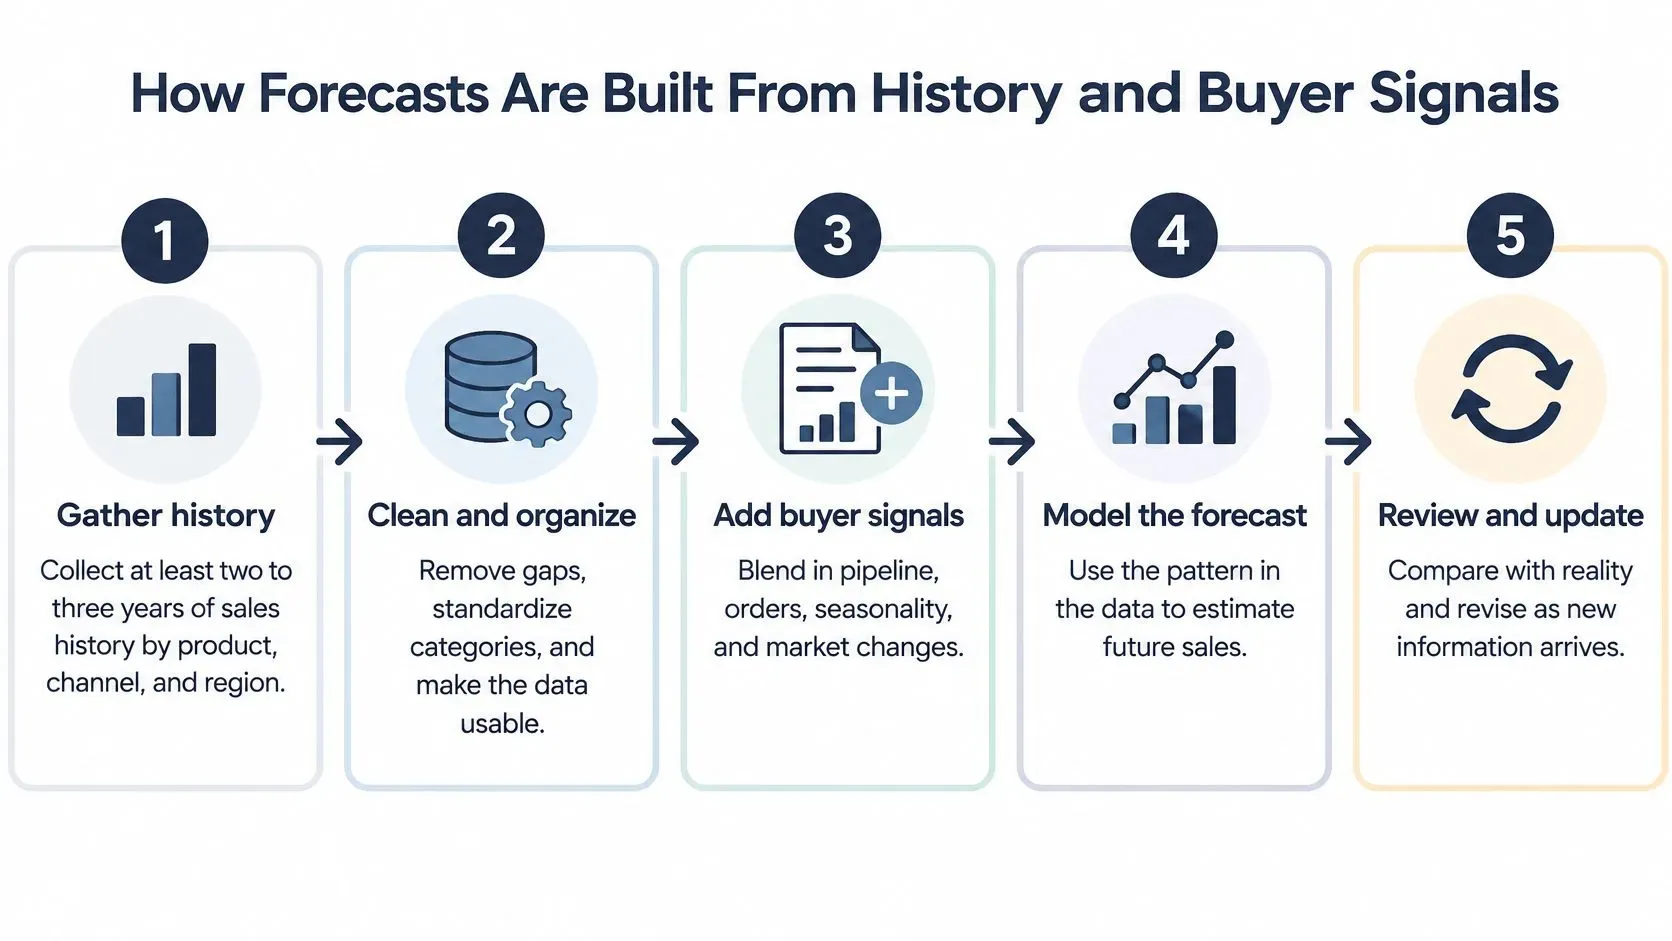
Build the forecast in an order that makes errors easier to trace. Start with consistent records, then add business context, test methods and publish a version people can review.
- Gather history by product, channel and region. Aim for two to three years where available, as a practical starting point for examining repeated seasonal patterns rather than a universal minimum. If your business is newer, use the available history and make the resulting limitations explicit.
- Flag exceptional events. Mark stock shortages, lost customers and one-time bulk orders so the model doesn't treat them as ordinary recurring demand. Standardize product categories and distinguish missing records from genuine zero sales.
- Add known drivers and buyer signals. Include seasonality, approved price changes, promotions, orders and new distribution. For business-to-business sales, inspect expected deal timing rather than counting every open opportunity as imminent revenue.
- Choose methods and test a simple baseline. Trend extrapolation may suit steady products, pipeline weighting may suit deal-driven sales, and buyer-intention surveys may help when product history is limited. A field study covering 13 manufacturing firms found organizational judgmental forecasts weren't consistently more accurate than a straightforward naive forecast.
- Publish the estimate with accountability. Include its range, assumptions and a named owner. Preserve the version used for operational decisions so later revisions don't erase the original prediction.
Test on information available at the time
Use rolling-origin validation: repeatedly forecast from an earlier cutoff, then compare the prediction with the subsequent actual result. Don't let information from the evaluation period leak into model building.
For intermittent demand, where products have many zero-sales periods, consider Croston-type methods that separately estimate order size and the interval between purchases. Evaluate results by product, channel, geography and horizon because an accurate total can conceal poor item-level estimates.
For a small-team perspective, consult Grou's guide to sales forecasting. To put the workflow into practice, follow the steps to build a forecast for your sales.
Keep customer information access-controlled, remove unnecessary identifiers and use only data you're authorized to process.
Why Forecasts Miss and How to Read the Error
Every sales forecast carries measurable error. The important distinction is between variation you couldn't predict reliably and a repeated tendency to estimate too high or too low.
Random error moves in different directions across periods. Bias has a persistent direction. A business that repeatedly overforecasts may commit too much cash to stock, even if its average percentage error looks acceptable.
In an Austrian pharmaceutical reimbursement study, forecast sales exceeded actual sales by 33% at the median, with forecast-to-actual ratios ranging from 0.15 to 37.5; 55.9% of products either overestimated actual sales by more than 100% or underestimated them by more than 50%. Those results describe that particular market, not an accuracy benchmark for retailers.
Read accuracy measures together
Forecast accuracy metrics and what they reveal
Metric | What it shows | Use it when | Main limitation |
|---|---|---|---|
Mean absolute error (MAE) | Average size of the miss in units or currency | You need a plain average error for one product | Hard to compare across products of very different scale |
Root mean squared error (RMSE) | Average miss with large misses weighted more heavily | Big misses are costly, such as stockouts | Sensitive to a few extreme outliers |
Mean absolute percentage error (MAPE) | Miss expressed as a share of actual sales | You compare accuracy across products of different size | Unstable near zero actual sales and treats over- and underforecasting asymmetrically |
Bias | Whether forecasts run consistently high or low | You check for systematic over- or underforecasting | Doesn't describe random error; using forecast minus actual, positive means overforecasting and negative means underforecasting |
Start with bias to identify direction, then use MAE to understand the typical miss. Add RMSE when an unusually large shortage or surplus matters disproportionately. Treat MAPE cautiously for low-volume products, and don't calculate ordinary percentage errors where actual sales are zero.
Forecast misses aren't unusual. In Xactly's 2024 Sales Forecasting Benchmark Report, based on a survey of 405 North American professionals, 4 in 5 sales and finance leaders reported missing a quarterly sales forecast during the previous year. CFO's coverage of the survey reported that 43% said their forecasts were usually at least 10% inaccurate.
Report error by product, channel and forecast horizon rather than publishing only a company-wide score. Opposing misses can cancel in the total while purchasing teams still face shortages and excess inventory.
A Worked Example of a Forecast Driving Decisions
Consider a hypothetical outdoor-furniture shop preparing for next quarter. Its central forecast is 1,200 units, with a scenario range of 900 to 1,400 units.
The base case assumes one promotion in month two. The downside assumes a late spring and weaker demand, while the upside assumes a successful social campaign. These are illustrative planning assumptions, not observed business results.

From expected demand to commitments
The manager commits purchase orders for 1,000 units, accepting some downside exposure while avoiding an immediate purchase for the entire upside. The manager also negotiates an option for 300 additional units, subject to supplier lead times.
That arrangement provides access to 1,300 units, not the full 1,400-unit upside. The manager must therefore identify whether existing stock, another replenishment opportunity or an alternative supplier can cover the remaining 100 units. A range is useful only if you check that your operational plan can support it.
Forecast range and the decisions it supports
Scenario | Decision |
|---|---|
Downside of 900 units, late spring and weaker demand | Size the cash reserve so unsold stock doesn't strain payments |
Base case of 1,200 units, one promotion in month two | Commit 1,000 units initially and tie marketing spending to the planned promotion |
Upside of 1,400 units, successful social campaign | Hold an option for 300 more units and arrange coverage for the remaining supply gap |
Actual result of 1,050 units after the quarter | Compare with the forecast and check whether bias ran in one direction across periods |
The cash reserve should reflect supplier payment dates and the cost of holding stock, not merely the revenue forecast. The promotion budget remains conditional on campaign approval and product availability. Teams comparing alternative assumptions can explore what-if analysis best practices.
Check the result without rewriting history
After the quarter, actual sales total 1,050 units, leaving the central forecast 150 units too high. That's a positive forecast error under the forecast-minus-actual convention, but a single result doesn't establish persistent bias.
The manager checks campaign timing, weather assumptions and product availability before changing the next forecast. The forecast did its job by clarifying what to commit, what to hold in reserve and what to watch.
Misconceptions That Make Forecasts Less Useful
Better forecasting doesn't always require a larger dataset or a more complex model. Sometimes you need clearer definitions, different incentives or a more honest treatment of uncertainty.
- More data always improves accuracy. In a 2025 NBER study using incentivized forecasts from more than 6,000 firms, enhanced data use and financial incentives produced only modest contemporaneous improvements, while predictable errors, bias and over-precision were particularly pronounced among smaller firms. Improve the relevance and consistency of inputs rather than collecting more information indiscriminately.
- A complex model is automatically better. Require evidence that added complexity improves performance against a naive baseline on unseen periods. If it doesn't, use the simpler method until you can explain the difference.
- A single number is precise. A detailed-looking estimate can still rest on fragile assumptions. Give decision-makers the plausible range and the conditions that would move demand toward either end.
Human incentives affect the estimate
Sandbagging means deliberately understating expectations to make performance easier to beat. Optimism creates the opposite problem, while pressure to meet targets can encourage people to report ambitions as predictions.
Anchoring on an old plan can also stop managers from recognizing changed conditions. Inconsistent definitions introduce another avoidable error: a sales representative may forecast signed contracts while finance expects recognized revenue and operations expects shipped units.
Preserve what you knew when you made the forecast, not just the latest number.
Record the sales definition, assumptions and reasons for judgmental adjustments. Keep forecast versions so reviewers can distinguish a model's original prediction from a manager's later intervention.
AI-assisted analytics can reduce repetitive calculation and expose patterns, but it doesn't remove the need for governance. People still need to approve assumptions, challenge unsupported adjustments and inspect accuracy after the period ends.
Start Comparing Forecasts With Actual Sales
- Write the forecast before the period starts. Record its period, central value, range and assumptions. Use a consistent definition of sales so the eventual comparison measures the same thing.
- Date and version it. Save the forecast used for purchasing, staffing or budgeting, then preserve later updates separately. That keeps the original decision context visible.
- Compare actual sales after each month. Calculate bias and MAE for your main products using matching periods and units. Investigate misses large enough to change an operational decision rather than reacting equally to every fluctuation.
- Adjust where the evidence warrants it. Revise assumptions that proved wrong and investigate repeated directional errors. Note why you changed the forecast, and avoid redesigning the model merely because of an isolated miss.
Key Takeaways
Treat those steps as a monthly operating routine: document, preserve, compare and adjust. A forecast checked regularly becomes a learning tool; one that's never checked remains an unsupported expectation.
ELECTE, an AI-powered data analytics platform for SMEs, can build financial forecasts and sales forecasts, with visual dashboards for forecasts, cash flow and trends, plus one-click report exports or team sharing. It's an option for teams seeking forecasts and monthly reporting from their own data, but it doesn't replace management review.
When you find forecasting software for your team, prioritize a process you can maintain and explain. Forecasts remain estimates, not guaranteed results, and cash-planning examples are educational rather than individualized financial advice.
ELECTE offers forecasting, dashboards and reporting to help you turn sales expectations into a reviewable business plan. Visit ELECTE to see how the platform could support your forecast-versus-actual routine.
Comments
No comments yet — start the conversation.