Inventory Management Logistics: A Practical Guide for SMEs
Master inventory management logistics: metrics, replenishment, warehouse basics and analytics. See how ELECTE turns stock data into decisions.

Only 26% of surveyed warehouse and distribution-center organizations had automated inventory-accuracy measurement in 2024, while 61% planned to automate it within two years, according to Peerless Research Group's Warehouse/DC Outlook Survey. That gap captures a familiar problem: teams want better inventory decisions, but many still have to establish what's on the shelf.
For SMEs, stock is cash in physical form. You've paid for it, but you can't use that money elsewhere until the goods sell. Meanwhile, someone must store, handle, protect, count, and sometimes repair or dispose of them.
Inventory management logistics connects those financial consequences with everyday warehouse decisions. It helps you decide what to buy, where to hold it, when to replenish it, and what you can promise customers.
You don't need an elaborate planning department to improve those decisions. You need reliable records, a few useful measures, and clear rules your team can apply. The practical starting point is to treat every purchasing decision as both a service commitment and a claim on your cash.
Why Inventory Decisions Cost More Than the Purchase Price
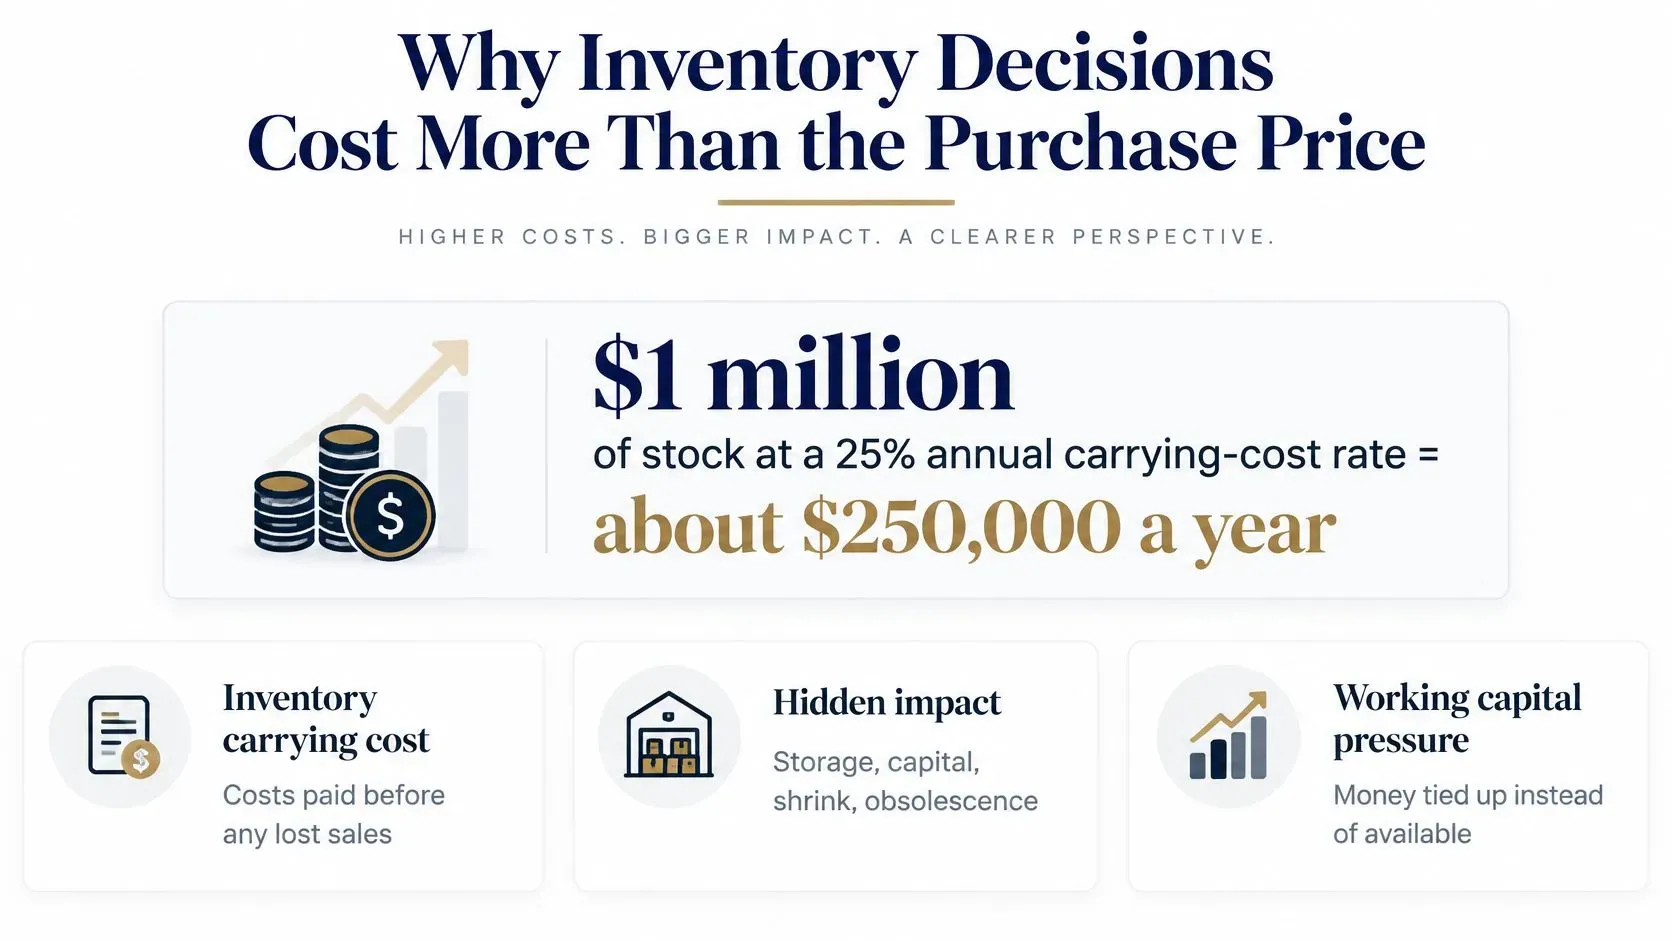
A company holding $1 million of stock at a 25% annual carrying-cost rate incurs about $250,000 a year, before lost sales; the inventory-cost literature hosted by Iowa State University reports estimates ranging from approximately 12% to 43% annually, with commonly cited estimates around 20% to 40%. These aren't universal benchmarks. They illustrate why purchase price alone can't tell you whether a buying decision makes financial sense.
Inventory management logistics means getting the right goods to the right place at the right time while controlling the cash tied up between purchase and sale. Think of your warehouse as a vault of physical cash, except its contents can expire, break, or become unfashionable.
Follow the stock and the spending
Your team manages connected flows, each with its own costs:
- Inbound from suppliers: Freight, receiving, inspection, and putaway turn a supplier shipment into usable stock.
- Storage: Space, equipment, counting, and protection keep goods available while they wait.
- Outbound to customers: Picking, packing, and dispatch turn stored goods into fulfilled orders.
Carrying cost includes the opportunity cost of capital, warehousing, insurance, taxes, handling, shrinkage, obsolescence, deterioration, and damage. Opportunity cost means the return or operational benefit you give up by committing money to stock rather than another use.
The infographic brings these costs together.
Compare the discount with the holding burden
Say a supplier offers a bulk discount on seasonal packaging. The unit price improves, but the extra cartons occupy space after the season ends. Your buyer should compare the purchasing saving with storage, handling, financing, and possible write-off costs.
Rates differ because borrowing costs, warehouse expenses, product life cycles, and insurance differ. Durable replacement fittings don't carry the same obsolescence exposure as trend-sensitive merchandise.
For operational ideas, Material Handling USA's discussion of ways to reduce warehouse labor costs is a useful companion to a handling-cost review. For the broader financial connection, consult the ELECTE guide on operating capital.
A lower purchase price isn't a saving if the extra stock costs more to hold than the discount is worth.
Balance availability against committed cash, rather than trying to minimize either inventory or stockouts in isolation.
Key Metrics to Track and Their Reference Points
These core inventory metrics connect warehouse activity to decisions about purchasing, customer service, and cash.
Core inventory metrics, formulas and reference points
Metric | What It Tells You | How to Calculate It | Reference Point |
|---|---|---|---|
Inventory turnover | How many times stock sells through annually | Annual cost of goods sold ÷ average inventory value | 6.5 turns average among surveyed warehouse and DC professionals in 2024, according to Peerless Research Group's Warehouse/DC Operations Survey |
Days of inventory on hand | How long stock covers demand | On-hand units ÷ average daily unit demand | Match coverage to replenishment time and the chosen buffer |
Inventory carrying cost rate | Annual holding burden relative to stock value | Annual holding costs ÷ average inventory value, expressed as a percentage | Use your finance-approved cost categories, not a universal target |
Inventory accuracy | Whether physical counts match records | Matching SKU-location counts ÷ total SKU-location counts, expressed as a percentage | Set tighter tolerances for service-critical items |
Fill rate | Share of ordered units shipped on time from stock | Units shipped on time from stock ÷ units ordered, expressed as a percentage | Set a target by customer promise and product criticality |
Stockout rate | How often demand encounters unavailable stock | Stockout events ÷ total demand events, expressed as a percentage | Investigate recurring shortages on priority products |
Forecast error, or MAPE | Average percentage gap between forecast and actual demand | Average absolute difference between actual and forecast, divided by actual demand, expressed as a percentage | Compare methods on the same products and periods; exclude or separately handle zero-demand periods |
Read the measures together
Turnover isn't a score to maximize. Low turnover on a discontinued accessory may justify clearance or a purchasing freeze. High turnover on an essential component may mean efficient purchasing, or it may mean your team repeatedly runs too close to empty.
Use cost of goods sold, not sales revenue, when calculating financial turnover. Otherwise, you mix selling prices with inventory recorded at cost and distort the result.
Days on hand adds practical context. A product with lengthy supplier replenishment needs different coverage from an item available locally. Calculate it by SKU, meaning an individually tracked product or variant, before averaging across the business.
Separate service problems from forecast problems
A weak fill rate tells you customers aren't receiving enough ordered units on time from stock. It doesn't identify the cause. Check whether the shortage came from inaccurate records, late supply, purchasing decisions, or unexpected demand.
MAPE also needs care: it becomes undefined when actual demand is zero and unstable when actual demand is very small. For intermittent spare parts, examine absolute unit error and missed-demand events alongside percentage error.
Vendmoore Enterprises' guide to vending inventory KPIs that matter provides a useful setting for understanding why product availability and replenishment performance belong together.
Practical rule: Track no more than five headline metrics at once, review them weekly, and assign each a named owner.
The owner should arrive with a decision, such as reducing an order, investigating a discrepancy, or changing a supplier delivery schedule.
Replenishment Strategies and When Each One Fits
Replenishment methods compared
Method | Order Trigger | Best Fit | Main Risk |
|---|---|---|---|
Reorder point | Stock position falls to a set level | Steady, high-value SKUs | Relies on accurate stock records |
Fixed order quantity, often informed by EOQ | Stock reaches its reorder point; order a set quantity | Stable demand with predictable ordering costs | Assumes demand stays close to constant |
Periodic review, or order-up-to | Review on a fixed schedule and order up to a target | Suppliers with set delivery days and grouped orders | Requires protection through the review interval and delivery lead time |
Min-max | Stock falls below the minimum; order up to the maximum | Low-cost, routine C items | An excessive maximum creates oversized orders |
Just-in-time | Schedule delivery to arrive as needed | Predictable demand and highly reliable suppliers | A late delivery can halt production or sales |
Continuous review checks stock position after each recorded movement. Periodic review checks it on a schedule. Neither method works reliably if receipts, allocations, and transfers aren't recorded.
Reorder point and order quantity answer different questions. The first tells you when to order; the second tells you how much. Economic order quantity, or EOQ, is a calculation that balances ordering and holding costs under simplifying assumptions.
Stop orders from exaggerating demand
The bullwhip effect occurs when upstream orders fluctuate more than customer demand; a manufacturer-to-retailer demand-variance ratio above 1 indicates amplification, as described in the production-economics study on seasonal demand and replenishment lead times.
Forecast updates, order batching, price fluctuations, and shortage-driven rationing can all contribute. A retailer places an unusually large order to protect against a shortage, and the supplier interprets that order as lasting demand growth.
Your team can reduce this distortion:
- Order smaller batches where economical: Compare the extra ordering or freight expense with the inventory exposure.
- Share consumption information: Give suppliers actual sales or usage alongside purchase orders.
- Flag promotions separately: Explain temporary demand changes instead of letting suppliers treat them as the new baseline.
Understanding how promotions distort sales forecasts helps buyers avoid replenishing a temporary sales spike indefinitely.
Match the policy to the consequence of failure
For production spares, consider alternatives to holding every possible component. American Additive Manufacturing's explanation of how to reduce downtime with printed replacement components offers another option to assess, subject to material, quality, and engineering approval.
Start with reorder points for high-value, steady-demand products. Use min-max or periodic review for routine low-value items, especially when buyers can consolidate deliveries.
Bulky goods need an extra check: their maximum stock level must fit the available space. A convenient purchasing schedule isn't useful if the resulting order blocks receiving or dispatch.
How to Calculate Reorder Points and Safety Stock
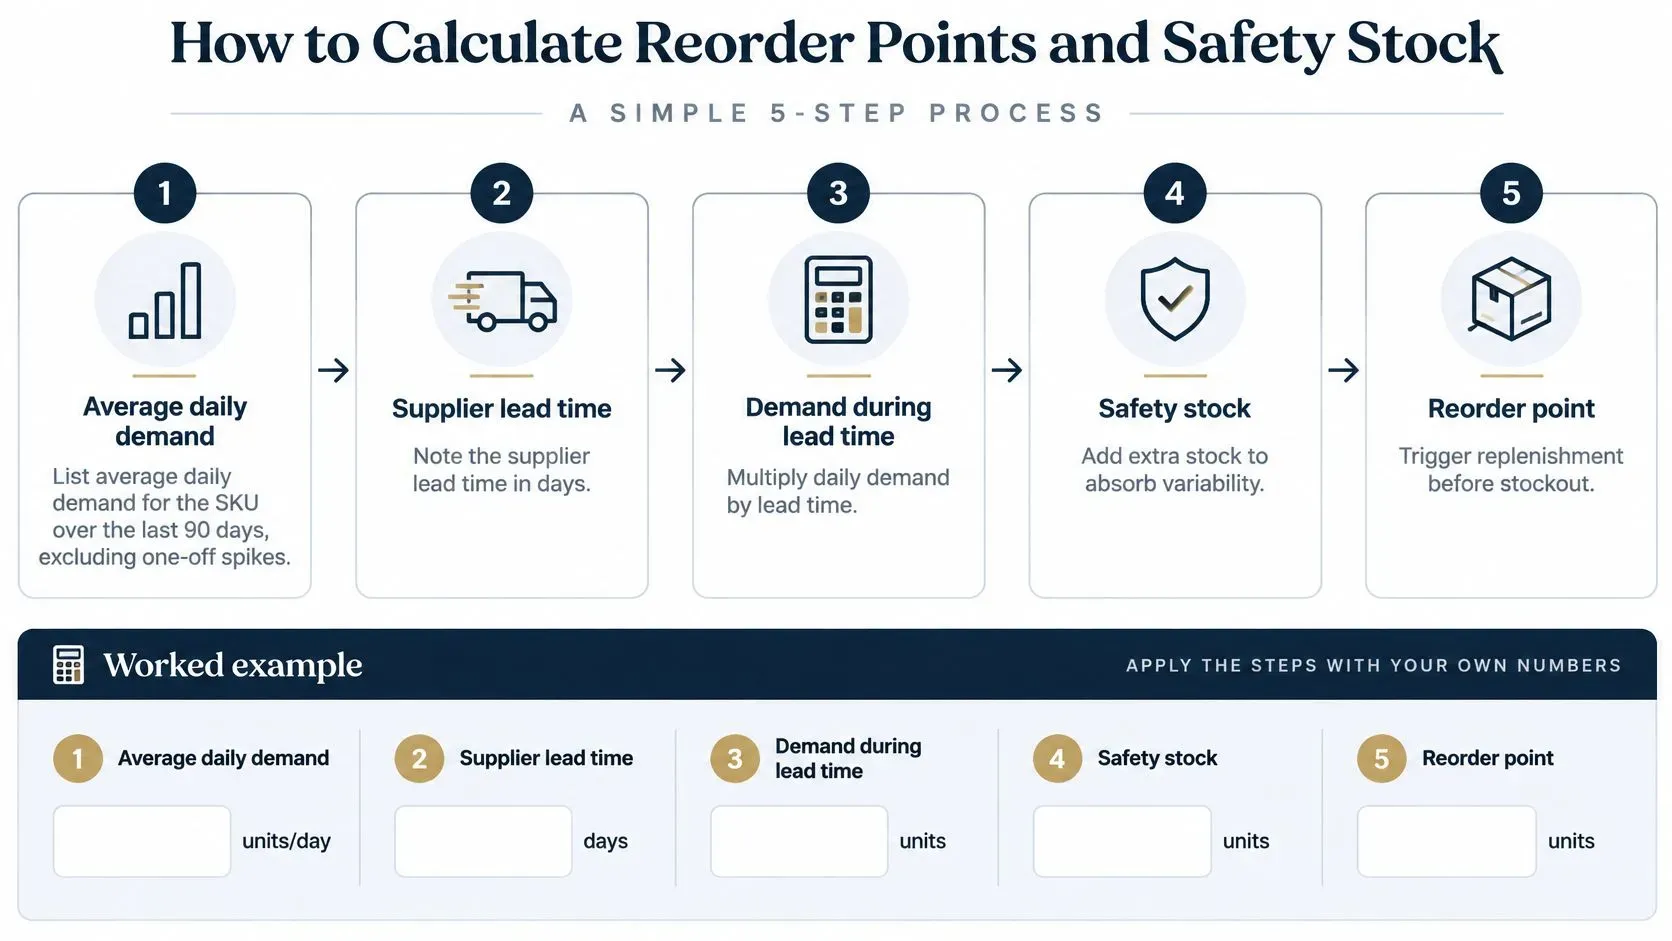
- Establish average daily demand. Use a representative history, such as the last 90 days in a hypothetical setup. Separate genuine recurring demand from exceptional orders and annotated promotions.
- Measure actual supplier lead time. Record the time from order release until stock is usable, not merely until the truck arrives.
- Calculate lead-time demand. Multiply average daily demand by replenishment lead time using consistent calendar or working-day units.
- Choose safety stock. Add a buffer for demand and delivery uncertainty. A fixed coverage buffer is a practical starting point when history is limited.
- Calculate the reorder point. Add lead-time demand and safety stock.
- Test the financial trade-off. Compare the buffer's holding burden with the likely consequences of a shortage.
Work through a fast-moving product
For a hypothetical SKU, assume average demand of 40 units a day, a 7-day lead time, and 60 units of safety stock. Lead-time demand is 40 × 7 = 280 units, so the reorder point is 280 + 60 = 340 units.
This means you trigger replenishment at the threshold. It doesn't mean you order that quantity.
Use inventory position where your process supports it: usable on-hand stock plus confirmed inbound supply, minus commitments or backorders not already deducted. Otherwise, a buyer may place duplicate orders while an earlier shipment is already on its way.
The calculation is summarized below.
Contrast a slow-moving product
Consider another hypothetical SKU selling 2 units daily with a 30-day lead time. Its expected lead-time demand is 60 units before adding safety stock.
A slow seller can still need meaningful coverage when replenishment takes a long time. But don't copy the fast mover's buffer: assess how irregular its demand is and what happens if it runs out.
For a volatile supplier, a hypothetical starting policy might add 7 days of demand as a buffer. Treat that as an assumption to test, not an industry standard. With sufficient history, use a statistical safety-stock calculation matched to demand variability, lead-time variability, and your chosen service target.
Diagnose the warning signs
Repeated emergency orders suggest the threshold may be too low, but late suppliers, missed receipts, or unrecorded demand can produce the same symptom. Check the cause before raising stock.
Likewise, a hypothetical aging alert at 90 days can prompt review, but it doesn't prove the reorder point is too high. An oversized order quantity, canceled promotion, or seasonal buying policy may be responsible.
Decision check: Change the parameter that caused the problem, not simply the parameter that's easiest to edit.
Warehouse Practices That Protect Inventory Accuracy
Phantom inventory starts when the system shows stock that workers can't find. A picker searches the wrong location, an order misses dispatch, and a buyer may arrange an emergency purchase even though the records still show availability.
APQC's warehouse-productivity benchmarks report median inventory accuracy of 95.0%, with the middle 50% ranging from 92.0% to 98.0%. Those reference points don't remove the need to define your own measurement unit and tolerance.
For a hypothetical warehouse with 100,000 individually assessed unit records, 95% accuracy would mean approximately 5,000 inconsistent records. Don't apply that arithmetic to a SKU-location audit automatically: a mismatched location could contain a small or substantial quantity discrepancy.
Direct counting effort toward risk
Cycle counting means checking selected inventory regularly rather than waiting for a full stocktake. ABC segmentation helps prioritize that work by value, movement, and operational importance.
The following is an illustrative starting policy, not a measured industry distribution.
Cycle-count frequency by ABC class
ABC Class | Typical Share of SKUs in This Illustrative Policy | Count Frequency | Priority |
|---|---|---|---|
A, high value or fast movers | About 20%, often carrying most of the value | Weekly to monthly | Highest |
B, moderate value and movement | About 30% | Quarterly | Medium |
C, low value and slow movers | About 50% | Annually or during routine stock checks | Lowest |
Override the classification for a low-cost component that could stop production. Purchase value alone doesn't capture operational criticality.
Barcode checks help workers connect the physical location with the recorded movement.

Correct the process, not just the balance
When a count fails, investigate:
- Receiving errors: Compare the purchase order, actual delivery, and posted receipt.
- Mis-slotted goods: Check adjacent bins and look-alike products.
- Unit conversions: Confirm whether staff recorded individual units, cartons, or cases.
- Unrecorded movements: Review transfers, damages, returns, and stock taken for internal use.
Slotting means assigning storage positions deliberately. Place frequently picked products near dispatch where safe, while keeping heavy goods accessible and separating easily confused items.
In a hypothetical 5,000-SKU site, an A group representing about 20% would contain 1,000 SKUs. If pick records confirm that these dominate warehouse activity, prioritize their locations for counting and layout improvements.
Measure accuracy by SKU, location, and process step. A site-wide average can hide a recurring receiving problem or a single unreliable storage zone.
Plan Returns, Sustainability and Disruption Risk
A seller orders more of a popular product while unprocessed returns sit in a back room. Some are ready for resale, some need inspection, and others are damaged. Treating all of them as either available or worthless creates avoidable purchasing mistakes.
Reverse logistics is the process of bringing goods back through inspection, repair, resale, repurposing, or recycling. It belongs in inventory planning because a returned unit's condition determines whether it can support a customer promise.
DHL's guidance on logistics trends for SMEs reports that at least two-thirds of surveyed SMEs across industries consider sustainability very or extremely important. Recovering usable goods gives teams a practical way to connect that priority with purchasing decisions.
Give every returned unit a disposition
Use a clear sequence:
- Tag the condition. Keep returned, damaged, awaiting-inspection, repairable, and sellable goods in separate ledger statuses.
- Define availability. Only include stock in available-to-promise quantities when it meets your release requirements.
- Choose the recovery route. Assign repair, resale, repurposing, recycling, or disposal, with an owner responsible for completing the action.
Don't delay an urgent replacement order while waiting for uncertain recovery. Instead, record expected recovery dates separately from confirmed sellable stock.
Compare recovery value with inspection, transport, repair, and handling expense. Sustainability doesn't require pretending every damaged item is economical to restore.
Protect service against disruption
Supplier risk includes more than late deliveries. A cyber incident can interrupt ordering or warehouse access; severe weather or energy constraints can stop production and transport.
For suppliers with long or variable lead times, consider a larger selected buffer, an alternative supplier, or an approved substitute. Review that exposure quarterly and after material changes in supplier performance.
The best policy isn't always the one with the fewest units. It may preserve selected components or repair capability because they protect service more effectively than extra finished goods.
Build Analytics in Stages and Choose Your First Fix
Start with a ledger your buyer, warehouse lead, and finance owner can reconcile. Adding forecasts to conflicting stock balances creates more confident-looking disagreement, not dependable planning.
The Impinj supply-chain integrity report describes a visibility gap: 85% of surveyed retail supply-chain leaders believed their organizations were equipped for accurate visibility, yet only 36% consistently achieved accurate, complete, real-time inventory visibility.
For an SME, the practical response isn't necessarily replacing every system. It's agreeing which records are authoritative, how quickly updates must arrive, and who resolves exceptions.
Establish the ledger before adding intelligence
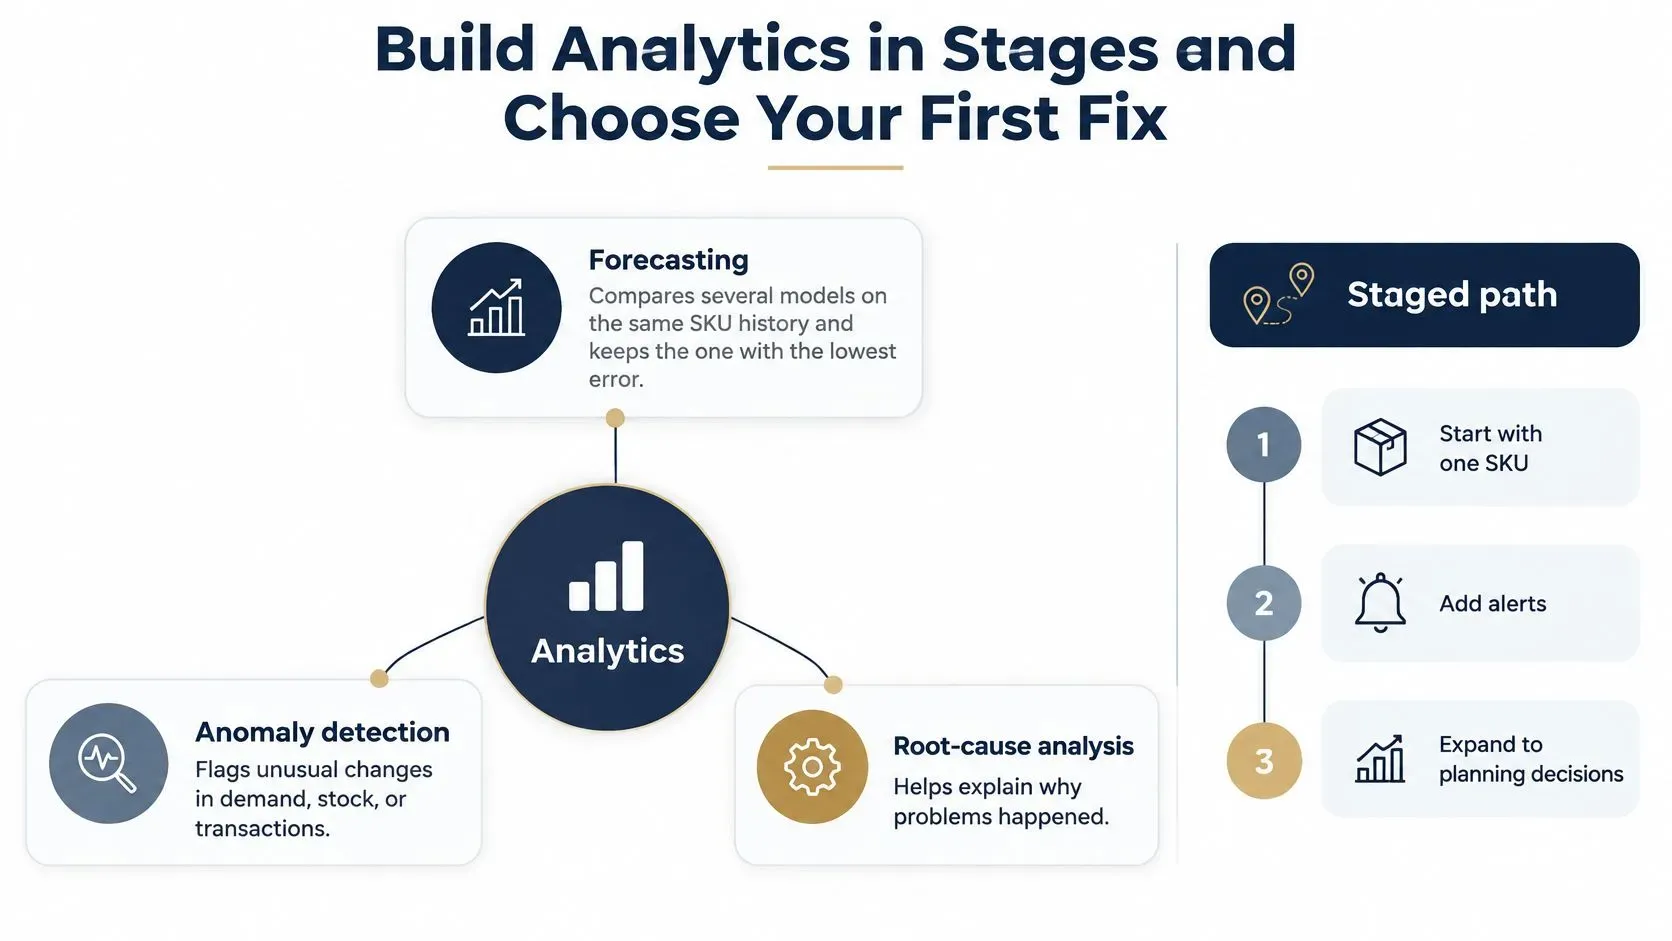
Build your analytics capability in stages:
- Create a common inventory ledger. Standardize SKU identifiers, units of measure, locations, statuses, and transaction timestamps.
- Add alerts to priority products. Monitor missing updates, unexpected negatives, and unresolved reconciliation differences.
- Introduce forecast comparison. Test candidate methods on the same historical periods before relying on their outputs for purchasing.
Assign an owner to each source feed. Measure update delays and unresolved differences, rather than describing data as real-time without a defined standard.
Use monitoring data quality dimensions to organize checks for completeness, consistency, validity, and timeliness. Restrict access to customer and supplier information, remove unnecessary personal data from analytics inputs, and retain an audit trail of adjustments.
The staged approach keeps each analytical task connected to a practical decision.
Use each analytical job for a different question
Forecasting estimates future demand. Compare models using held-out historical periods, meaning observations the model didn't use to fit its predictions. Retain the method that performs best on a relevant error measure without ignoring seasonality or intermittent demand.
Anomaly detection identifies records worth investigating. Say an alert highlights repeated negative balances at a receiving location. The warehouse lead discovers that workers posted case receipts as individual units, corrects the conversion, and checks affected transactions.
Optimization turns estimates and constraints into proposed actions. It can recalculate replenishment thresholds as demand shifts and identify products above their target coverage. Staff should review supplier minimums, storage limits, and exceptional orders before approving changes.
Each week, compare customer-demand, replenishment-order, and supplier-shipment variability using matched time windows. Investigate growing upstream fluctuations before responding with more stock.
Choose the first fix by symptom
If physical counts frequently disagree with records, start with A-item counting and root-cause correction. If shortages recur despite reliable records, review replenishment assumptions. If demand changes sharply, compare forecasting methods and separate promotional effects.
ELECTE, an AI-powered data analytics platform for SMEs, offers a free reorder point calculator and an AI Agent that can compare six forecast models, flag anomalies, analyze Q3 revenue drift, summarize top competitors, and prepare board decks. For inventory work, begin with the calculation or exception that supports your immediate decision rather than automating every report at once.
Key Takeaways
- Price the stock you hold: Calculate turnover and carrying-cost rate for a manageable priority group, such as a hypothetical first batch of 20 SKUs.
- Check a physical balance: Run an A-item cycle count and record the cause of each discrepancy.
- Set a replenishment trigger: Establish a reorder point for a product with usable demand and lead-time history.
- Assign responsibility: Give each alert and parameter change an owner and review date.
Better inventory management logistics doesn't require your team to predict every disruption. It requires dependable records, explicit assumptions, and a repeatable way to act when reality differs from the plan.
ELECTE offers a free reorder point calculator and AI-powered analytics to help you connect stock decisions with demand, exceptions, and cash exposure. Visit ELECTE to explore the calculator or request a personalized demo using the inventory decision your team needs to improve first.
Comments
No comments yet — start the conversation.