AI Data Visualization: How It Works and How to Start
Discover how AI data visualization spots anomalies, writes chart narratives and picks the right format. Get a step-by-step workflow and tools to try.

You opened the weekly pack, saw a clean revenue chart, and nearly forwarded it. The line looks smooth. The note underneath sounds sure of itself. You still can't see which rows produced it, which filter dropped the returns, or whether Friday's upload finished.
That gap is what AI data visualization is for. The software can propose the chart, flag an odd movement, and draft the sentence. You still decide whether the claim is solid enough to change a price, a purchase order, or a forecast.
The path below starts from a Monday review you already know. You'll see what each capability hands you, which format fits which question, a workflow you can run this week, the checks that catch a polished mistake, and a 30-day test on one report you already own.
What AI Data Visualization Does Beyond Prettier Charts
It's Monday. A sales manager opens the dashboard and the one chart that matters is already highlighted, with a short note on why that series moved. Nobody rebuilt the visual overnight. The software did the first pass, and the manager still has to decide if the note is fair.
Ordinary charting waits on you. You pick the type, choose the fields, and read the picture yourself. AI data visualization uses statistics and machine learning to propose charts, flag unusual movements, and write a plain-language summary of what changed.
A spreadsheet is a calculator that waits for your instructions. This kind of software is closer to a junior analyst who reviews every row overnight and brings you only what needs attention. You still own the judgment.

The habit is old, even if the software is new. Quantitative graphs with two-dimensional coordinate scales emerged in the 17th century, and William Playfair's 1786 atlas set line and bar formats still in use, as the history of statistical graphics traces. John Tukey's 1977 exploratory data analysis made visual pattern-finding central, and Edward Tufte's 1983 book formalized how to display quantities. Automated chart selection, anomaly detection, forecasting displays, and natural-language insight generation extend that line.
Teams that want those charts to hold up in a rough quarter can pair the history with future-ready visualization strategies from Trackingplan. The same care helps you design clearer business dashboards so a highlight is easy to challenge, not only easy to share.
AI shortens the path from data to a question. A person still decides what the insight means and whether to act.
Four AI Capabilities and What Each Produces
Four capabilities cover almost every screen you'll meet. Read the row, then the check, before you treat the output as a fact.
Capability | What the AI Does | What You Get | What to Check |
|---|---|---|---|
Automated insight detection | Scans every series for spikes, drops, shifts and outliers | Flagged periods with the size and direction of each change | Data gaps, seasonality and one-off events before calling it a problem |
Narrative generation | Turns chart values into written commentary | A plain-language summary of what changed since the last period | Every number in the text matches the source table |
Adaptive visuals | Selects or switches chart type, filters and time range | Trend, distribution or contribution view matched to the question | Whether the chosen view answers the decision you face |
Natural-language querying | Converts a plain question into a filtered query and chart | A chart answering a question asked in ordinary words | Which filters, date range and aggregation the AI applied |
Automated insight detection walks every series and returns the periods that jumped, fell, or sat outside the usual band, with the size and direction of each change. Say weekend orders in one region double while the other regions stay flat. The flag is useful only after you check a missing file, a holiday, or a one-day stockout. If those explain the move, it isn't a new trend.
Narrative generation turns those values into a paragraph about what changed since last period and why it might matter. The sentence can sound finished while a total is off by a filter. Read each number back against the source table before the paragraph leaves your desk.
Adaptive visuals pick or switch the chart type, the filters, and the time range so you get a trend, a distribution, or a contribution view. A contribution view answers "which region drove the lift." A trend view answers "is the lift still climbing." If the view doesn't match the decision in front of you, switch it.
Natural-language querying takes a sentence such as "Why did repeat-customer revenue fall in March?" and returns a filtered query plus a chart. Open the filters, the date range, and the aggregation it applied. "Repeat customer" might mean two orders, or it might mean a loyalty flag your file doesn't use.
A flagged spike is a claim about the rows, not proof that the business broke.
The four work as one pass. Detection finds the story, the adaptive view shows it, and the narrative explains it. The question you typed is what keeps that pass honest.
Matching Chart Types to the Question You Ask
An attractive default can make the right data harder to read. The question should pick the format, not the template that looked good in a demo.
A large comprehension study summarized by NORC, with 3,176 panelists across three rounds, found that stacked and diverging stacked bar charts produced the highest average share of correct interpretation answers. Line charts were slightly but significantly weaker on those interpretation statements, and more accurate when people had to estimate specific values. A separate pair of web experiments found that graphs beat tables for estimating differences, while tables were better for equality and for sums. The same work found that three-dimensional displays reduced comprehension of pie charts, though not of bar charts.

Best chart format by decision question
Question You Are Asking | Best Format | Why It Works |
|---|---|---|
Is this metric rising or falling over time? | Line chart | Higher accuracy when estimating values across periods |
What share of the total does each part make up? | Stacked bar chart | Highest share of correct interpretation answers in the large comprehension study |
Which of two groups is larger, and by how much? | Bar chart or graph | Graphs were better than tables for estimating differences |
What is the exact sum or total for each row? | Data table | Tables were better for equality and sum judgements |
Which of many categories ranks highest? | Sorted bar chart | Sorted lengths make rank order visible at a glance |
Any chart with three-dimensional styling | Remove the 3D effect | Three-dimensional displays reduced pie chart comprehension |
Use a line when you need a point on a date. Use a stacked bar when the decision is about mix, such as how much of March revenue came from repeat buyers. Use a plain bar when two groups need a size comparison. Switch to a table when finance needs an exact total, because a pretty bar hides the digit people will type into a model. Sort bars when the job is rank, from best store to worst. Drop 3D on a pie. The extra depth makes slices harder to compare, and it doesn't add a fact.
Styling isn't the message. In a study that used authentic Eurostat charts, embellishment didn't change how people extracted the basic message, though it did improve later recall of the picture. Put the comparison in the title. "Repeat revenue fell in March outside the top three regions" beats a decorated chart with a vague heading.
The same rule shows up in chart choices for sales data. If the question is "how many orders fell into each basket size," a histogram fits. If the question is "which channel sold more," a bar fits. Pair every chart with the underlying values in a table so a screen-reader user can reach the same numbers, and so you can check the picture against the rows.
How to Build an AI Visualization Workflow Step by Step
Treat the workflow as a short production line. Each step exists because skipping it creates a specific kind of wrong chart.
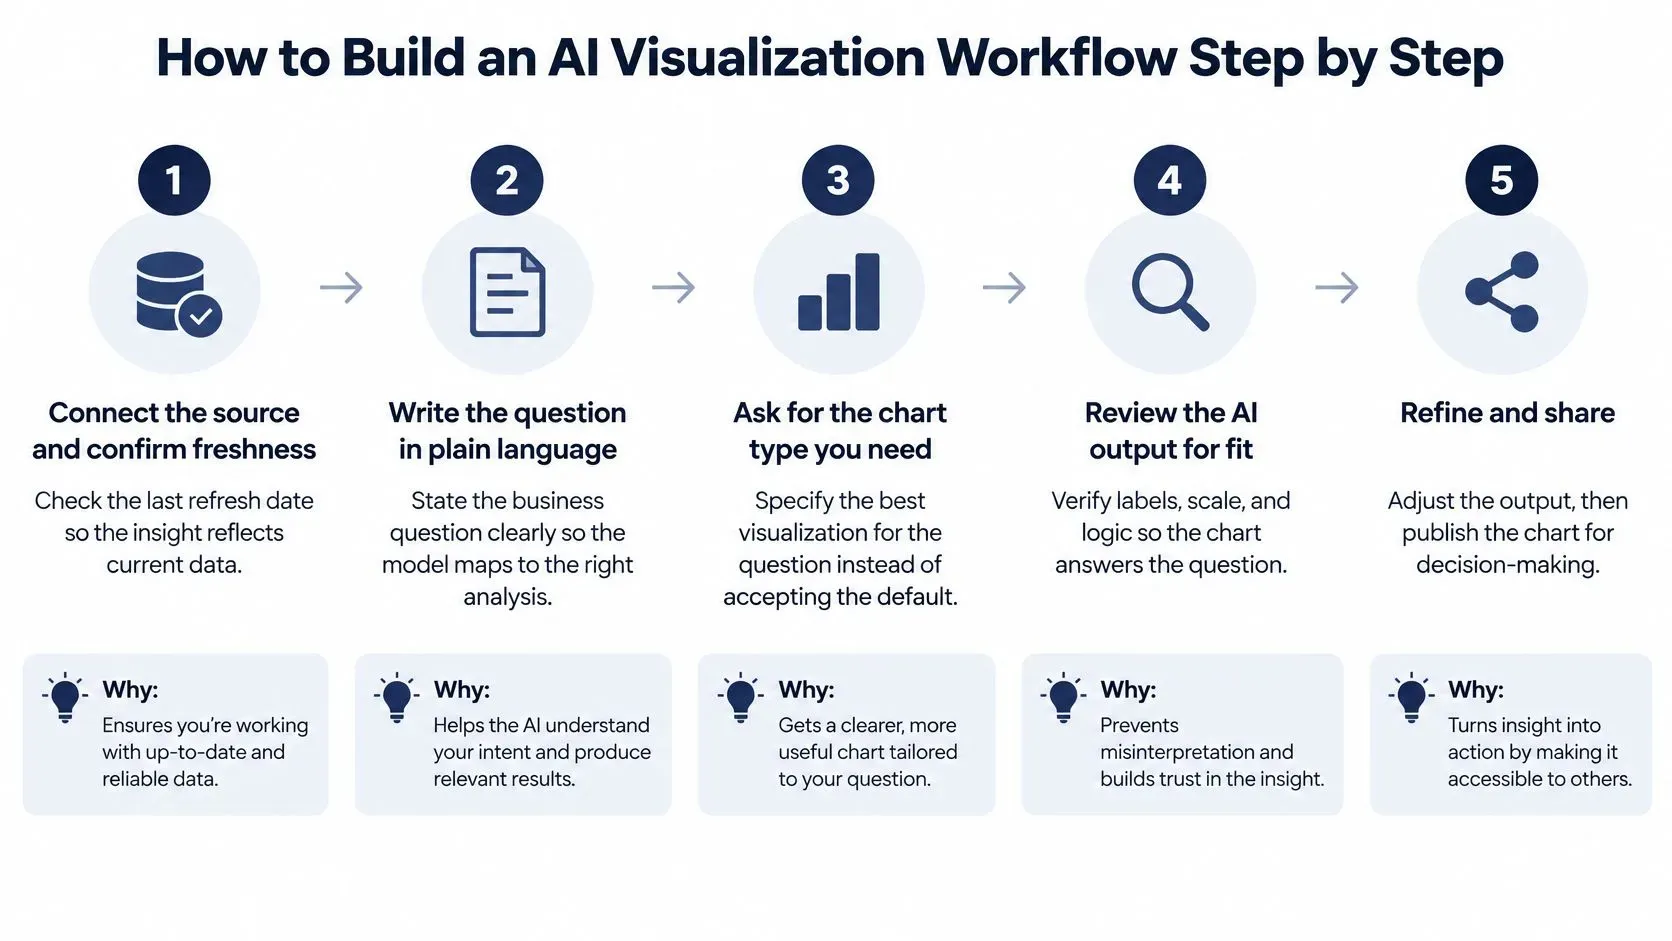
- Connect the source and confirm freshness. Check the last refresh date so the insight reflects current data. Confirm the team is allowed to connect that source, and share only the fields the reader needs. Privacy duties apply as soon as customer, payroll, or clinical fields enter the file. The common slip is trusting a chart built on Thursday's export after Monday's close has already moved.
- Write the question in plain words. "Did the spring promotion lift sales outside the top three regions?" is precise enough to map to filters and a comparison. "Show me sales" is not. Vague questions produce charts that answer nothing in particular, then get forwarded anyway.
- Let the software generate three to five candidate views. Ask for a trend, a distribution, and a contribution view rather than accepting the first default. One view hides the fact that another cut of the same rows tells a different story.
- Rank candidates by fit and drop duplicates. Keep the view that answers the sentence you wrote. Drop the rest when they repeat the same movement with a new color. Extra charts feel thorough and mostly waste the meeting.
- Verify the numbers against the source table before anyone else sees them. This is the gate. A chart that hasn't been checked against the rows is a draft, even if the labels look finished. The next section spells out the checks.
- Add the narrative beside the chart, with the filters, date range, and data timestamp visible. Readers should see what changed and what was excluded without opening a second tool. Hiding those details is how a correct chart gets misread.
- Share the approved view and record the response. Note whether the reader accepted, edited, or rejected each candidate. That record is what improves the next ranking. If you only keep the winner, you never learn which defaults waste time.
What finished looks like
One question, one approved chart, and one short note on the decision it supports. Say the note reads, "Keep the spring offer outside the top three regions. Stock covered the lift, and the comparison excludes marketplace returns." That's a workflow. A folder of twelve auto-built charts is not.
Checks That Keep AI Charts Accurate
A clean chart can still be wrong. Tidy labels and a modern palette are not evidence that the totals, the filters, or the story are right.
Chart question-answering tests found that charts generated by large language models didn't match the accuracy of the original charts. Valid syntax and attractive styling weren't enough. In a separate human-centered evaluation, vision-language models came close to people on some chart-reading tasks, but GPT-4V sat well below humans on ChartQA-Human when only valid responses were counted, with a gap of -0.26, according to that chart-reading evaluation.
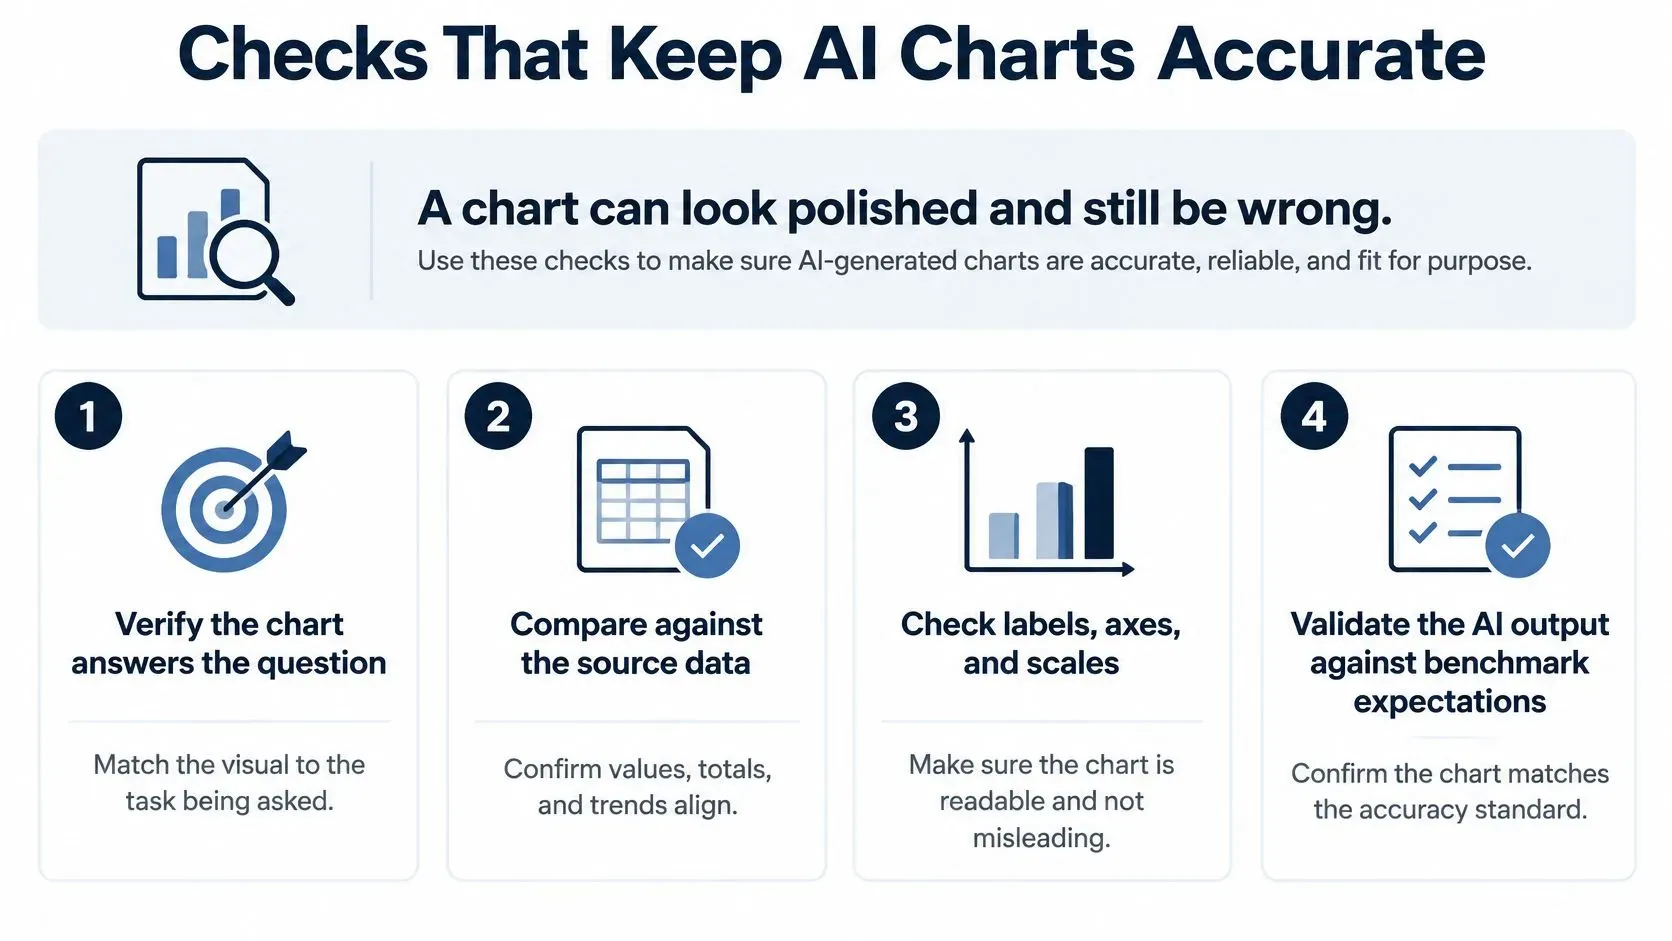
A checklist you can run on one chart
- Match every extracted value to the source table. If the narrative says March repeat revenue was 42, the table must say 42 under the same filter.
- Recompute the aggregation. Confirm whether the figure is a sum, an average, or a distinct count. An average of store totals is not company revenue.
- Attach a confidence note to each numerical claim. Say what was complete, what was late, and what the model didn't see.
- Send ambiguous charts to a person. Dense multi-series plots, arithmetic comparisons, and unusually scaled axes need a human look before they leave the draft folder.
Require a second check before an anomaly changes a budget or an inventory order. A spike that fails the data-gap test should not become a purchase. The same habit supports setting thresholds for data quality alerts, so a late feed raises a flag before it raises a false story.
The NIST AI Risk Management Framework gives these controls a home. Govern sets who may approve an insight. Map records intended use, data, and where a person must step in. Measure checks accuracy, bias, privacy, and security. Manage is the monitoring and the correction when a chart fails. A visually plausible interpretation isn't a verified one.
Real Workflows and Tools Teams Use Today
Two sketches, not customer results, show where the check happens.
A retail team sees a promotion lift that appears in only one region. Before they extend the offer, they open store-level stock. Two shops were out of the hero item, so the "weak" region wasn't weak demand. It was empty shelves. The chart was right about sales and wrong as a brief for a wider discount.
A finance team watches a forecast line drift from actual cash each month. The written note names payment timing, not a demand shock. Invoices left on the 28th land in the next month's bank file. Nobody cuts headcount on that gap. This isn't financial, risk, or compliance advice. It's a reminder to read the timing before you read the slope.
Published descriptions sit in the same pattern. A 2025 case study describes how a healthcare company chose ELECTE to centralize clinical data analysis and generate automated visual reports for management. A 2024 case study describes how a digital health company adopted ELECTE to consolidate patient data and provide the clinical team with real-time dashboards. In both, the picture only helps after someone can see where the rows came from.

AI visualization tools by team situation
Tool | Best For | Where the AI Helps |
|---|---|---|
Microsoft Power BI with Copilot | Teams already working in Microsoft 365 | Drafts visuals and summaries from a plain-language question |
Tableau | Analysts building governed dashboards with explanations | Generates metric summaries and highlights changes in tracked metrics |
Looker | Teams standardized on Google Cloud | Drafts reports and explains chart content from natural-language prompts |
ELECTE, an AI-powered data analytics platform for SMEs | SMEs and non-technical managers needing reports without a dedicated analyst | Generates automated reports, anomaly-driven insights and forecasts from connected data |
Match the tool to the person who will read the chart and the person who will maintain it. A long feature list doesn't help if nobody on the team can refresh the model or challenge a filter. If your readers are store managers, favor a short report with the source timestamp on the page. If your readers are analysts, favor a governed dashboard they can edit.
Pick One Report and Test AI Visuals This Quarter
Start with one recurring report tied to a decision you already make. The weekly sales review or the monthly cash forecast is enough. Don't convert the whole stack in one sprint.
Before the pilot, write a baseline. Record hours spent building the report, how many corrections it needed last month, and how long a decision takes after the pack arrives. Without that note, a faster screen later proves nothing.
Run the AI version beside the manual one for 30 days. Apply the value, aggregation, and scale checks to every insight that would change an order, a price, or a forecast. Most ELECTE users are operational in under 5 minutes, with the first forecasts generated right after accounting software is connected or a file is uploaded. ELECTE also writes automatic weekly, monthly, or board-cycle reports from the live state of the data, including charts, commentary, and what changed since last time. Speed is the easy part. The test is whether those pages stay traceable.
Adoption is ahead of confidence. In a 2025 Capgemini survey, 93% of organizations were exploring or enabling generative AI, yet 71% said they couldn't fully trust autonomous AI agents for enterprise use. That gap is why a chart needs a trail. Which rows, which filters, which date range, and which model version produced the flag?
Set a human approval line before the pilot starts, for any action above a value the team agrees in advance.
Keep the workflow only if corrections fall and every flagged insight traces back to its rows, filters, date range, and model version. Stop it if the narrative can't be reproduced, or if the baseline was never written down. An unmeasured pilot can't show that you saved time. It can only show that a new chart appeared.
Key Takeaways and Your Next Step
Treat every AI chart as a claim until its trail is checked.
- Match each chart to the decision question, and use the format table as your default instead of the prettiest template.
- Write the question in plain words and generate three to five candidate views before you keep one.
- Attach the source rows, filters, date range, data timestamp, and model version to every chart that drives a decision.
- Run one recurring report beside its manual version for 30 days, and keep the AI workflow only if corrections fall.
AI data visualization shortens the path from a file to a question you can discuss on Monday. The decision still belongs to the team. For SMEs, the gain is a faster brief that shows its working, so a store manager or finance lead can challenge a number without waiting on a specialist. Pick the report you already trust least, run it both ways for a month, and keep the version you can trace.
ELECTE connects your sources and generates automated charts, commentary, and forecasts from the live state of your data, including what changed since last time. If you want that check built into your weekly pack, visit ELECTE and book a personalized demo on the report you already run.
Comments
No comments yet — start the conversation.