Data Driven Insights: How Teams Turn Data Into Decisions
Learn what data driven insights are and how businesses turn data into measurable decisions, with a framework, examples and metrics.

Your regional manager opens the weekly review with months of sales, stock and payment records on the system behind her. The discussion still runs on gut feel and an old spreadsheet someone updated on Friday. Nobody in the room lacks data. They lack a finding that's clear enough, trusted enough and timed well enough to change what they do next.
That's the gap this guide closes. You'll learn what counts as an insight, how raw records become a decision, where the process breaks, and how to prove an insight improved a result.
Why Most Business Data Never Changes a Decision
Data sitting in a point-of-sale system, an accounting package or a bank feed doesn't change anything by itself. A report can be accurate, on time and beautifully formatted, and still leave every decision exactly as it was. The missing piece is usually not volume. It's a named owner, a clear question and a moment when the answer can still alter an order, a price or a review queue.
Adoption is moving, though. The 2025 OECD survey of SMEs found that 39% of surveyed SMEs used at least one AI application in core business activities or products, up from 26% in 2024. Generative AI was the most widely used category, reported by 26% of respondents compared with 18% the previous year. The OECD cautions that the sample isn't representative of all SMEs, but the direction is clear.
Here's the working definition to carry through this guide. A data-driven insight is a finding from business data that someone can act on and that you can check against an outcome. If nobody acts, or you can't check the result, you've got information, not an insight.
You'll get the four insight types, a four-stage path from raw data to decision, the performance evidence, the failure points, retail and finance examples, a measurement framework and one first decision to try.
Four Types of Data-Driven Insights and the Questions They Answer
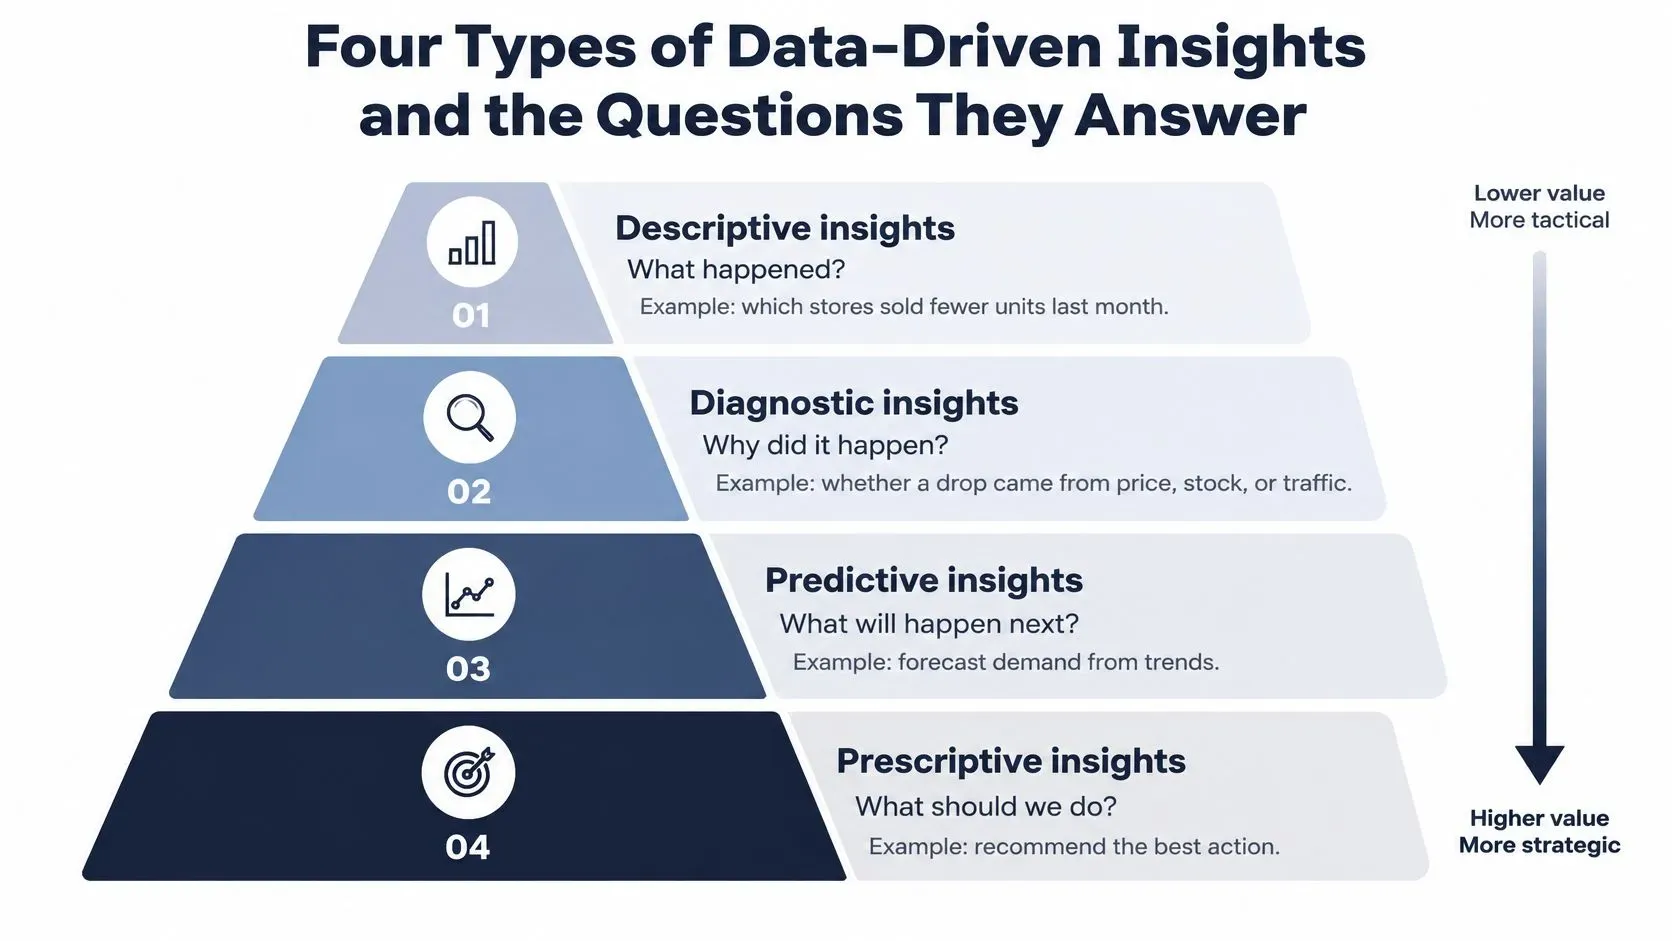
Think of the four types as a ladder. Each step answers a harder question, needs cleaner history and carries more consequence if it's wrong. A descriptive insight is the weather report. A prescriptive insight is the advice to take an umbrella.
What Each Type Does
Descriptive insights say what happened. Which stores sold fewer units last month, which expense categories grew last quarter. Teams often start here, and that's fine. It's the baseline everything else builds on.
Diagnostic insights explain why. Did that sales drop come from price, stock gaps or weather? Do late payments cluster in one customer segment? This step needs you to join data across systems, which is why many teams stall here.
Predictive insights estimate what's likely next. Expected demand per product over four weeks, expected cash position over 90 days. A forecast is a range with uncertainty attached, not a promise.
Prescriptive insights recommend an action. How much to reorder, which promotion to run, which accounts to review first. This step needs the most trust, because you're letting the analysis point at a person and a task.
Insight type | Question it answers | Retail example | Finance example |
|---|---|---|---|
Descriptive | What happened? | Which stores sold fewer units last month | Which expense categories grew last quarter |
Diagnostic | Why did it happen? | Whether a sales drop came from price, stock gaps or weather | Whether late payments cluster in one customer segment |
Predictive | What is likely next? | Expected demand for each product over the next four weeks | Expected cash position over the next 90 days |
Prescriptive | What should we do? | How much to reorder and which promotion to run | Which accounts to review first for risk escalation |
Each step up needs longer data history, clearer owners and more confidence in the model. Jumping straight to prescriptive recommendations on thin, messy history is how teams lose trust in the whole effort.
If you want to build these skills formally alongside the work, you can explore business analytics courses that cover this progression from reporting to recommendation.
Quick test: Pick any dashboard you use. Does it name the decision it should change? If it doesn't, it's descriptive decoration, however accurate the numbers are.
How Raw Data Becomes a Decision in Four Stages
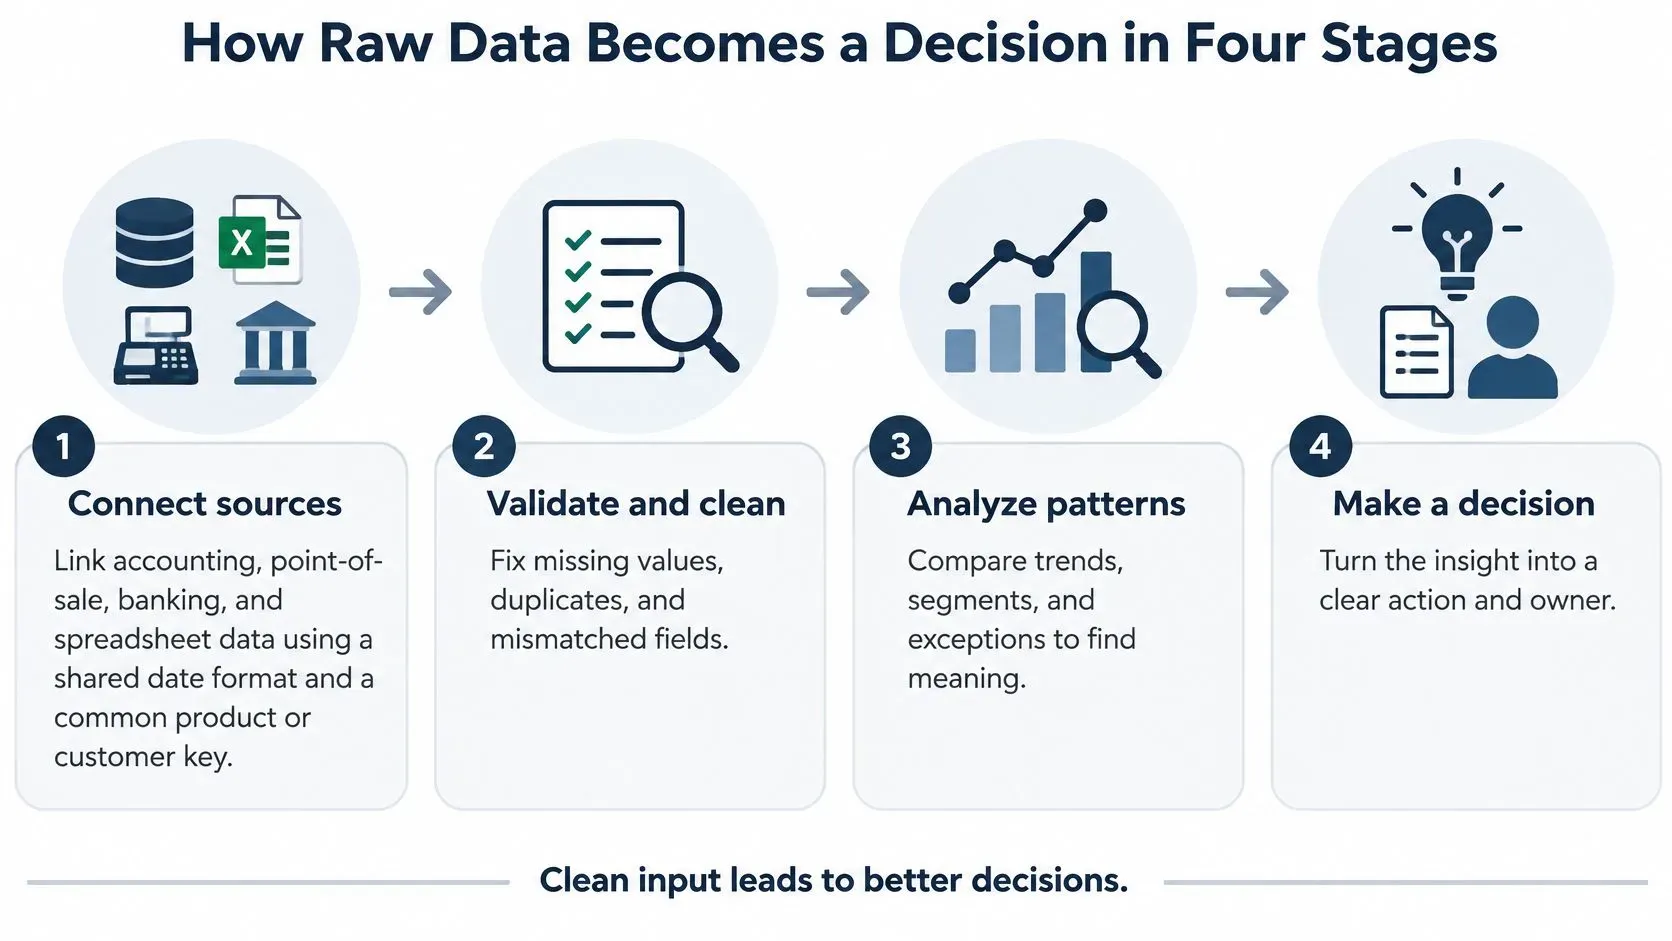
Raw records don't become data driven insights in one jump. They pass through four stages, and each stage has a characteristic way of failing without notice.
The Four Stages
- Connect sources: Link accounting, point-of-sale, banking and spreadsheet data using a shared date format and a common product or customer key. Without a shared key, you can't ask whether a sales dip and a stock gap are the same event. The common slip is connecting everything available instead of the sources one decision needs.
- Validate and clean: Remove duplicates, flag missing values, check how fresh each feed is and compare totals against a second source. This stage matters because errors upstream look exactly like business events downstream. Skip it, and a tracking error shows up as a sales spike that sends someone chasing a phantom.
- Model and detect: Run trend, anomaly and forecasting methods on the cleaned history. Compare several models on the same past data before trusting one, because a model that fits last quarter beautifully may fail on the quarter before. The slip here is choosing the most complex method instead of the one your team can interpret and challenge.
- Deliver with context: Send each insight with a named owner, a threshold, a confidence level, a comparison baseline and one recommended next action. An alert that just says sales are down gives the owner nothing to do. An alert that says sales are down against the four-week baseline, stock gaps explain most of it, and the next step is checking two stores, gets acted on.
Why the Stages Have to Connect
The stages only work as a chain. The McKinsey guide to building a data-driven strategy identifies three mutually reinforcing capabilities, combining and governing multiple data sources, developing predictive or optimization models, and embedding those outputs into managerial decision processes. Model accuracy alone doesn't create value. Value appears when a model is tied to a defined business opportunity and translated into an operational action.
McKinsey also warns that excessive statistical complexity can reduce adoption when managers can't interpret or operationalize the result. So define the decision first, such as replenishment, promotion allocation or risk escalation. Then pick the data, model, threshold and owner that serve it.
One metric keeps the chain honest. Decision latency is the time from anomaly or forecast generation to verified business action. Track it alongside outcomes like stockouts, margin or false-positive review rates, and you can judge insights by business impact rather than dashboard usage.
A privacy note before you connect anything. Use only data your business is permitted to use, and remove personal identifiers such as customer names before sharing reports or insight outputs beyond the people who need them.
A finished insight passes one sentence. Who acts on it, by when, and how will the result be checked?
What the Research Says About Insight-Driven Performance
Does any of this pay? The strongest early evidence comes from a 2011 study by Erik Brynjolfsson, Lorin Hitt and Heekyung Kim of U.S. publicly traded companies, summarized in the OECD volume on data-driven innovation. The researchers combined survey-based measures of data-driven decision-making with financial information and data on firms' information-technology investments.
Their central finding was that companies adopting data-driven decision-making achieved output and productivity levels approximately 5% to 6% higher than would be expected from their other investments and use of information technology. The relationship extended beyond productivity. Data-driven firms also showed stronger asset utilization, return on equity and market value.
How Strong Is That Evidence
You might wonder whether better firms had more money to spend on analytics. The authors tested that. They used instrumental-variable methods to check reverse causality and reported evidence that the association was not explained only by reverse causality. That doesn't make it proof for your business, but it's stronger than a simple correlation.
The study matters because it measured the value of using data in managerial processes, not the value of owning data or buying technology. Collecting records is an IT asset. Embedding analysis in decisions, performance management and operational workflows is where the measured gain sat.
What Later Surveys Add
Adoption behavior shows the same pattern. In McKinsey's survey of data and analytics leaders, respondents at high-performing organizations were three times more likely than others to report that data and analytics contributed at least 20% of EBIT over the prior three years. Organizations where employees consistently used data in decision-making were nearly twice as likely to report achieving their analytics objectives and approximately 1.5 times as likely to report revenue growth of at least 10% over the preceding three years.
Read those two sets of findings together and a mechanism emerges. Recurring use of standardized evidence changes decision behavior. That behavior change is what makes forecasts, anomaly alerts and recommendations affect where money and attention go.
Finding | Scope | What it tells you |
|---|---|---|
5% to 6% higher output and productivity | U.S. publicly traded companies, 2011 study | Using data in decisions beat technology spending alone |
Three times more likely to credit analytics with at least 20% of EBIT | High-performing organizations in McKinsey survey | Leaders tie analytics to financial results, not activity |
Nearly twice as likely to meet analytics objectives | Organizations where employees consistently used data | Habit, not volume, drives the return |
So when anyone claims a return from analytics, ask one question. Which decision changed, and how was that change measured? If there's no answer, you're hearing about deployment, not performance.
Where Data-Driven Insights Break Down and How to Spot It
More insights aren't always better. An insight built on weak data can cost more than no insight at all, because it sends people acting confidently in the wrong direction.

The cost is measurable. IBM's Institute for Business Value reported in 2025 that 43% of chief operations officers identified data-quality problems as their most significant data priority. More than one-quarter of organizations estimated that poor data quality costs them over USD 5 million annually, while 7% reported annual losses of at least USD 25 million.
The Usual Causes in Plain Language
Most failures come from a short list. Missing values leave gaps a model fills with guesswork. Stale records describe last month's business, not today's. Conflicting figures across systems mean two teams argue from different totals. Some anomalies are tracking errors wearing the costume of real change. And historical bias means the model faithfully repeats past patterns, including the unfair or incomplete ones.
Say a forecast recommends a large reorder, stated to the exact unit. It looks precise. But it was built on inventory counts from last month, before a delivery and a clearance weekend. Your team orders against shelves that are already full, and the precision made nobody ask the obvious question. False confidence is the expensive part, not the arithmetic.
Failure point | Warning sign | Fix |
|---|---|---|
Poor data quality | Dashboard totals disagree with finance or point-of-sale figures | Reconcile sources and assign one owner to each data source |
Stale data | Forecast uses last month's inventory counts | Show data age on every insight and block alerts past a set age |
Missing values | Forecast shifts sharply after a few blank days | Set a maximum acceptable gap and flag forecasts that exceed it |
Tracking error mistaken for change | Sudden spike with no matching business event | Check the data pipeline and require a second source before acting |
Bias in historical data | Recommendations repeat past patterns that under-covered some customers | Review training data coverage and test results by customer segment |
Alert fatigue | Alerts are acknowledged but no action follows | Set thresholds and attach one recommended next step to each alert |
This is why catching bad data before reporting deserves its own routine, with automated preparation, validation and monitoring running before anyone relies on a forecast.
The principle to keep is simple. Showing uncertainty can be worth more than another dashboard. Display confidence, data age and where the numbers came from, and withhold an insight when the inputs are too weak to support it. A blank space with an honest reason builds more trust than a confident number nobody should act on.
Turning Insights Into Decisions in Retail and Finance
Abstract stages are easier to trust when you can see them land in a working week. These four scenarios follow the same shape. Data comes in, an insight forms, a named person decides, and a metric shows whether it helped. A fuller walkthrough of the retail side shows how to turn retail sales data into decisions across stores and channels.
Retail Replenishment and Promotions
Say a store team forecasts demand by product and store for the coming weeks. They compare that forecast with current stock levels and supplier lead times. The insight flags products that will run out before the next delivery can arrive, and the replenishment owner reorders those lines early. The result shows up in the stockout rate, checked alongside excess stock value so the team doesn't fix empty shelves by overfilling the stockroom.
Promotions need the same discipline. The team looks at past campaigns by customer segment and measures the sales lift each one produced, then subtracts the promotion cost to see the margin left behind. A campaign that sells more units but erodes margin gets flagged before it's repeated. The decision isn't whether the promotion felt successful. It's whether the segment, discount and timing left money after the cost.
Cash Forecasting and Risk Review
Now say a finance team builds a 90-day cash view from receivables, payables, payroll dates and bank balances. The insight isn't the chart. It's the alert that fires when projected cash falls below the buffer the business has agreed to hold, early enough for someone to chase an invoice or move a payment date. The owner and the decision date are fixed in advance, so the alert starts a task instead of a debate.
Risk and compliance teams face the opposite problem, too many cases and too little review time. Transaction anomalies get ranked by risk so reviewers see the highest-priority cases first. Two metrics keep the ranking honest, average review time and the false-positive rate. If reviewers keep clearing flagged cases as harmless, the threshold needs work, not more alerts.
Decision | Insight that triggers it | Metric that proves it |
|---|---|---|
Reorder timing | Forecast demand against stock and lead time | Stockout rate and excess stock value |
Promotion selection | Past lift by segment minus promotion cost | Margin after promotion cost |
Cash action | Projected cash below agreed buffer | Days cash falls below the buffer |
Risk escalation | Anomalies ranked by risk | Review time and false-positive rate |
Each example works like a smoke detector with a clear instruction attached. An alarm everyone learns to ignore protects nobody, and an alert with no owner, threshold or next step is the same thing in software form.
Please note: The cash, risk and compliance examples here are illustrative. They don't replace advice from qualified finance or compliance professionals for your specific obligations.
How to Measure Whether Insights Change Outcomes
You can't judge data driven insights by counting dashboards or logins. You judge them in the order value flows, from whether people use them, to how fast they act, to whether results moved.
Start With Adoption and Speed
Leading indicators tell you whether insights reach decision-makers. Track alert acknowledgement, drill-down frequency and recommendation acceptance by role and use case. An insight nobody opens can't change anything, and an insight everyone opens but nobody accepts is telling you something about trust or timing.
Next comes decision speed, the time from alert to verified action. Thresholds, owners and recommended next steps earn their keep here. If acknowledgement is fast but action is slow, the insight probably arrives without enough context to act on. Teams working through attribution problems face the same discipline, and it helps to make sense of marketing attribution before crediting any single touchpoint with an outcome.
Then Check Outcomes and Data Health
Lagging outcomes are the business results you set out to move. Stockout rate, margin, forecast error and cash buffer breaches all qualify, as long as you recorded a baseline before the change. Underneath everything sit data-health metrics, the share of records passing validation and average data age, which tell you whether the insights were trustworthy enough to act on in the first place. For help picking that small set, see ELECTE on choosing meaningful KPIs.
Metric group | Examples | What it proves |
|---|---|---|
Adoption (leading) | Alert acknowledgement, drill-down frequency, recommendation acceptance | Whether insights reach the people who make decisions |
Decision speed | Time from alert to verified action | Whether insights turn into action quickly |
Business outcomes (lagging) | Stockout rate, margin, forecast error, cash buffer breaches | Whether decisions improved results against a baseline |
Data health | Share of records passing validation, average data age | Whether the insights are trustworthy enough to act on |
Why Deployment Is Not the Finish Line
The gap between installing AI and profiting from it is well documented. McKinsey's 2025 global survey on the state of AI found that 39% of respondents attributed some level of enterprise EBIT impact to AI, while most of those respondents said less than 5% of their organization's EBIT was attributable to AI use. The survey also reported that 80% of respondents set efficiency as an objective for AI initiatives, although organizations achieving the greatest value often added growth and innovation objectives.
The lesson is direct. Measure cost reduction, revenue growth, workflow improvement and forecast accuracy instead of treating deployment as proof of value. Results vary by business, so set a baseline, compare after a defined period, and treat no single insight as a guaranteed return.
Pick One Decision to Turn Into an Insight Workflow
You don't need a transformation program. You need one recurring decision, worked end to end, until the habit sticks.
- Name the decision: Pick one, such as weekly reorders or monthly cash planning, and write down who makes it.
- Check the data first: List what it needs, confirm totals match a second source, note data age and flag gaps.
- Define the insight format: Fix the question it answers, the threshold that triggers it, the owner and the action it should prompt.
- Set a baseline: Track decision speed and one outcome, such as stockout rate or days cash falls below the buffer, for a full quarter.
- Review and adjust: Check whether behavior changed, then adjust the threshold or retire the insight.
As you set this up, it can help to compare leading business intelligence tools against your one decision rather than against feature lists. ELECTE, an AI-powered data analytics platform for SMEs, is one option for teams that want automated monitoring, forecasting and one-click reports, and it offers data analysis without requiring an analyst. Average setup time is 5 minutes, from connection to first insight. The platform helps you build the workflow, but your results still depend on data quality and decision discipline, and no outcome is guaranteed.
Ready to turn one recurring decision into a workflow you can measure? ELECTE connects your accounting, banking and spreadsheet data, then monitors it for anomalies, forecasts and reports you can act on without a dedicated analyst. Start with your first decision today and see what your data has been trying to tell you.
Comments
No comments yet — start the conversation.