How to Measure Compliance Risk: A Practical Scoring Guide
Learn how to measure compliance risk in five steps, from mapping obligations to scoring residual risk and tracking controls. Start your review today.

Your finance team says the filings are current. Operations says the checks are complete. The dashboard is green, yet nobody can explain which compliance failure would hurt the business most, or whether the controls would catch it before a customer or regulator did.
That's the practical problem behind how to measure compliance risk. You need more than a list of obligations and completed tasks. You need a defensible way to connect potential failures, business consequences, control evidence, and management action.
For an SME, this doesn't require a banking-grade model. It requires consistent scoring, named owners, reliable records, and a willingness to challenge reassuring numbers. A quiet dashboard should prompt a question: are controls working, or aren't you detecting the problems?
The method below turns obligations into a scored register, tests whether controls reduce exposure, and establishes a monitoring routine your team can maintain. The scales and thresholds are illustrative management settings, not legal requirements or universal benchmarks. Use them to structure decisions, then have a qualified professional confirm the obligations that apply to your business.
The Five-Step Process for Measuring Compliance Risk
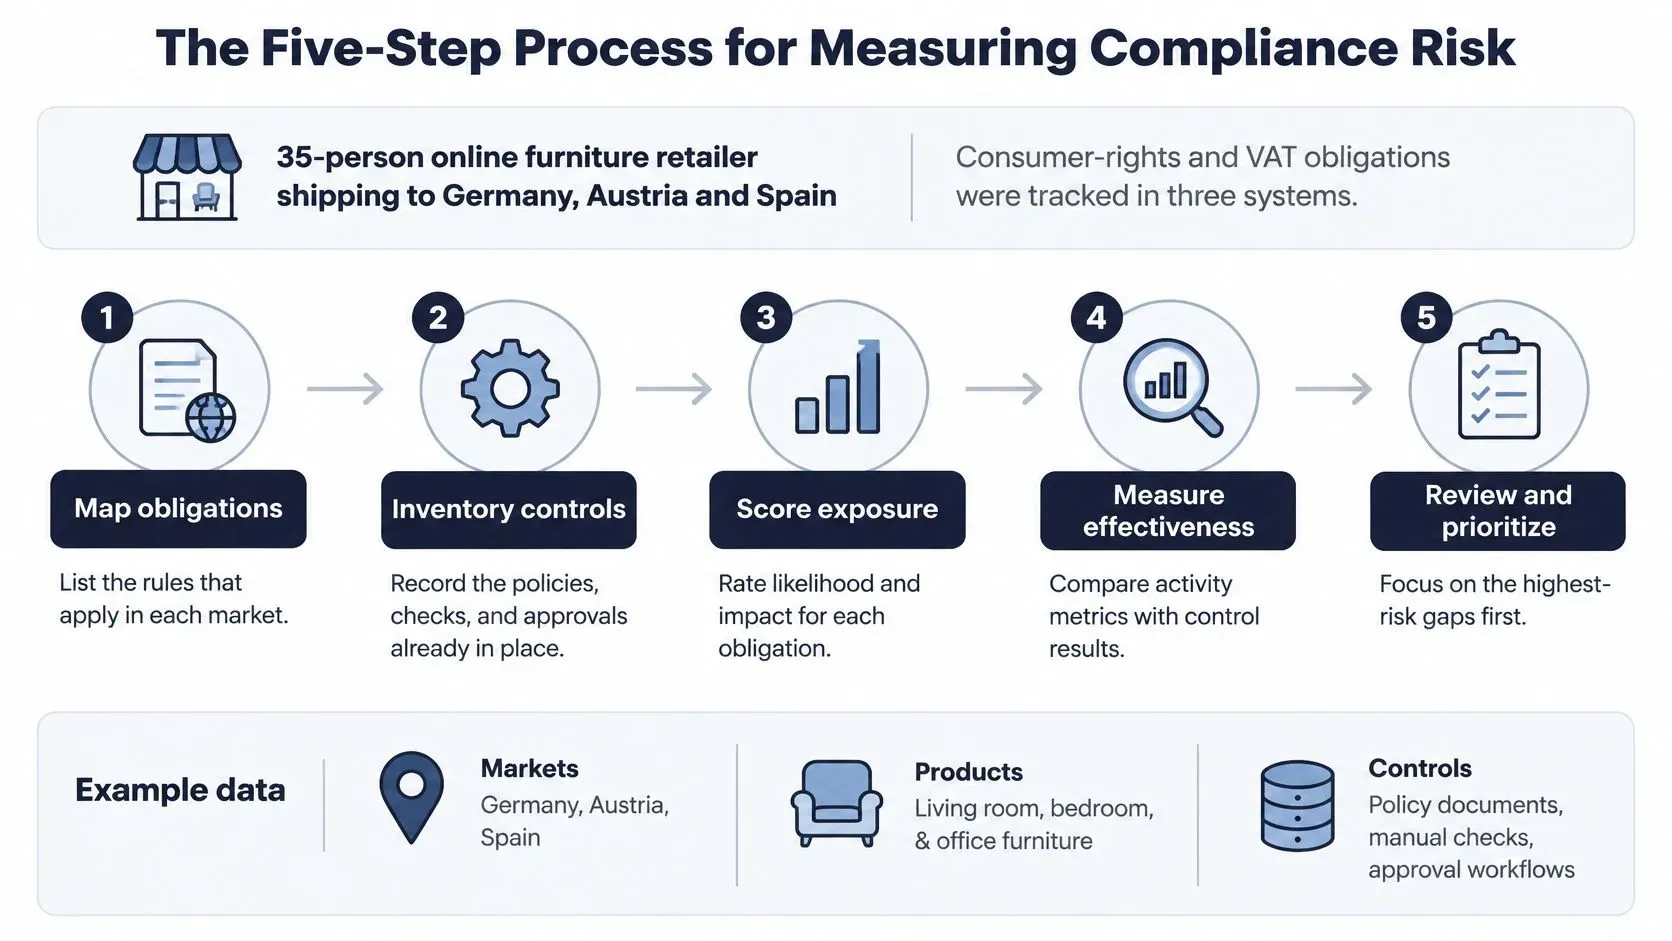
Say a 35-person online furniture retailer shipping to Germany, Austria and Spain discovers that its consumer-rights and VAT obligations sit in three different spreadsheets. Finance tracks filing tasks, customer service tracks refunds, and operations maintains delivery exceptions. Nobody owns the combined picture.
The immediate fix isn't another dashboard. It's a common register that connects each obligation to a failure scenario, an accountable person, and evidence of control performance.
Turn scattered obligations into a repeatable process
- Map obligations and exposure dimensions. List the laws, standards, and contracts relevant to the business, with professional help where interpretation is needed. Separate exposure by customer, geography, product, channel, and intermediary. The output is an obligation register, not a folder of legislation.
- Identify where a rule could fail. Walk through the actual process with the employee doing the work. For the retailer, that might mean following a return from the customer's request through approval and repayment. Produce a risk list with one accountable owner for each item.
- Score inherent risk. Assess likelihood and impact before giving credit for controls. Use the proposed likelihood and impact scales below to produce a scored register. This prevents a well-written policy from disguising a significant underlying exposure.
- Measure residual risk. Evaluate what existing checks prevent, detect, or correct. Use test results, exceptions, and supporting records rather than policy statements. The output is a residual rating with an explanation of the control credit awarded.
- Monitor and retest. Assign indicators, escalation rules, and review dates. Reassess after material changes rather than waiting for the next scheduled meeting. The output is a dashboard paired with a review calendar.
The FATF Recommendations provide a useful risk-based frame: assess relevant factors, document conclusions, keep assessments current, and apply proportionate measures. Their specific context is money laundering and terrorist financing, not every obligation facing a retailer.
Keep the first register usable
Start with a one-page view containing obligation, failure scenario, exposure, owner, inherent rating, control, test evidence, residual rating, and next action. Keep detailed evidence behind that summary rather than cramming every document into it.
Our step-by-step risk assessment process provides additional structure for organizing the assessment. The practical test is straightforward: can an owner explain the rating and retrieve the evidence without reconstructing the process from emails?
How to Identify and Score Each Compliance Risk
Describe each risk as a failure, not a topic. “Privacy” is too broad to test; “the marketing team cannot retrieve a consent record for a subscribed customer” identifies a process, an event, and evidence you can inspect.
Use this sentence pattern: During [process], [failure] could occur because [cause], resulting in [consequence]. A VAT example might identify a late return caused by incomplete transaction reconciliation, with the consequences confirmed by your tax adviser.
Documentation makes ratings reviewable. In 2023, 79% of respondents to White & Case's global compliance risk benchmarking survey reported conducting documented anti-corruption risk assessments. That finding concerns anti-corruption assessments, not a universal scoring standard, but it supports making your reasoning explicit.
Build scales that different owners can apply
The following is an illustrative scoring policy for an SME. The euro amounts are proposed internal thresholds, not statutory fines or estimates of enforcement outcomes.
- Define likelihood before controls. Use 1 for rare, less than once in five years; 2 for unlikely, but credible over several years; 3 for possible under foreseeable operating conditions; 4 for likely during normal operations; and 5 for almost certain, expected within a year. Clarify the assessment horizon so owners don't mix annual expectations with lifetime possibilities.
- Define impact for your business. An example scale is 1 for under €1,000 or rework only; 2 for a manageable departmental loss; 3 for a material budget impact or significant customer remediation; 4 for substantial disruption or regulator attention; and 5 for regulator action, licence risk, or loss above €100,000. Set explicit monetary boundaries for the middle categories using your finances, and use the highest applicable consequence rather than averaging away a serious legal outcome.
- Multiply likelihood by impact. On these proposed 1–5 scales, L × I produces an inherent score from 1 to 25. Treat this as a prioritization index, not a probability or a predicted euro loss. Identical totals can describe different problems, so retain both component scores.
- Assess exposure dimensions separately. Record customer, market, product or transaction, channel, and intermediary exposure before consolidating the rating. Keep a high-risk market visible as its own row or override flag. Don't let low-risk sales elsewhere dilute the decision.
- Record the basis and date. Attach relevant process records, incident history, complaints, operational changes, and the scorer's explanation. A second reviewer should be able to understand why the rating changed.
For technology-dependent processes, IT Cloud Global, LLC's resource on warning signs before systems fail offers a useful prompt for discussions with IT. Translate any relevant concern into a specific business failure rather than adding a generic technology-risk label.
Convert scores into decisions
Approve the response bands before reviewing individual results. Otherwise, managers may negotiate ratings to avoid an inconvenient action.
Risk score bands and required responses
Risk band | Score (L × I) | Typical trigger | Required response |
|---|---|---|---|
Low | 1–4 | Rare, contained, fixable within a week | Standard controls and annual review |
Moderate | 5–9 | Possible, fine or rework without external attention | Documented controls and quarterly testing |
High | 10–15 | Likely, regulator attention or material loss | Enhanced controls, monthly monitoring and owner sign-off |
Critical | 16–25 | Almost certain, enforcement or major loss | Immediate action, executive escalation and weekly review |
These are proposed internal bands, not regulatory categories. Some integers within them aren't attainable by multiplying the chosen scale values; the ranges make the response policy continuous.
Decision rule: Escalate a potentially severe legal consequence even when the multiplication produces a lower band.
An owner may accept a documented operational risk within delegated authority. They can't use a low score to waive a legal obligation.
Metrics That Show Whether Controls Actually Work
Training completed, reviews performed, and alerts generated measure activity. Control failures, repeat findings, and substantiated closure evidence help assess effectiveness. You need both, but they answer different questions.
A rising alert count could reflect deteriorating behavior, broader monitoring coverage, or an overly sensitive rule. Pair it with alert-to-case conversion and sampled investigations before deciding whether exposure increased.
The FATF guidance on risk-based supervision supports ongoing monitoring, timely intervention, and testing outcomes rather than assuming a framework works because it produces outputs. For your dashboard, segment every indicator by product, geography, customer type, and channel, with the relevant population size alongside it.
Build a scorecard with explicit denominators
The thresholds below are illustrative starting targets, not sourced industry benchmarks. Calibrate them against your own baseline, independent testing, risk appetite, and any applicable requirements.
Key risk indicators, formulas and review cadence
Indicator | Formula | Starting target | Review cadence |
|---|---|---|---|
Overdue high-risk reviews | Overdue high-risk reviews ÷ high-risk reviews due in the reporting period × 100 | Under 5% | Monthly |
Key control failure rate | Failed key-control tests ÷ completed key-control tests × 100 | Under 10% | Quarterly |
Repeat findings | Findings repeated from the prior audit ÷ total findings | Falling each cycle | Each audit |
Alert-to-case conversion | Alerts escalated into substantiated cases ÷ alerts assessed × 100 | Stable or rising as alerts fall | Monthly |
Median time to close an issue | Median days from detection to documented closure | Falling quarter on quarter | Monthly |
Remediation aging | Open remediation items past their approved deadline ÷ all open remediation items × 100 | Under 10% | Monthly |
Define exclusions and reporting cutoffs in a metric dictionary. Display “not calculable” when the denominator is empty, and show overdue-item counts beside percentages so a shrinking workload doesn't obscure unresolved work.
For training, VideoLearningAI's discussion of tracking compliance beyond completion rates provides a useful companion to the scorecard. Pair attendance records with scenario assessments and checks on whether employees apply the relevant procedure.

Calculate residual risk without pretending it's exact
A simple management calculation is:
Residual risk index = inherent score × (1 − demonstrated control-effectiveness share).
Determine that share from the latest tests of relevant controls. If controls have different importance, weight them before testing; don't give a minor administrative check the same influence as a critical approval. Untested controls receive no credit.
This is a directional index, not a calibrated loss model. Passing tests doesn't prove complete protection, so retain a documented uncertainty floor and require review of any apparently negligible residual score.
A control deserves credit for evidence of reduced exposure, not for having a policy number.
Back-test prior ratings against the incidents and near misses observed over the last year. Investigate high-rated risks with no incidents as well as low-rated risks with serious incidents; either pattern may reflect prevention, limited observations, or poor calibration.
Read failure rates alongside repeat findings. Stable failures with increasing recurrence suggest that teams close individual cases without fixing the cause.
When automating compliance reporting for SMEs, preserve source records, calculation definitions, test dates, and management explanations. That's how to measure compliance risk without turning a convenient dashboard into unsupported assurance.
How to Set Up Ongoing Monitoring and Reassessment
A risk assessment becomes outdated when the business changes. A new sales channel can alter transaction flows, a supplier change can weaken evidence access, and a revised product can introduce obligations that the old register doesn't capture.
The U.S. Department of Justice's Evaluation of Corporate Compliance Programs asks whether assessment criteria are periodically updated, whether reviews use continuous access to operational data, and whether findings produce changes to policies, procedures, and controls. These are useful design questions, not a claim that every SME faces identical requirements.
Give events and calendar reviews different jobs
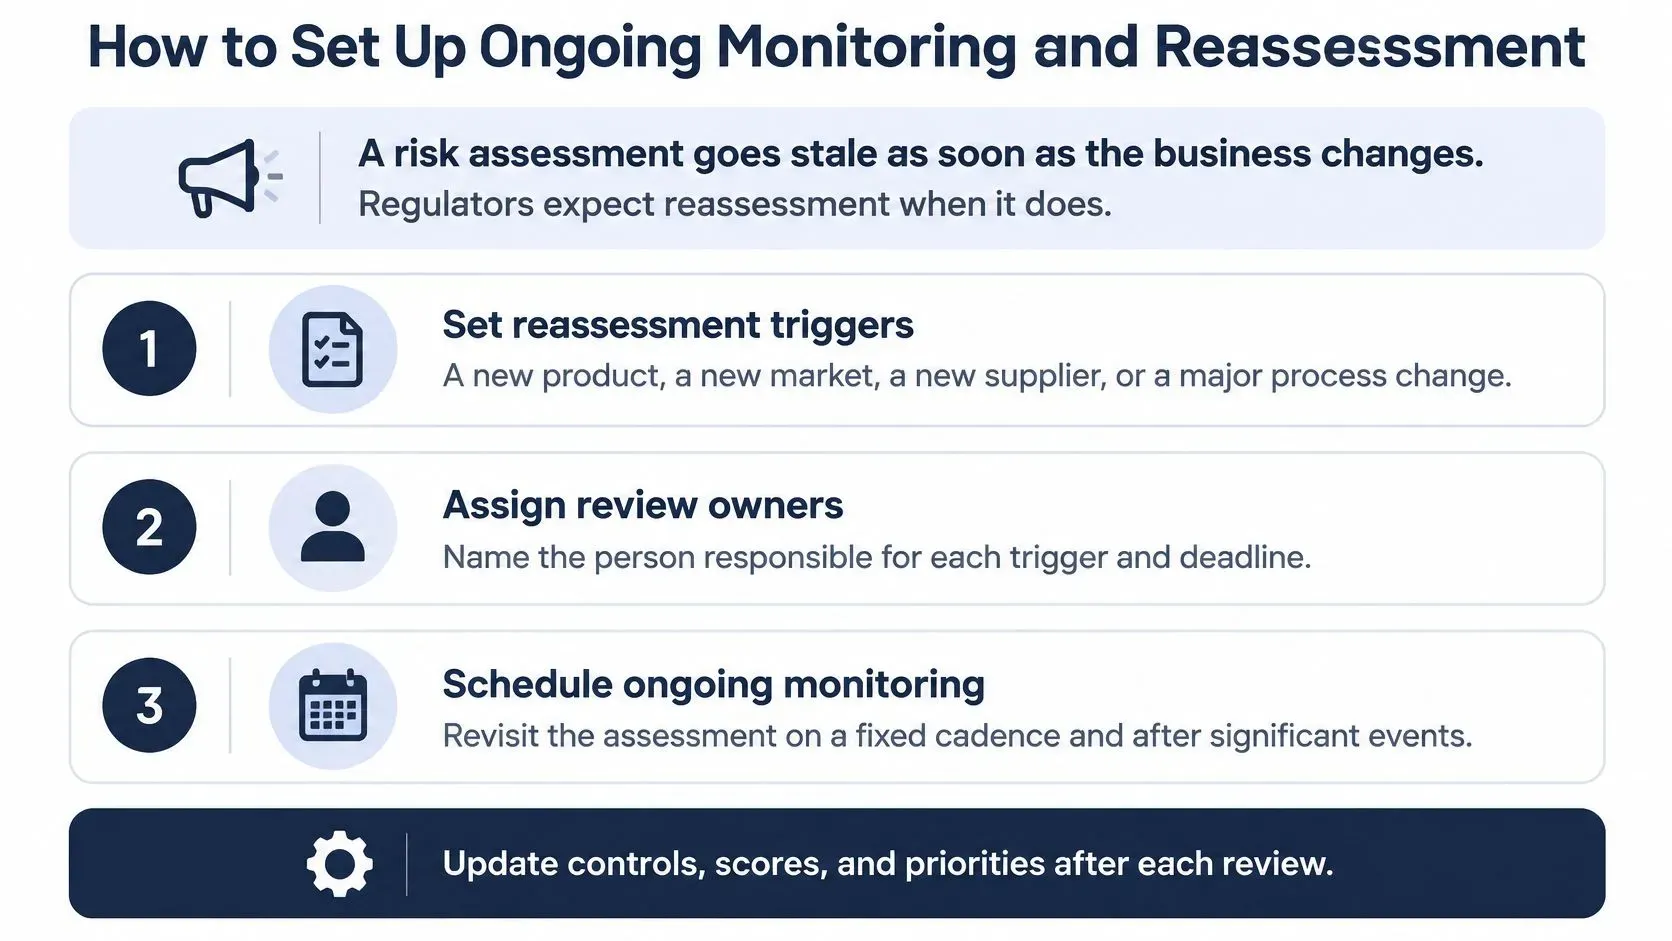
A calendar review asks whether anything has changed. A trigger identifies a specific event that requires an off-cycle decision. Maintain both, using the following as a proposed operating routine.
- Set reassessment triggers. Include a new product, market, channel, supplier, regulatory change, or confirmed incident. Assign someone to report each event and identify who decides the reassessment scope.
- Run monitoring rules where the records support them. Flag overdue reviews, unusual transactions, missing approvals, and expired evidence automatically where possible. Send exceptions to a named queue owner rather than an unattended shared inbox.
- Review the dashboard monthly with risk owners. Discuss threshold breaches, changed exposure, and overdue actions. Record the decision, accountable person, and deadline, including the reasoning when management accepts an exception.
- Retest key controls quarterly. Sample actual records across relevant markets, channels, staff, and exception paths. Verify both design, whether the check could address the failure, and operation, whether employees performed it correctly.
- Reassess annually and after a trigger. Compare current and previous scores, explain movements, and approve changed priorities. Avoid rewriting history by overwriting the earlier assessment.
For financial services, risk-based compliance for financial teams provides a focused example of matching monitoring intensity to exposure. Apply the same discipline to supplier and AI dependencies: identify the system owner, relevant data flows, subcontractor changes, and incident-escalation route.
Track coverage as well as speed
The U.S. Environmental Protection Agency's fiscal-year 2025 compliance-assurance results report more than 14,000 compliance-monitoring activities and 85% of inspection reports issued on time. These are agency operating measures, not SME performance targets; their relevance is the pairing of coverage with timeliness.
For your business, a fast investigation queue means little if important transactions never enter it. Reconcile the monitored population to the source system and investigate missing records before celebrating faster closure.
Our 2025 case study describes a fintech company using ELECTE, an AI-powered data analytics platform for SMEs, to automate financial reporting and ensure real-time regulatory compliance. The management lesson is to connect reporting with operational decisions, while retaining accountable human review.
Limit personal information in dashboards to what the reviewer needs. Apply role-based access, appropriate retention, and restricted evidence storage rather than circulating customer or employee records in exported presentations.
Common Measurement Mistakes and How to Fix Them
“No incidents reported” is a tempting conclusion to present as “low risk.” It might instead mean that employees don't report concerns, monitoring misses relevant activity, or nobody reconciles the incident log to operational records.
The distinction matters most when reassuring numbers influence staffing or control budgets. Challenge the measurement process before reducing oversight.
Diagnose the symptom before changing the score
- Quiet incident log. The symptom is little reported misconduct despite meaningful exposure. The cause may be weak detection or difficult reporting. Test detection using approved synthetic or seeded cases in a controlled environment, and verify that staff recognize, escalate, and document them without creating live customer harm.
- Green completion dashboard with unresolved problems. Training and review tasks finish on schedule, but familiar weaknesses keep returning. The cause is measuring task closure rather than corrective action. Report repeat findings separately and require evidence that the underlying process changed.
- Comfortable company average with a troubled market. The overall result looks acceptable while complaints or exceptions concentrate in a particular location. Aggregation is hiding the decision. Give the affected owner a market-specific view and require a local action plan rather than a company-wide assurance statement.
- Blank fields treated as safe. Missing supplier evidence or unavailable transaction records appear as zero exposure. The cause is a reporting default that confuses absence of information with absence of risk. Create a separate data-gap item, assign an owner, and withhold unsupported control credit.
- Thresholds frozen after growth. The dashboard stays green even though volumes, products, and dependencies have changed. The cause is an outdated calibration. Review threshold logic during the annual reassessment and whenever growth changes the exposure being measured.
Missing evidence is an uncertainty to manage, not a favorable result.
Handle sparse history honestly
An SME with few recorded incidents shouldn't pretend its scores are statistically precise. Label judgment-based estimates, state what evidence is missing, and use scenarios to examine plausible failures and consequences.
The Basel Committee's operational-risk guidance emphasizes institution-specific histories, business profiles, and attention to severe losses. Its banking context doesn't justify importing a complex model into an SME, but it supports resisting averages that conceal consequential events.
Use a practical scenario workshop: ask what happens if the responsible employee is absent, a supplier stops providing records, or an automated check stops running without notice. Record detection time, available fallback controls, likely disruption, and the decisions management would need to make.
These measures support compliance decisions. They don't replace advice from a qualified legal or compliance professional, especially when determining obligations, interpreting an incident, or deciding whether external reporting is required.
Run a Pilot Scoring Round This Quarter
Start with a bounded pilot rather than a company-wide rollout. Choose a product line or market with meaningful obligations, accessible records, and an owner who can authorize fixes. The most complicated area isn't always the best starting point if nobody can retrieve its evidence.
A pilot lets you test the method's cost as well as its usefulness. If maintaining a metric takes more effort than making the decision it supports, simplify the collection method before expanding.
Use a proposed 30-day plan
Week 1, Build the obligation register. List each relevant law, standard, and contract for the pilot scope, with an owner and evidence location. Resolve interpretation questions with the appropriate adviser rather than embedding assumptions in the register.
Week 2, Walk the processes and score failures. Speak to the employees performing the work and inspect actual handoffs. Apply the proposed 1–5 likelihood and impact scales, record the rationale, and ask another reviewer to challenge inconsistent ratings.
Week 3, Test the three most important controls. Select records that include routine transactions and exceptions. Document failures, calculate provisional residual ratings, and distinguish confirmed evidence from management estimates.
Week 4, Agree thresholds and review dates. Give each indicator an owner, denominator, escalation route, and first review date. Take unresolved disagreements to the compliance owner instead of leaving them hidden in spreadsheet comments.

Key Takeaways
- Keep a scored register. Every pilot risk needs an owner, evidence, and a documented response.
- Maintain a decision-ready dashboard. Include thresholds and escalation actions, not just colored status indicators.
- Prioritize verified weaknesses. Produce a short list of controls to fix first, with deadlines and retest criteria.
- Review before expanding. Book the pilot-results meeting with the compliance owner, then decide whether to extend to the next market.
For broader implementation planning, Fabio Lauria published the free whitepaper AI for European SMEs: The 2026 Playbook in February 2026, covering decision frameworks, ROI calculations, and implementation playbooks.
Knowing how to measure compliance risk means being able to explain what could fail, why a control deserves credit, and what management will do next. Before launching the pilot, confirm its scope with your compliance owner and schedule the results review. This is general guidance, not legal advice; qualified legal or compliance professionals should confirm your obligations.
ELECTE offers AI-powered analytics, automated reports, and dashboards to help SMEs turn operational records into compliance insights. Visit ELECTE to see how you could support pilot-register updates, KRI calculations, and monthly reviews while keeping responsibility for compliance decisions with your team.
Comments
No comments yet — start the conversation.