Analytics in Finance: How Forecasting and Risk Work
Learn how analytics in finance turns raw data into forecasts and risk controls. See how ELECTE applies it.

Your cash spreadsheet says you can afford the next hiring round. Your bank balance looks less reassuring. Meanwhile, a major customer has missed a payment, and the board wants next quarter's outlook before you've finished reconciling this month's accounts.
You don't necessarily need a more complicated model. You need to know which numbers you can trust, what might change, and who should check a recommendation before anyone acts on it. That's the practical starting point for analytics in finance.
For SMEs, the opportunity isn't to produce more reports. It's to turn accounting records, payment histories, and operating activity into earlier warnings and better-informed decisions, without adding an endless cycle of spreadsheet maintenance.
The important distinction is between an interesting prediction and a dependable decision process. A forecast needs assumptions and a test of its accuracy. A risk alert needs supporting evidence and a reviewer. Understanding those foundations makes it easier to choose useful forecasting methods, interpret financial signals, and introduce automation without surrendering control.
What Analytics in Finance Means and Why It Matters
Analytics in finance is the use of data, statistics, and models to explain past results, forecast cash and revenue, measure risk, and support decisions.
A finance manager can feel the pressure in a single week. On Monday, the question is whether incoming payments will cover payroll. By Wednesday, a late-paying client has changed that calculation. On Friday, the board wants to know whether next quarter's revenue outlook supports an expansion.
Each question sounds separate, but they share one dependency: the numbers underneath them. If bank feeds, invoices, payroll, and account codes disagree, even a careful model will produce confident-looking confusion. Financial analytics turns those questions into a repeatable process where the inputs are checked, the assumptions are visible, and the output can be challenged before it becomes a decision.

From reporting to an early warning
A dashboard works like a car's instrument panel. It does not repair the engine, but it can warn about low oil before the engine seizes. A cash dashboard should do the same: surface a deteriorating outlook early enough for someone to inspect the cause and act.
That changes the purpose of analysis. The useful output is an answer to a business question, plus the evidence needed to judge whether the answer deserves trust. A forecast should carry its assumptions. A risk alert should show what triggered it. A recommendation should name who must review it when the decision matters.
This discipline is older than current software. The Bank for International Settlements' historical overview records international banking data published from 1964 and the 1988 Basel Capital Accord, which tied minimum capital requirements to credit-risk measurement.
The lesson still applies: when model outputs influence capital, credit, hiring, or compliance, governance is part of the analysis.
Match the analysis to the institution
The same underlying discipline applies across organizations, although their financial structures differ. A retailer may care most about demand and inventory cash cycles. A lender may care more about arrears, concentration, and covenant headroom. A church extension fund still needs forecasting and evidence, while its context is specialized enough that CEFCore for church extension funds is a more relevant reference than a generic small-business checklist.
Practical rule: Start with the decision someone needs to make, then identify the evidence required to support it.
The core capabilities span data preparation, descriptive reporting, diagnosis, forecasting, scenario comparisons, and risk monitoring. Their value depends on reliable inputs and defensible checks, because the algorithm is usually the easiest part to buy and the hardest part to defend is whether the data, model choice, and approval path were sound.
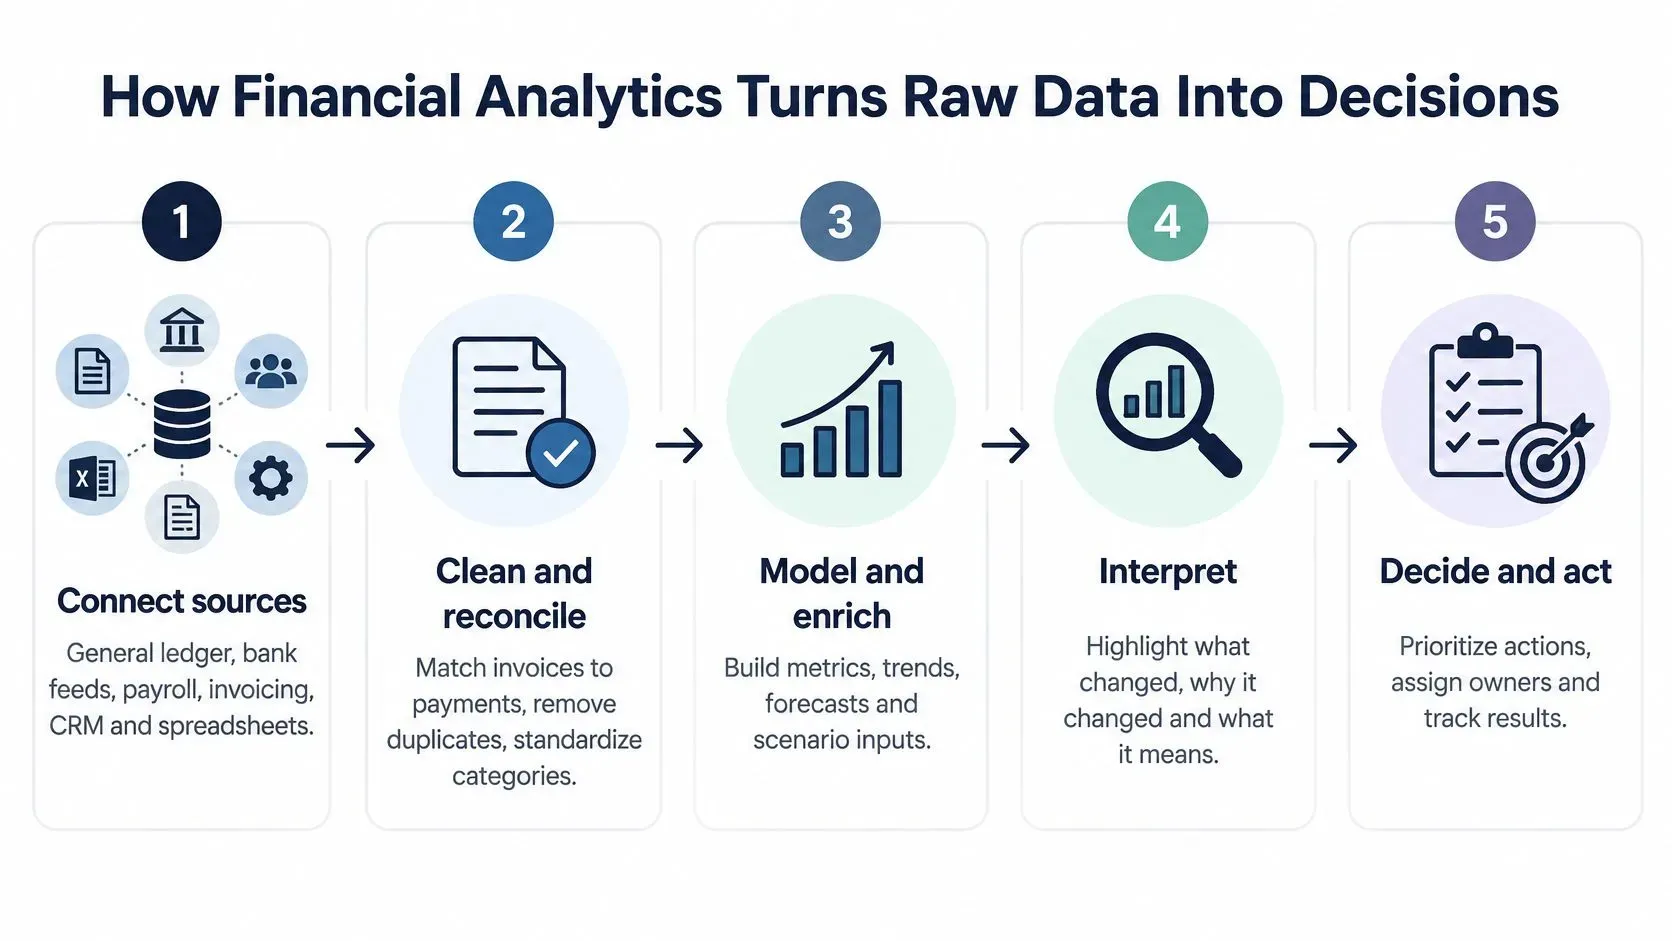
How Financial Analytics Turns Raw Data Into Decisions
A trustworthy result begins before you fit a model. First, establish where each record came from and whether different systems describe the same activity consistently.
Build a repeatable workflow
- Connect sources. Bring together the general ledger, bank feeds, payroll, invoicing, customer relationship management system, and relevant spreadsheets. The output is a source inventory with owners and refresh schedules. A common failure is mixing reporting periods or currencies without identifying the difference.
- Clean and reconcile. Match invoices to payments, remove duplicates, and map account codes to consistent categories. The output is a reconciled dataset. Mismatched account codes can make an apparent cost increase nothing more than a classification change.
- Model. Apply trends, regression, or classification to the cleaned history. Regression estimates relationships between variables; classification assigns categories or probabilities, such as whether an invoice will be late. The output is a forecast or score, not yet an approved decision.
- Validate. Test the model against historical periods it hasn't used for training and compare it with a simple baseline. The output is an evaluation record. An advanced model that beats no meaningful alternative hasn't established its usefulness.
- Report and act. Publish a dashboard or alert, assign an owner, and define approval requirements. The output is a tracked action. Without ownership, even an accurate warning can remain unread.
Measure readiness before model complexity
In a global survey of 1,013 senior finance leaders across 20 countries, 36% identified data quality, integration, and system interoperability as the greatest opportunity to extract more value from AI in finance, according to KPMG's AI in finance report.
Make readiness measurable:
- Complete identifiers: Track the share of transactions with usable customer, invoice, account, and date fields.
- Reconciliation breaks: Record unresolved differences by source, rather than hiding them in an overall total.
- Dataset preparation time: Measure how long it takes to produce information finance can trust.
Assign someone who understands both accounting logic and analytical testing. If you're evaluating that role, HireAccountants' Hire Financial Analysts resource provides a starting point for staffing discussions.
Protect personal and financial information throughout the workflow. Restrict access, minimize copied records, and establish retention and deletion rules before connecting sensitive sources.
Prefer a transparent model on dependable inputs to an advanced model whose inputs you can't reconcile.
Four Types of Financial Analytics Compared
The four types form a ladder, from describing past activity to recommending an action. They're related, but they don't answer interchangeable questions.
Four types of financial analytics and what they answer
Type | Question it answers | Finance example | Typical output |
|---|---|---|---|
Descriptive | What happened? | Monthly revenue against budget and cash balance trend | Dashboard and standard variance report |
Diagnostic | Why did it happen? | Gross margin drop traced to one product line or one region | Drill-down analysis and root-cause summary |
Predictive | What is likely to happen? | Next quarter cash position or late-payment probability per customer | Forecast with a confidence range and risk score |
Prescriptive | What should we do? | Comparing a payment-term change against a credit-limit cut to keep cash above a floor | Scenario comparison with a recommended action and its trade-offs |
Identify the question before choosing a method
Teams begin with descriptive reporting. When a variance appears, they add diagnostic investigation. Predictive work estimates what could happen next, while prescriptive work compares possible responses.
Say your margin report shows a decline. That's descriptive. Separating discounting, supplier costs, and product mix is diagnostic. Estimating future margin under those conditions is predictive. Comparing a price increase with a supplier change is prescriptive.
Use this quick classification test:
- Historical result: An answer drawn from recorded activity is descriptive.
- Explanation: An investigation into contributing factors is diagnostic.
- Future estimate: A projected value with uncertainty is predictive.
- Action comparison: A recommendation based on alternatives and constraints is prescriptive.
Be careful with the word cause. A relationship between marketing spending and revenue doesn't prove that spending caused the revenue change. Promotions, seasonality, or changes in customer mix may explain both.
Prescriptive recommendations also inherit weaknesses from their predictive inputs. A system can recommend a precise credit-limit reduction while relying on a poorly calibrated late-payment model. Confidence in the presentation isn't evidence of reliability.
Everyday Applications From Cash Flow to Month-End Close
Useful applications connect an operational decision to a measurable financial outcome. Choose the decision first, then decide which dashboard, forecast, or exception report will help.
Where the work becomes practical
- Cash flow forecasting: Use a rolling view of expected receipts and payments to decide when to defer spending or arrange funding. For an illustrative setup, a 13-week horizon can flag a projected balance below management's minimum.
- Budget against actual variance: Flag lines that exceed an agreed percentage or amount. Reviewers can investigate material exceptions instead of reading every account with equal attention.
- Receivables and collections: Group invoices by age and prioritize customers likely to slip. Illustrative buckets are 0–30, 31–60, and 61–90 days, with disputed invoices identified separately.
- Payroll and demand forecasting: Align hiring, shift coverage, and inventory purchases with expected activity. Track the financial effect through staffing costs, stock commitments, and available cash.
- Month-end close: Automate matching where rules are clear and send unresolved differences to an exception queue. Measure completion against the close deadline, not just the number of automated matches.
- Board reporting: Assemble approved KPIs, forecasts, and commentary into a consistent pack. The resource ELECTE guide to financial reporting provides further context on AI-supported financial reporting.
An illustrative collections decision
Suppose a 40-person services firm finds that 18% of its invoices are more than 60 days overdue. These are hypothetical figures, not a benchmark or a reported customer result.
The team initially considers sending stronger reminders to everyone. Analysis instead shows that the overdue balance is concentrated in two clients. One has an unresolved purchase-order issue; the other routinely pays after its contractual deadline.
The appropriate actions differ. Resolve the documentation problem with the first client, and assign a collections conversation to the second. Track days sales outstanding monthly alongside overdue invoice counts.
Measure the business outcome, not the volume of automated activity.
Benefits worth testing include fewer missed close deadlines, fewer overdue invoices, earlier warning of a cash shortfall, and less time assembling board packs. Establish a baseline before making changes. Results will vary with the business, its processes, and the quality of its records.
Forecasting Methods and How to Choose One
A useful forecast communicates uncertainty, not just a single number. For future cash or revenue, a prediction interval describes a range of possible outcomes; a confidence interval around the estimated average answers a narrower statistical question.
Neither range protects you against every disruption. A lost customer, unexpected tax payment, or supply interruption may require a separate scenario.
Match the method to the available history
The history lengths below are illustrative planning starting points, not universal minimums. Data frequency, missing periods, seasonality, and structural changes affect what's sufficient.
Common forecasting methods for financial planning
Method | Best for | Data needed | Main limit |
|---|---|---|---|
Moving average | Stable short-term sales or expenses | An illustrative starting window of six or more recent periods | Lags behind turning points and ignores seasonality |
Exponential smoothing (Holt-Winters) | Seasonal revenue or demand | An illustrative starting history of two to three years of monthly data | Weak when sudden shocks change the pattern |
ARIMA | Stable series with clear autocorrelation | An illustrative starting history of three or more years of consistent data | Needs stationarity checks and expert tuning |
Regression with drivers | Linking sales to price, marketing spend, or headcount | History of the driver variables plus the target | Assumes the driver relationship still holds |
Gradient boosting (machine learning) | Many variables and nonlinear patterns | Large, clean, well-labelled dataset | Harder to explain; needs backtesting and monitoring |
Autocorrelation means current observations relate to earlier observations. Stationarity concerns whether a series' statistical properties remain sufficiently stable for the modeling approach.
Start by checking the amount of clean history you have. Then ask whether activity follows a seasonal pattern and whether external drivers materially affect the outcome.
For a deeper explanation of model settings, consult the guide to choosing ARIMA parameters for forecasting.
Test what the model couldn't have known
For an illustrative monthly test, hold out the last three months, train only on earlier records, and forecast the withheld period. Calculate mean absolute error by averaging the absolute differences between forecast and actual values in currency terms.
Compare that result with a naive forecast that repeats the previous period's value. Use the same forecast horizon and evaluation dates for both methods.
Also check for data leakage. A forecast made before month-end cannot legitimately use invoices, adjustments, or customer information recorded afterward.
In Deloitte's 2025 EMEA Model Risk Management Survey, 67% of banks surveyed used AI or machine-learning techniques in their models, compared with 56% in 2023. That adoption signal makes careful model selection and governance practical concerns, not merely technical specialties.
Risk Monitoring and Financial Crime Detection
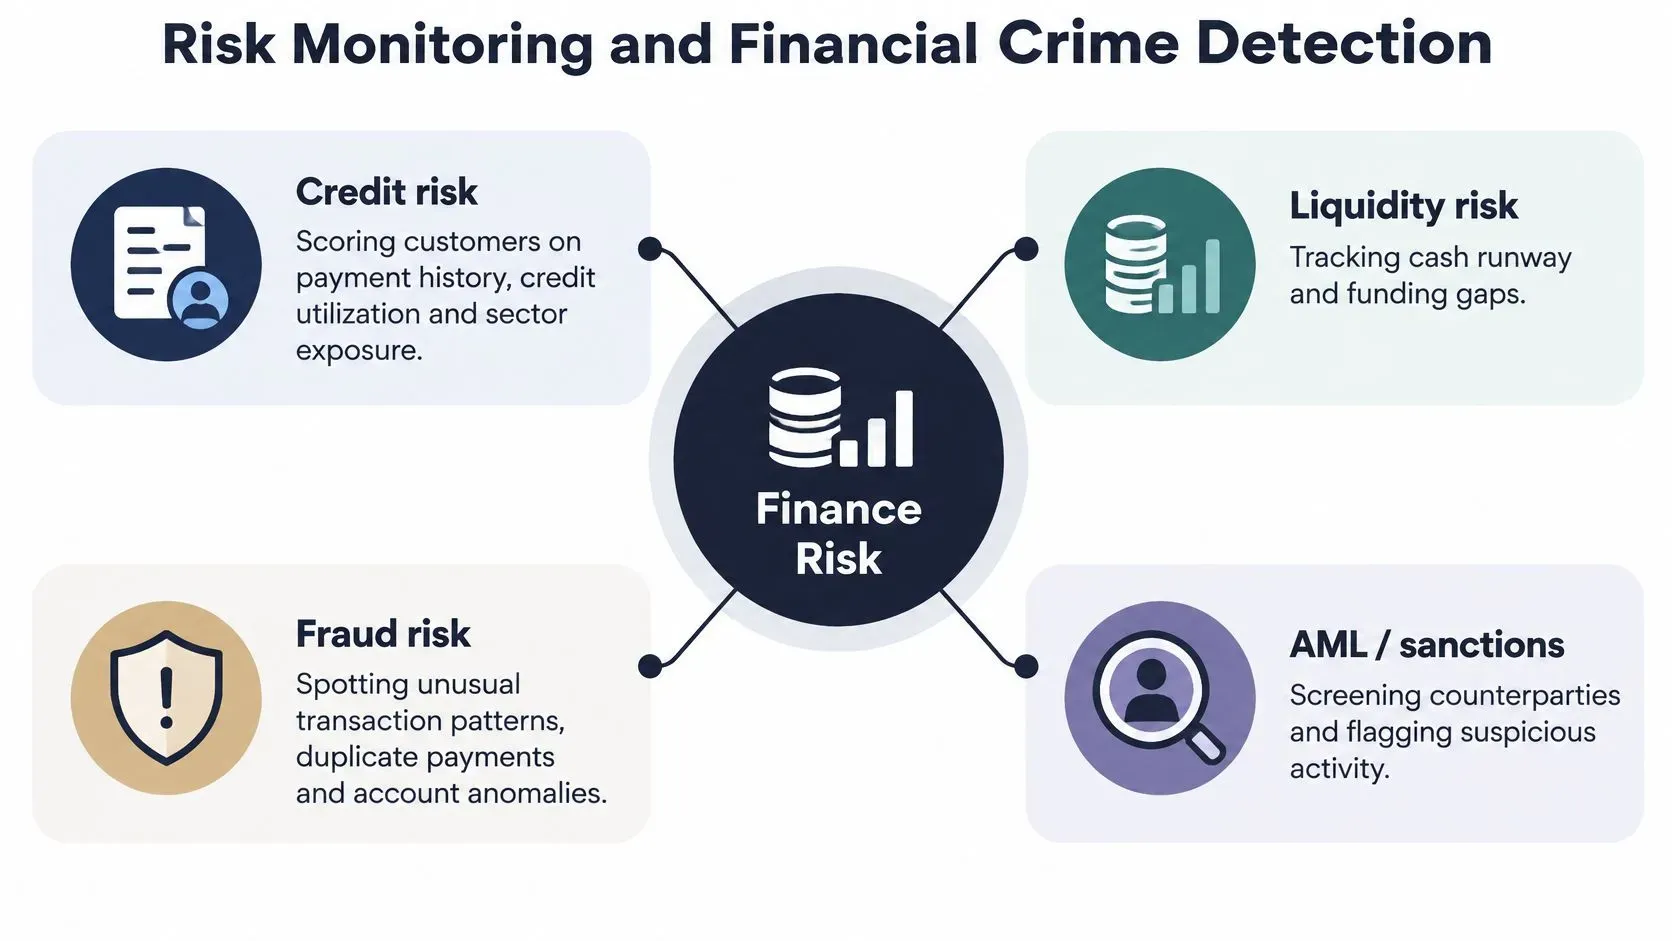
Risk monitoring connects a financial exposure to a signal and an agreed response. An alert should tell the reviewer what changed, which records support it, and why the change matters.
Risk areas, signals and example triggers
Risk area | Signal to monitor | Example trigger |
|---|---|---|
Credit risk | Payment history, credit utilization, sector exposure | Customer score falls below an agreed cutoff |
Liquidity risk | Cash runway and covenant headroom | Runway drops below the trigger set by management |
Market and currency risk | Sensitivity to rate and exchange-rate moves | Exposure exceeds the approved limit |
Financial crime | Linked transactions and sanctions screening hits | Related payments reach an applicable due-diligence threshold, or activity warrants investigation |
For credit risk, distinguish a deteriorating payment pattern from an administrative dispute. For liquidity, monitor both available cash and covenant headroom, the margin before a financing condition is breached. For market and currency exposure, stress relevant rates rather than assuming current conditions will persist.
The guide assess your company's financial exposure offers additional context for assessing business financial exposure.
Aggregate related activity
The FATF Recommendations set USD/EUR 15,000 as the designated threshold for occasional transactions under Recommendation 10, including transactions handled in one operation or several that appear linked; they also permit a lower de minimis threshold, capped at USD/EUR 1,000, for certain cross-border payments or value transfers other than cash withdrawals.
These are contextual due-diligence requirements, not universal definitions of suspicious activity. Configure rules for the relevant jurisdiction and transaction type, and aggregate linked payments rather than assessing each independently.
Screening should consider origin and destination country, value, transaction nature, and customer and beneficiary names against relevant sanctions lists. FATF guidance on financial inclusion and AML/CFT measures also makes clear that genuine suspicion remains actionable regardless of normal thresholds or exceptions.
Investigate networks, not just payments
The BIS discussion of Project Aurora describes graph neural networks and privacy-enhancing methods for detecting complex money-laundering structures. Relationships such as shared beneficiaries and transaction paths can reveal coordinated behavior that isolated payment rules miss.
Use those models to prioritize human investigation, not automatically reject transactions. Preserve the relevant account links and reasons for escalation.
When an anomaly needs a deeper examination of records and evidence, Snyp's guide to forensic accounting provides useful context for distinguishing routine monitoring from investigative work.
Governing Models So Results Stay Defensible
Accuracy doesn't equal safety. A model can perform well overall while producing unreliable results for a particular customer group, economic condition, or decision type.
Federal Reserve model-risk materials identify backtesting, benchmarking, conceptual-soundness review, and outcomes-based testing as core evaluation techniques. An explanation chart alone isn't a substitute for those checks.
Preserve evidence from input to decision
Separate development, validation, and ongoing monitoring data. Document feature lineage, meaning where each model input originated and how it was transformed.
Track calibration, stability, and errors over time. Calibration asks whether predicted probabilities correspond to observed outcomes; stability checks whether inputs or behavior have changed.
Maintain a compact control record:
- Model purpose: Specify the decision supported and prohibited uses.
- Validation evidence: Record performance against an interpretable baseline and relevant segments.
- Threshold history: Version every cutoff with its rationale, owner, and review date.
- Decision trail: Preserve the input snapshot, output, reviewer, and resulting action.
The European Parliament's report on AI in the financial sector identifies poor data quality, non-representative training data, opaque models, privacy risks, discriminatory outcomes, and language-model hallucinations as material risks; the assurance evidence cited reports error-reduction improvements at 33% versus 6% among peers and confidence in scaling AI at 42% versus 14%.
Those findings support investment in assurance, not a guaranteed improvement for your business.

Define where autonomy stops
Make human approval mandatory under your operating policy before consequential automated lending, fraud, or collections actions. Also require review when data is incomplete, the model encounters unfamiliar conditions, or a recommendation exceeds an approved authority limit.
Controlled autonomy means delegating routine work while retaining explicit boundaries and evidence.
Correct three persistent misconceptions: more data isn't always better, especially when it adds noise or bias; a forecast isn't a statement of truth; and automation doesn't remove accountability. Someone must remain responsible for deciding whether an output is fit to act on.
Start With One Use Case This Quarter
A focused pilot lets you test usefulness without redesigning the whole finance function.
- Choose one recurring decision. Start with collections priorities or a monthly cash forecast. Name the person who will use the result.
- Check readiness. Record identifier completeness, reconciliation breaks by source, and hours required to assemble a trusted dataset.
- Establish a baseline. Build a simple forecast and evaluate it on withheld history before introducing greater complexity.
- Set operating boundaries. Define validation rules, approval thresholds, and a named owner for every alert.
- Review after the quarter. Compare forecast error, useful alerts, and preparation time with the starting position. Keep, revise, or stop the pilot based on those results.
ELECTE, an AI-powered data analytics platform for SMEs, supports this sequence with predictive analytics, automated reports, and AI agents. Our AI Agent reads data, writes reports, and researches markets on schedule or on demand, 24/7.
Most users are operational in under 5 minutes, with initial analysis and forecasts beginning after connecting accounting software or uploading a file. That setup speed doesn't replace validation. We also provide free tools, including an ROI calculator, reorder point calculator, net invested capital calculator, percentage discount calculator, reclassified balance sheet, and company profile.
Key Takeaways
- Start narrow: Tie the pilot to a recurring financial decision.
- Test trustworthiness: Reconcile inputs and compare forecasts with a baseline.
- Keep accountability: Assign reviewers and preserve evidence.
- Measure outcomes: Evaluate decision usefulness and time saved before expanding.
Turn insight into a dependable routine
The strongest starting point for analytics in finance isn't the most advanced algorithm. It's a clearly defined decision, supported by records you can reconcile and outputs you can challenge. Forecasting becomes useful when you understand its uncertainty. Risk monitoring becomes actionable when reviewers can inspect the evidence behind an alert.
Start with a manageable pilot and give it a clear owner. Keep the methods simple enough to evaluate, document the conditions that require intervention, and measure whether the result improves the work. That approach gives you a sounder basis for expanding automation than a polished dashboard alone. A personalized demo can help you assess how the workflow would fit your finance team.
This guide provides general information, not financial, legal, or compliance advice. Check local regulations and consult qualified advisors before acting.
ELECTE offers forecasting, automated reporting, and an AI Agent to help you turn financial records into reviewable insights. Visit ELECTE to see how it works or request a personalized demo focused on your cash forecast, collections workflow, or reporting pilot.
Comments
No comments yet — start the conversation.